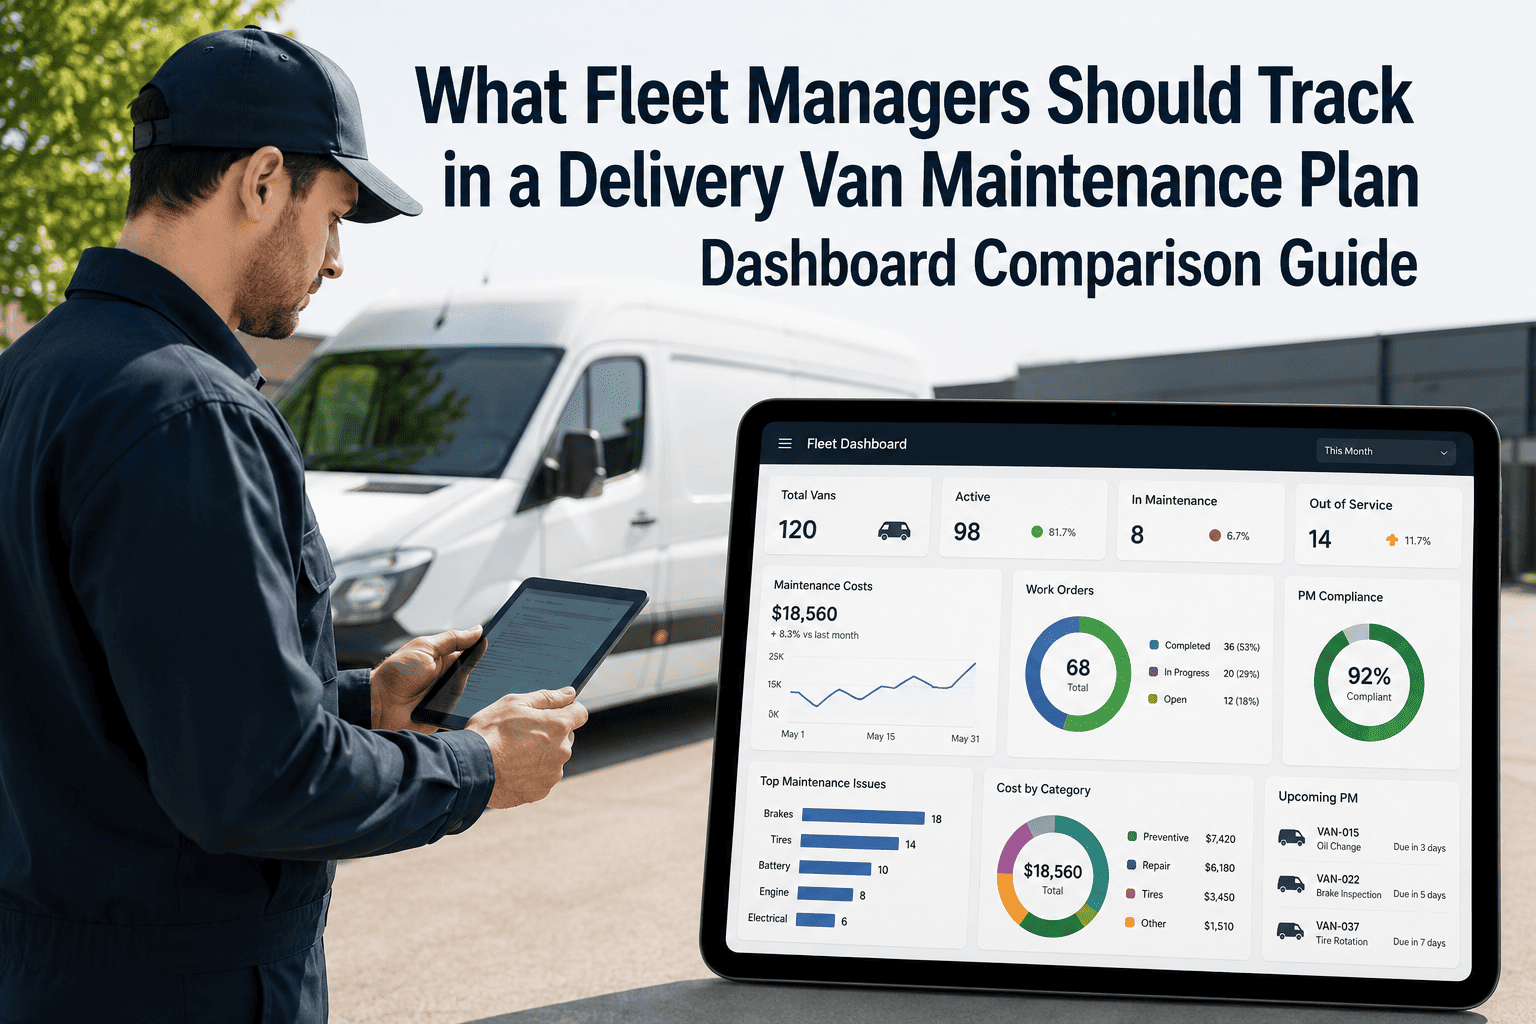
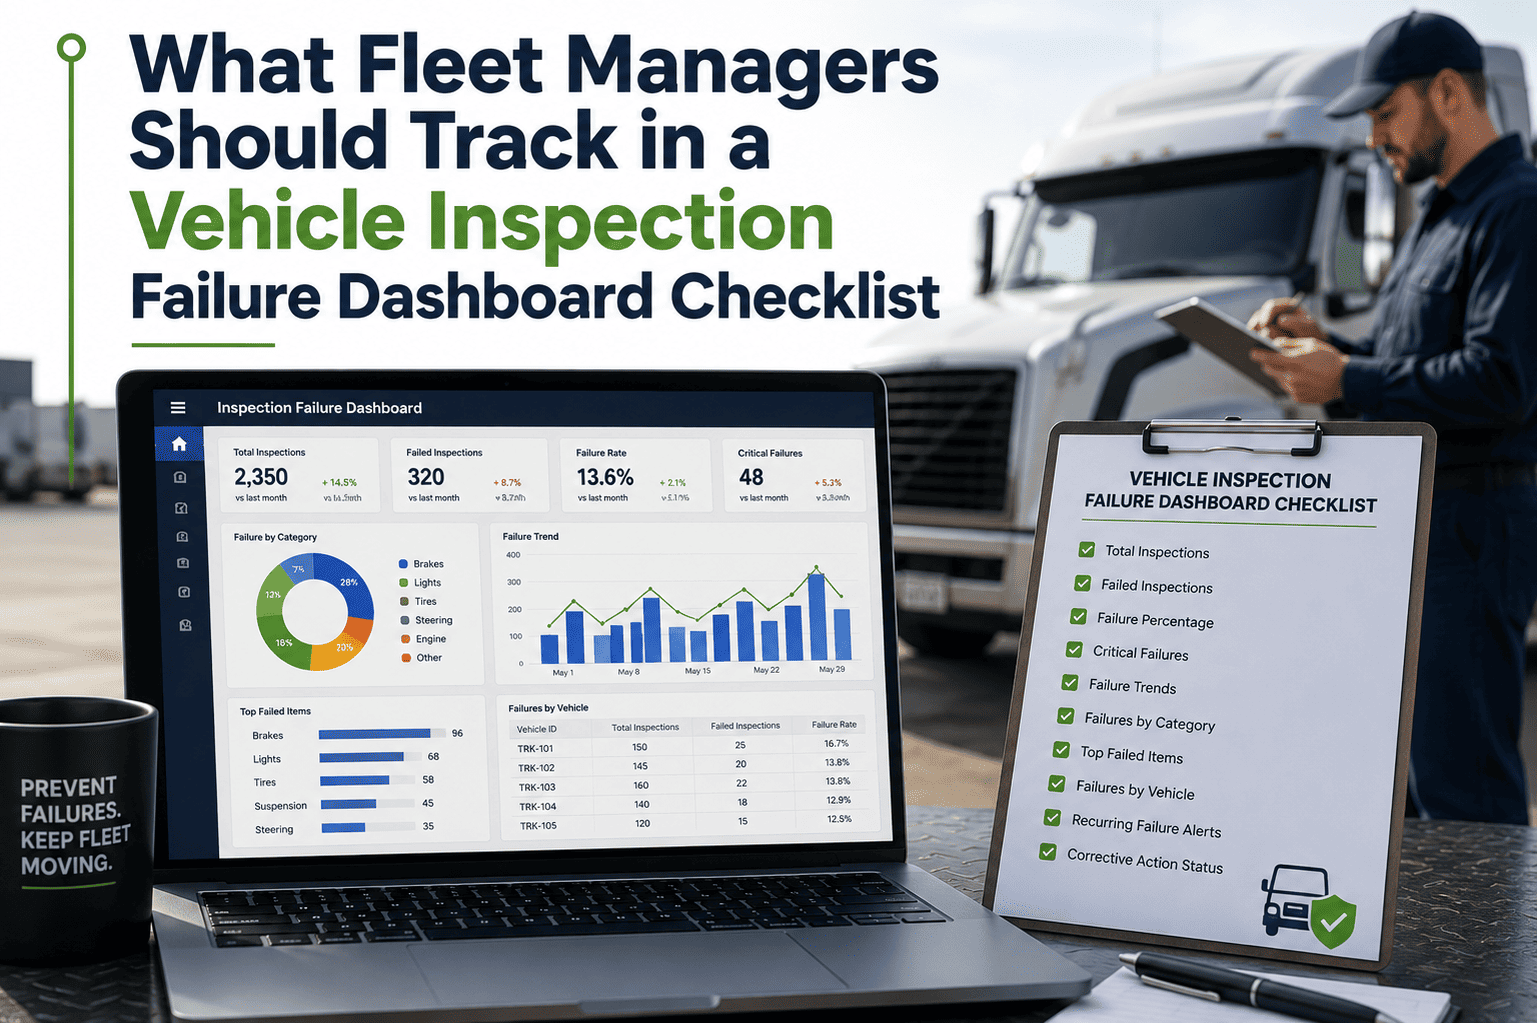
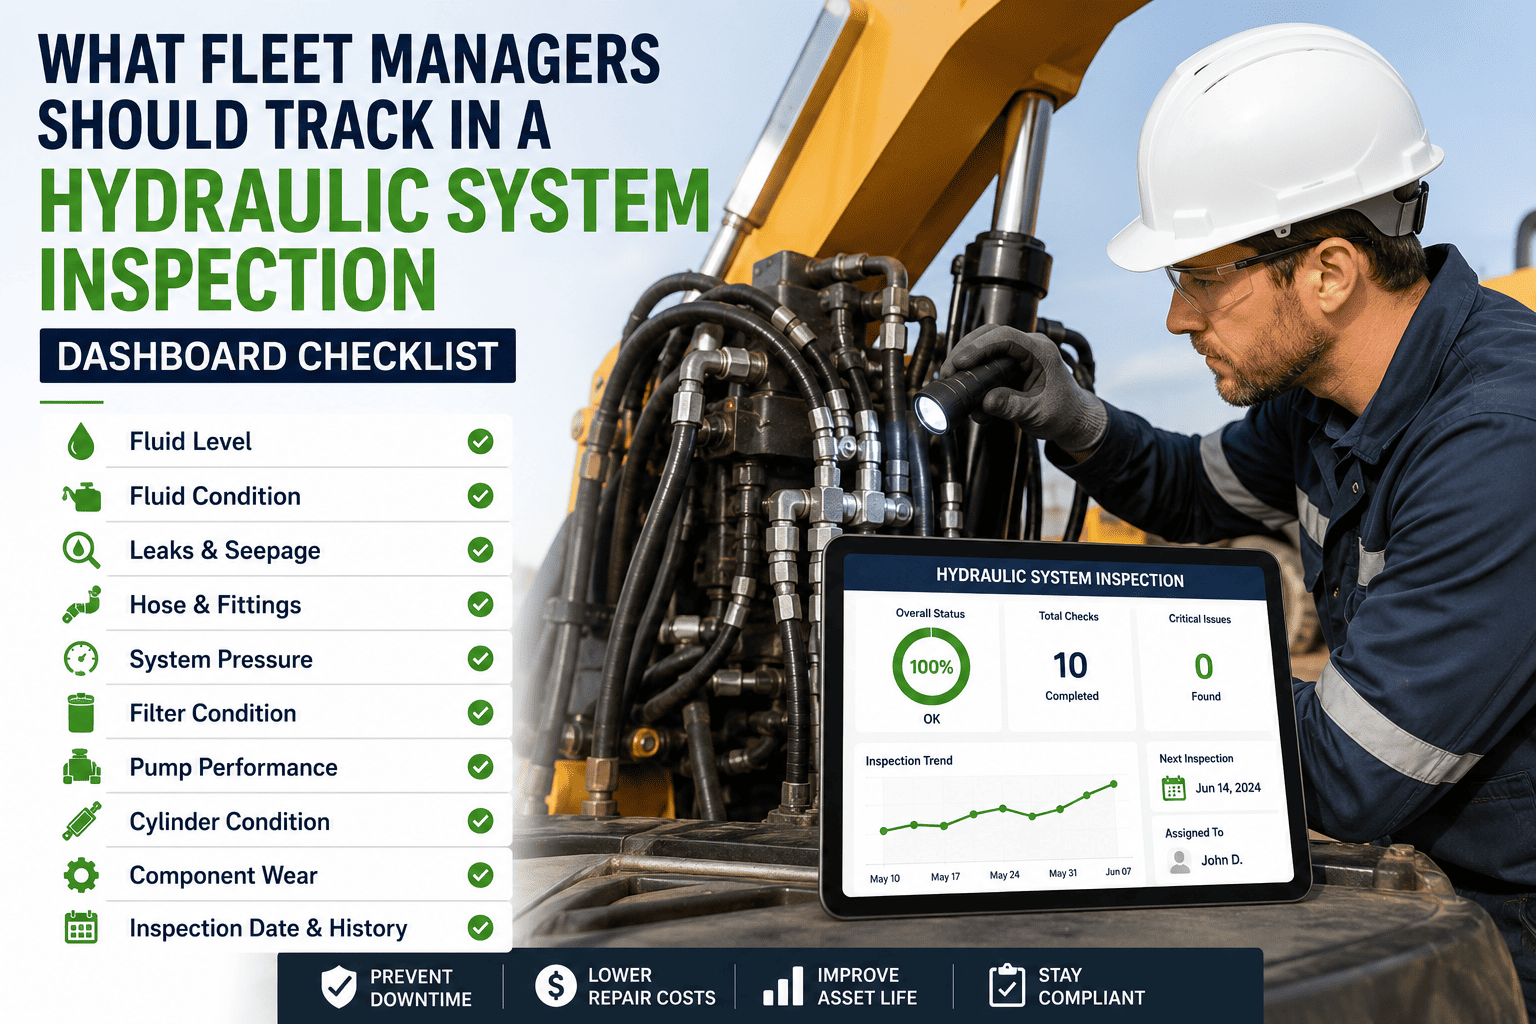
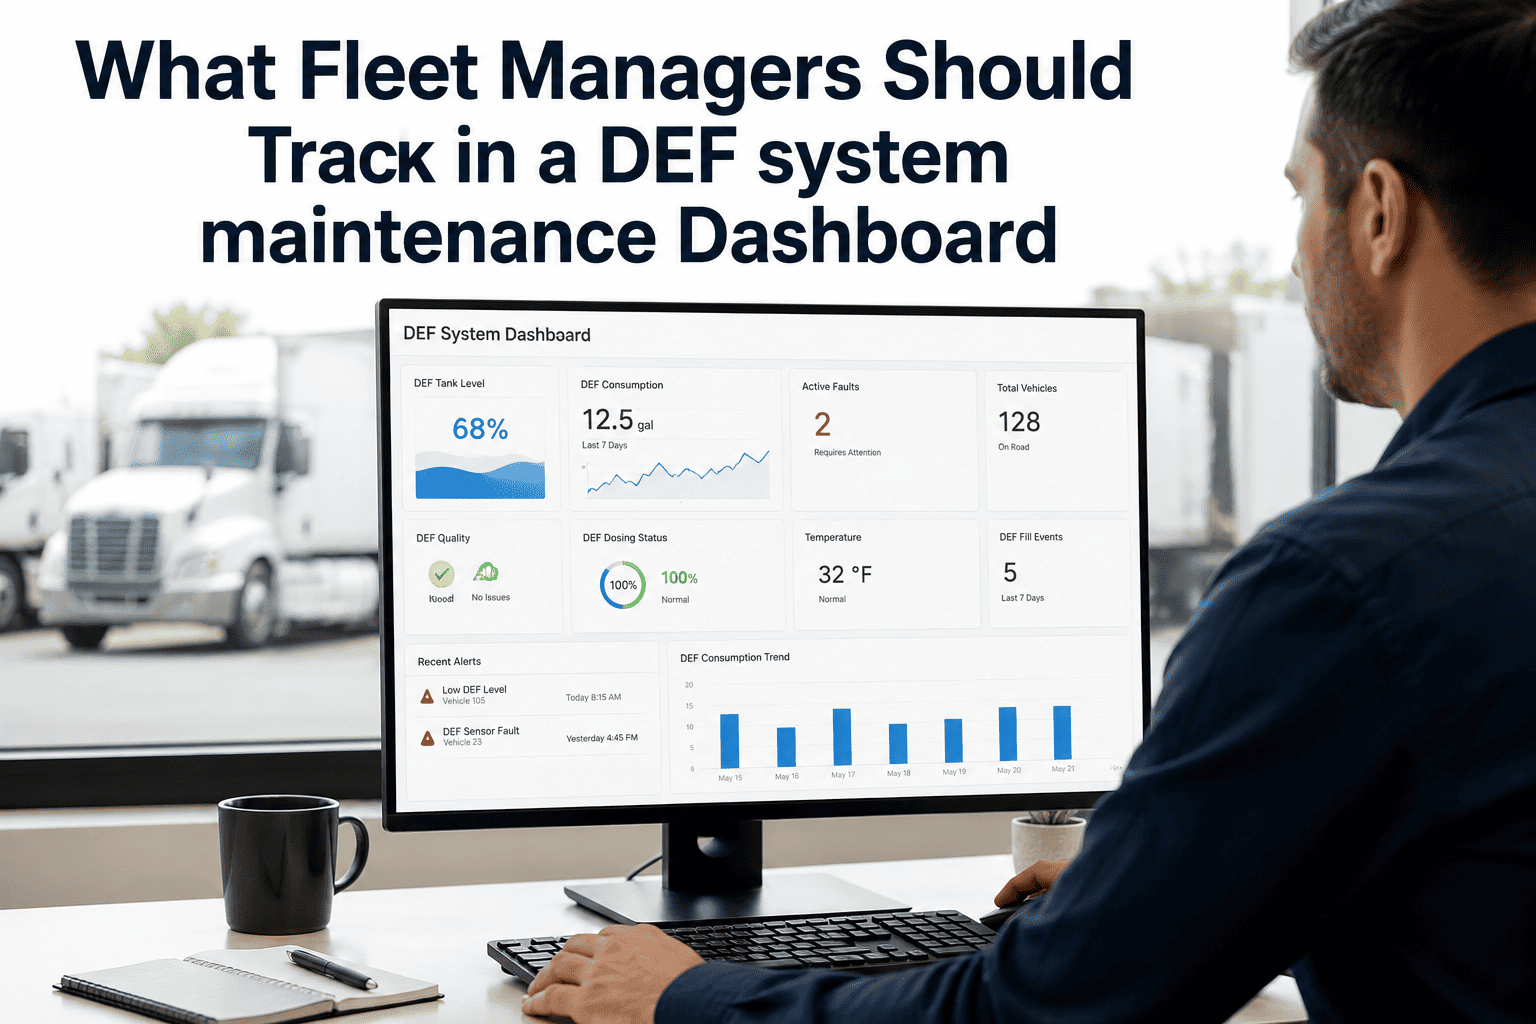
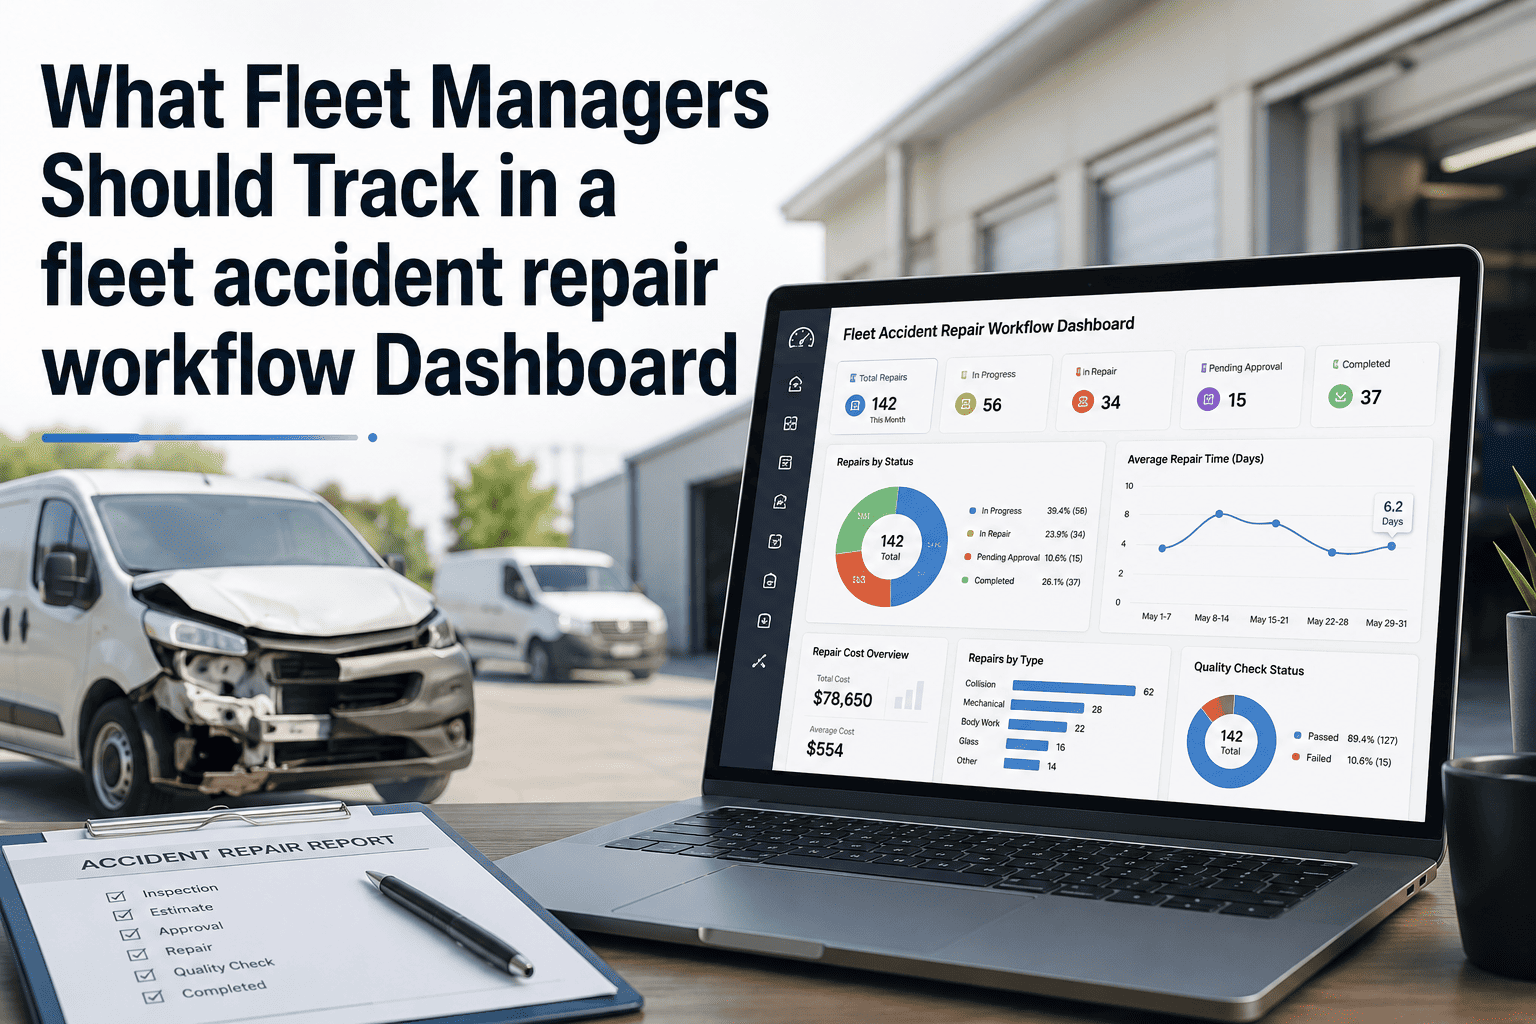
A construction fleet maintenance dashboard is only as useful as the metrics it tracks. Most fleet managers start with basic data — open work orders, upcoming PMs — but the difference between a functional dashboard and a decision-making tool lies in the depth and structure of what you measure. The right dashboard doesn't just tell you what happened; it tells you where your next breakdown is likely to come from, which site is burning through maintenance budget, and whether your technician team is keeping pace with the workload. Without that level of insight, fleet managers are reacting to problems rather than preventing them. OxMaint's AI Predictive Maintenance dashboard gives construction fleet managers the real-time visibility to stay ahead of equipment failures across every site in their network.
Fleet Management · Heavy Equipment Dashboard
What Fleet Managers Should Track in a Construction Fleet Maintenance Dashboard
The metrics, KPIs, and leading indicators that transform a basic dashboard into an early-warning system for your construction fleet.
Why Most Fleet Dashboards Fall Short
The problem isn't a lack of data — it is a lack of the right data, structured to drive decisions. A dashboard that shows "45 open work orders" is informational. A dashboard that shows "12 of those are on critical assets, 4 have been open more than 3 days, and 2 are blocking production at Site B" is operational. Fleet managers need the second kind.
What Most Dashboards Show
Total open work orders (count only)
Upcoming PMs (date-based)
Asset count by status
Total maintenance spend (monthly)
Breakdown count by month
What Decision-Ready Dashboards Show
Work orders by priority, age, and blocking status
PMs by compliance rate, overdue count, and site
Asset availability rate with downtime cause breakdown
Cost per machine hour by asset and by site
MTBF trend with AI failure probability flags
The 7 Dashboard Metric Categories Every Fleet Manager Needs
A complete construction fleet maintenance dashboard is built across seven functional areas. Each serves a different decision — from daily operations to strategic asset lifecycle planning. Here is what to track in each category and why it matters.
01
Asset Availability and Downtime
Asset availability is the percentage of scheduled operating hours during which a machine is available for work. It is the primary output metric of maintenance — if availability is high, maintenance is working. Track it by asset, by equipment type, and by site so you can see where availability problems are concentrated.
Track: Fleet-wide availability rate, availability by site, top 10 assets by downtime hours
Benchmark: 88–92% for construction equipment fleet average
Action trigger: Any critical asset below 80% availability in a rolling 30-day window
Preventive maintenance compliance is the percentage of scheduled PMs completed on time. Low compliance is the leading predictor of increased reactive maintenance, because deferred PMs accumulate into equipment degradation that eventually produces unplanned breakdowns. Track compliance at the site level to identify where PMs are being skipped or delayed.
Track: PM compliance by site, by equipment type, by technician team
Benchmark: 85% or higher fleet-wide; no site below 75%
Action trigger: Any site or equipment category showing declining compliance over 3 consecutive months
03
Planned vs. Reactive Work Ratio
This ratio tells you how much of your team's time is spent preventing failures versus responding to them. A fleet with 70% planned work and 30% reactive work is in a healthy maintenance posture. A fleet running 60% reactive is in a break-fix spiral — each breakdown defers more PMs, which generates more breakdowns.
Track: Work order type split (planned PM, planned repair, reactive breakdown, inspection-triggered)
Benchmark: Reactive work below 30% of total work orders
Action trigger: Reactive rate increasing for two consecutive months at any site
Cost per machine hour (total maintenance labour and parts cost divided by operating hours) is the only meaningful cost metric for fleet management. Total maintenance spend is misleading because it grows with fleet size. Cost per hour normalises for utilisation and reveals true efficiency — and when tracked by site, it identifies where maintenance practices are driving excess cost.
Track: Cost per hour by asset, by equipment class, by site, and trend over rolling 6 months
Benchmark: Establish fleet baseline in first 12 months; flag assets more than 40% above class average
Action trigger: Assets approaching 70–80% of replacement cost threshold on cumulative maintenance spend
05
Mean Time Between Failures (MTBF)
MTBF measures the average operating time between unplanned breakdowns for an asset or asset class. An improving MTBF trend means your maintenance program is working — machines are running longer between failures. A declining MTBF trend is an early signal that something in the maintenance regime is wrong, often well before cost or availability metrics show the problem.
Track: MTBF by equipment model, trending over rolling 90-day windows
Benchmark: MTBF should improve or hold stable in a well-maintained fleet
Action trigger: Any equipment class showing MTBF decline greater than 15% over 90 days
06
Work Order Backlog and Age
A work order backlog is healthy — it means work is being captured. An aging backlog is a problem. When work orders sit open for 7, 14, or 30+ days, it signals either resource constraints or prioritisation failures. Tracking average WO age by priority class tells you whether critical work is being handled promptly while lower-priority items age predictably.
Track: Open WO count by age bucket (0–3 days, 4–7 days, 8+ days), segmented by priority
Benchmark: Priority-1 WOs closed within 24 hours; priority-2 within 72 hours
Action trigger: Any priority-1 WO open more than 48 hours without documented reason
07
AI Failure Probability Alerts
Predictive maintenance alerts from AI analysis of telematics data, service history, and inspection findings should surface directly on the dashboard. These are not historical metrics — they are forward-looking signals. An asset flagged with high failure probability in the next 14 days gives the fleet manager an actionable window to schedule proactive intervention before the machine goes down at a critical time.
Track: Assets flagged by AI with high/medium failure probability, with recommended action and urgency window
Benchmark: All high-probability alerts actioned within 48 hours of flagging
Action trigger: Any high-probability alert on a revenue-critical or safety-critical asset
OxMaint's AI Predictive Maintenance dashboard surfaces all seven of these metric categories in a single real-time view — across every site in your fleet. Start a free trial or book a demo to see the fleet manager dashboard live.
Dashboard Layout: What to Put Where
A well-designed fleet maintenance dashboard is structured around decision urgency — what needs attention today versus what informs longer-term strategy. Here is a recommended layout for a construction fleet operations dashboard.
Right Now
Today's Operational View
Active breakdowns and their resolution status
PMs scheduled for today — complete vs. pending
New AI failure probability alerts (high priority)
Priority-1 work orders open more than 24 hours
This Week
7-Day Planning View
PM compliance rate for current week
Work order backlog trend (growing or shrinking)
Assets at risk — medium AI alert probability
Technician workload by site
This Month
Performance and Cost View
Fleet availability rate vs. target
Cost per machine hour by site and equipment class
Planned vs. reactive work order ratio
Top 5 breakdown causes by frequency and cost
Frequently Asked Questions
What is the most important single metric for a construction fleet maintenance dashboard?
Asset availability rate is the most important output metric because it directly reflects whether maintenance is doing its job. However, PM compliance rate is the most important leading indicator — it predicts future availability before problems occur. Tracking both gives fleet managers a complete picture of current performance and future risk.
See how OxMaint tracks both metrics in real time.
How often should a fleet manager review the maintenance dashboard?
The operational view (breakdowns, today's PMs, AI alerts) should be reviewed at the start and middle of every working day. The weekly performance view should anchor a brief team review meeting. Monthly strategic metrics — cost per hour, MTBF trends, site comparisons — feed a monthly fleet review with site supervisors and management.
Can OxMaint's dashboard be customised for different roles — site supervisor vs. fleet manager?
Yes. OxMaint supports role-based dashboard views. A site supervisor sees their site's data by default — their PMs, their WOs, their assets. A fleet manager sees cross-site aggregated metrics with drill-down capability to any individual site or asset. This ensures each user sees the information relevant to their decisions without information overload.
Book a demo to see role-based dashboards.
What data sources feed a construction fleet maintenance dashboard?
A complete dashboard pulls from CMMS work order data, equipment telematics (engine hours, fault codes, utilization), parts inventory levels, inspection records, and labour time tracking. OxMaint integrates all of these into a unified dashboard, eliminating the need to pull data from multiple systems to get a complete fleet picture.
AI Predictive Maintenance · OxMaint
Get the Dashboard That Drives Fleet Decisions — Not Just Reports
OxMaint's construction fleet dashboard tracks availability, PM compliance, cost per hour, MTBF trends, work order backlogs, and AI failure probability alerts — all in one real-time view across every site in your operation.