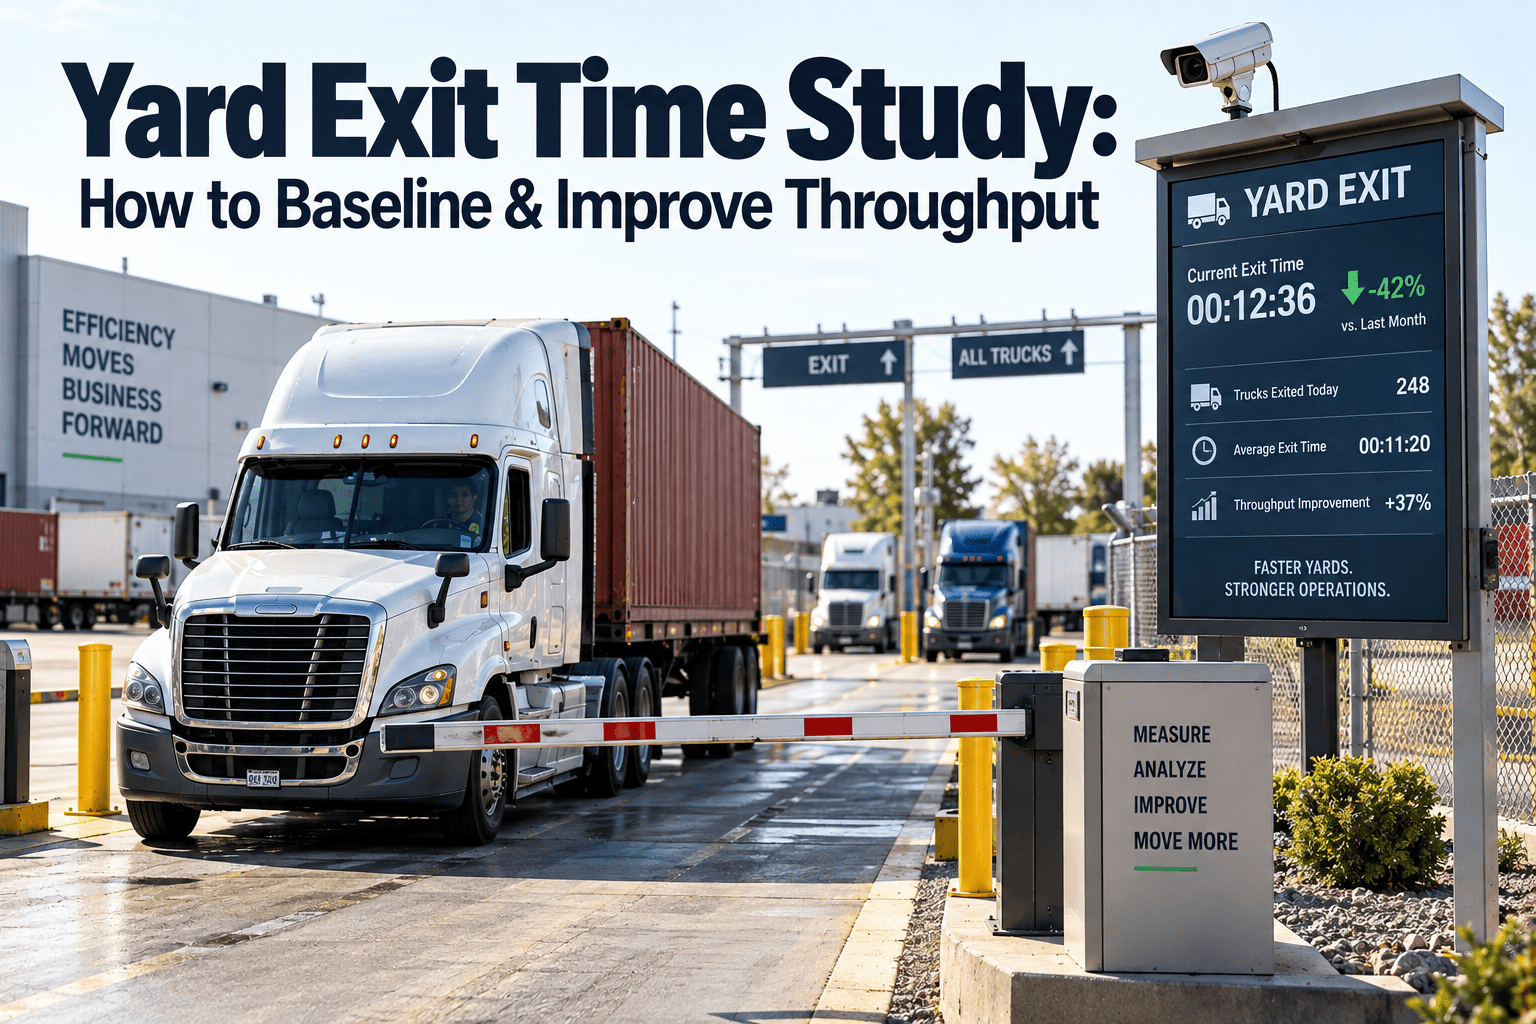
Before a fleet spends a dollar on automation, camera lanes, or new gate software, the highest-return move is almost always the cheapest one: measure where trucks actually wait. A structured yard exit time study — timestamping every truck at every checkpoint for a representative sample window — routinely reveals that the two checkpoints everyone assumes are the bottleneck aren't, and that fixing the real two adds throughput without a single capital purchase. This guide walks through the exact method for baselining a yard, reading the results, and using OxMaint to turn a one-time study into an ongoing throughput metric instead of a spreadsheet nobody updates again.
Measure before you automate: the yard exit time study method
A disciplined, low-cost time study reveals the two changes that lift yard throughput the most — before you spend on cameras, kiosks, or gate software you may not need yet.
The gate gets blamed for delays it didn't cause
Ask a dispatcher why a truck left late and the answer is almost always "the gate was backed up." It's the last thing anyone sees before departure, so it absorbs blame for delays that actually started thirty yards away and an hour earlier. Fleets that map every checkpoint a truck clears before reaching the exit typically find the gate itself is responsible for only a small share of total dwell time — the rest is buried in staging congestion, paperwork handoffs, and inspection queues nobody has ever timed.
That gap between where delay is assumed to live and where it actually lives is exactly what a time study closes. Skipping straight to automation without it means paying to speed up a checkpoint that was never the real constraint, while the true bottleneck keeps stacking trucks and pushing drivers toward their hours-of-service limit.
This isn't an argument against automation — gate kiosks, camera-based inspection lanes, and auto-dispatch systems all deliver real throughput gains when they're aimed at the right checkpoint. The problem is sequencing. A fleet that automates the gate before measuring where trucks actually wait is optimizing the most visible five percent of the problem while the other ninety-five percent sits untouched in staging and paperwork queues that were never part of the investment case in the first place.
Define the checkpoints before you start the stopwatch
A time study is only as useful as the checkpoints it measures. Most yards have more distinct stages than anyone tracks day to day — a truck doesn't stall once between arrival and departure, it stalls in stages, and each stage has its own owner and its own cause.
Treating "yard delay" as a single gate-in-to-gate-out number hides which of these six stages is actually eating the clock. The study only works if each checkpoint gets its own timestamp, captured the same way for every truck in the sample.
Not every yard runs all six stages in the same order, and that's fine — the point isn't to force a template onto an operation that doesn't fit it, it's to name every distinct handoff a truck passes through, however many there are. A cross-dock yard might collapse staging and dock assignment into one stage; a yard running both inbound and outbound trailers on the same lot might need to split staging into two separate checkpoints. The list above is a starting template, not a rulebook — the only non-negotiable part is that every stage gets tracked individually before the study begins.
Size the sample so the numbers actually mean something
A study run on one slow Tuesday afternoon will tell you about that Tuesday afternoon, not about your yard. To get a baseline that holds up, the sample needs to cover enough volume and enough variation to average out one-off noise like a late trailer, a missing driver, or a single congested hour.
| Sample dimension | Minimum recommended coverage | Why it matters |
|---|---|---|
| Trucks observed | 60–100 per checkpoint | Enough to smooth outliers without needing weeks of data collection |
| Days covered | 2 full weeks | Captures both peak and off-peak days, not just the worst or best day |
| Shifts covered | Every active shift | Morning surge and evening wind-down often bottleneck at different checkpoints |
| Truck types | All major classes running through the yard | A tanker and a dry van rarely bottleneck at the same stage |
Capture timestamps the same way, every time
Inconsistent capture is what turns a promising time study into unusable data. The method matters less than the consistency — a handheld clipboard with a synced watch works fine if every observer uses the identical trigger point for "arrived" and "departed" at each checkpoint.
Pick one trigger event per checkpoint
"Front bumper crosses the gate line" beats "truck arrives at the gate" — vague triggers produce inconsistent timestamps between observers.
Log entry and exit for every stage
Record when a truck enters staging and when it leaves staging — the gap between the two is the number that matters, not either timestamp alone.
Tag the reason for any outlier on the spot
A truck stuck 40 minutes because of a missing signature is a different data point than one stuck 40 minutes because every door was occupied — note it while it's fresh.
Use the same observer per checkpoint across the study window
Swapping observers mid-study introduces judgment drift on where a "stage" actually starts and ends.
Read the distribution, not just the average
A checkpoint averaging 12 minutes sounds fine until the data shows a 6-minute median with a handful of trucks sitting for over an hour. The average conceals exactly the kind of long-tail congestion that erodes a driver's hours-of-service window and cascades into every truck behind it. Baselining means looking at the full spread per checkpoint, not a single blended number.
Turn a one-time study into a live throughput metric
See how OxMaint logs checkpoint timestamps automatically from work orders and inspections, so the baseline you build once keeps updating itself.
Rank checkpoints by fixable minutes, not total minutes
The checkpoint with the highest raw dwell time isn't automatically the one to fix first. A dock assignment stage that takes 25 minutes because doors are genuinely at capacity needs a capacity decision, not a process fix. A staging stage that takes 20 minutes because paperwork sits in an inbox nobody checks until the top of the hour is pure fixable waste. Ranking by how much of the delay is actually addressable — versus structurally fixed by capacity or contract terms — is what separates a study that produces action from one that produces a report nobody acts on.
| Checkpoint | Typical root cause | Fixable without capex? |
|---|---|---|
| Gate-in / check-in | Manual log entry, driver credential lookup | Yes — digital check-in |
| Yard staging | No visibility into which trailer is where | Yes — position tracking |
| Dock / door assignment | Doors genuinely at capacity during peak | Partially — scheduling helps, capacity may not |
| Load / unload | Labor availability, equipment readiness | Partially — process dependent |
| Inspection / paperwork | Batch processing instead of real-time sign-off | Yes — digital workflow |
| Gate-out / exit | Final document check, seal verification | Yes — pre-staged paperwork |
What most fleets find once they actually measure
Across yards that run this method, a consistent pattern shows up: staging and paperwork handoffs — the two checkpoints nobody was watching — account for the majority of fixable delay, while the exit gate itself, the checkpoint everyone assumed was the problem, is usually responsible for only a small slice of total dwell time. That's not a coincidence. The gate is visible, staffed, and already has a process; staging and paperwork are the informal, undocumented steps that never got a process in the first place.
This is also why time studies routinely find that the highest-leverage fixes cost nothing to implement. Assigning a clear owner to the staging handoff, or moving paperwork sign-off from a batch process to a real-time digital step, doesn't require new equipment — it requires knowing that those two stages, not the gate, are where the minutes are actually going.
The "40% with zero capex" outcome that makes this method worth running isn't a fixed guarantee — every yard's mix of causes is different — but it reflects a consistent pattern: once staging visibility and paperwork batching are fixed, most of what's left really is structural capacity, and that's a legitimate signal to invest in expansion or automation with confidence instead of a guess. The time study doesn't replace the capital decision, it makes sure the capital goes toward the checkpoint that actually needs it.
Where time studies go wrong before they even start
A poorly designed study is worse than no study, because it produces a confident-sounding number that's actually noise. Four mistakes account for most of the bad baselines fleets end up acting on.
Sampling only the worst week
A study run during a known surge period — peak season, a service disruption — captures an outlier, not a baseline, and leads to overbuilding fixes for a condition that isn't typical.
Letting checkpoint definitions drift
If one observer counts "staging" as starting at the gate and another counts it starting at the first parking spot, the two data sets aren't comparable and the averages mean nothing.
Averaging away the outliers instead of investigating them
The trucks that sat for two hours are usually the most informative data points in the whole study — dropping them to clean up the average throws away the answer.
Never re-running the study after the fix
A baseline without a follow-up measurement is a guess about whether the fix worked, not a confirmation — the whole value of measuring twice is knowing for certain.
Making the baseline permanent instead of a one-time snapshot
A clipboard time study is the right way to start, but it decays the moment the study window ends — nobody keeps hand-timing trucks every week. OxMaint turns the same checkpoint structure into a standing metric by logging timestamps automatically as vehicles move through digital work orders and inspection steps, so the six-checkpoint map built during the study becomes the permanent lens the yard is measured through, not a one-time exercise that gets revisited only when something goes wrong again.
Checkpoint timestamps without a stopwatch
Digital check-in, inspection, and dispatch steps generate their own timestamps automatically, replacing manual data collection with a permanent record.
Dwell time trends by checkpoint
Dashboards break dwell time down by stage instead of one blended gate-to-gate number, so the two real bottlenecks stay visible as conditions change.
Outlier flagging in real time
A truck sitting well past a checkpoint's normal range triggers an alert to the right owner instead of surfacing three weeks later in a spreadsheet.
A baseline that updates itself
Because the data collects continuously, re-running "the study" after a fix is as simple as pulling a new date range, not scheduling another observer rotation.
Frequently asked questions
How long should a yard exit time study run?
Two full weeks covering every active shift is generally enough to smooth out one-off noise while still capturing both peak and off-peak patterns.
Do I need cameras or sensors to run this, or can it be done manually?
A manual, clipboard-based study with synced timestamps works fine for an initial baseline — automation matters more for making the measurement permanent afterward.
What's the single biggest mistake fleets make when baselining a yard?
Measuring only the gate-to-gate total instead of every checkpoint in between, which hides which specific stage is actually causing the delay.
How does OxMaint fit into a yard throughput improvement program?
It replaces manual checkpoint timing with automatic timestamps from digital check-in, inspection, and work order steps, keeping the baseline current. You can Start Free Trial to see it on your own data.
Which checkpoint should I expect to fix first?
There's no universal answer — that's exactly what the study is for — but staging visibility and paperwork handoffs are the most common highest-leverage, lowest-cost fixes across yards.
One follow-up question worth answering before wrapping up the study: should you re-measure after making changes? Yes — a short second pass using the identical checkpoint definitions is the only way to confirm a fix actually moved the number, rather than assuming it did because things feel faster. Re-running the study is quick precisely because the checkpoint map and observer method are already built; it's a data pull, not a redesign.
Stop guessing which checkpoint is slowing your yard down
Book a walkthrough and see how OxMaint turns checkpoint-level dwell time into a live dashboard instead of a spreadsheet from last quarter's study.
Free 14-day trial · No credit card required