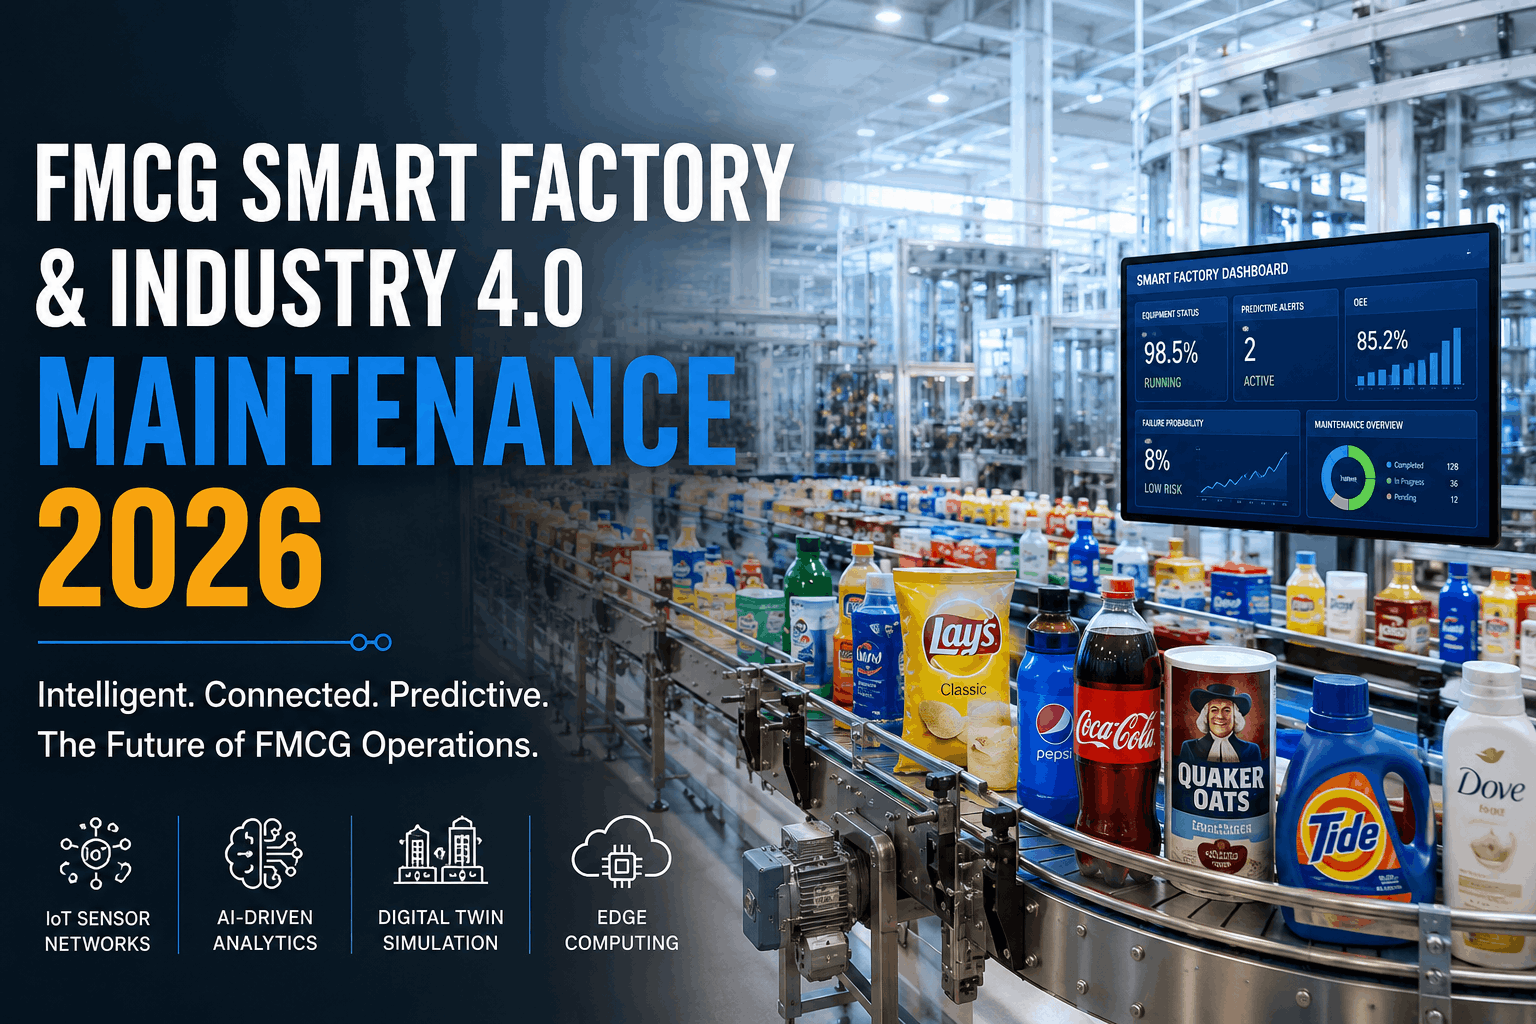
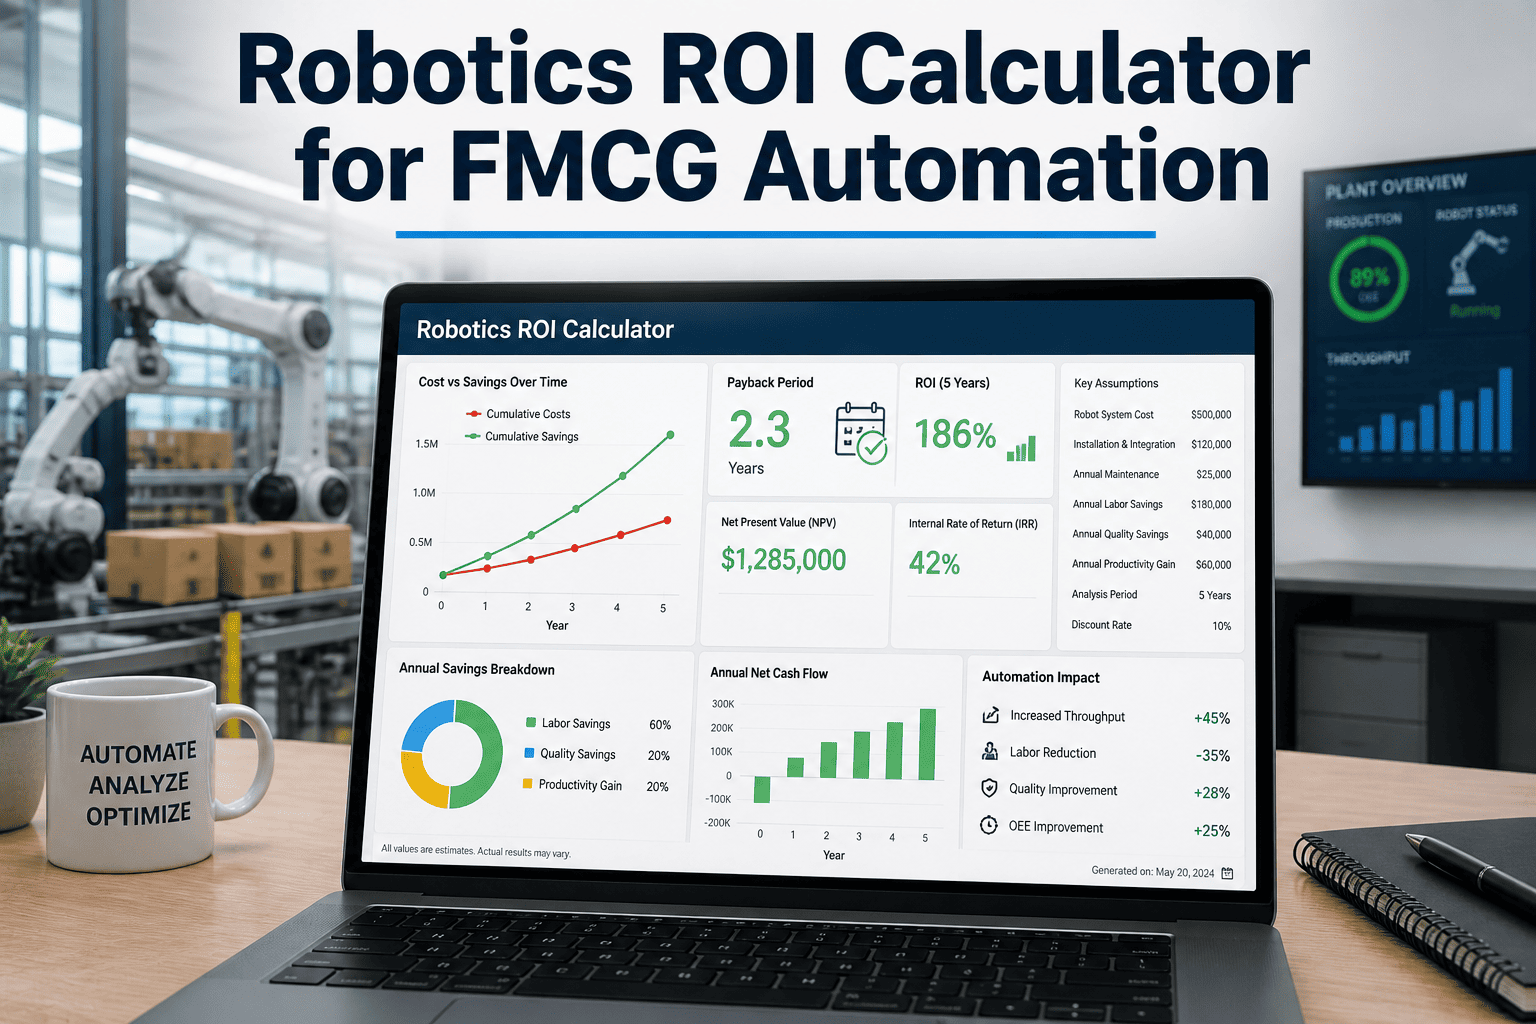
Most FMCG plant managers believe their facility is more digitally mature than it actually is. In a 2024 survey of 340 mid-size FMCG manufacturers, 68% rated their plants as "above average" on Industry 4.0 readiness — yet only 22% could demonstrate real-time OEE visibility across all production lines, and fewer than 15% had any predictive maintenance capability on their highest-cost assets. The gap between perceived and actual maturity is the single biggest barrier to meaningful digital investment: plants that don't know where they are can't chart a credible path to where they need to be. This assessment defines five dimensions of Industry 4.0 and robotics maturity, benchmarks each against FMCG industry data, and gives your team a structured framework to identify capability gaps and prioritise the investments that deliver the fastest return. Oxmaint supports plants at every maturity level — from basic digital work orders to full predictive analytics and robotic system integration. Book a 30-minute demo to see where your plant stands and what the next level looks like in practice.
What Plants Believe
OEE Visibility
82% claim real-time OEE tracking
Predictive Maintenance
61% say they use predictive tools
Robotic Integration
54% report robots are fully integrated
Data-Driven Decisions
74% say decisions are data-driven
What Audits Find
OEE Visibility
22% have live OEE across all lines
Predictive Maintenance
15% have true predictive capability
Robotic Integration
19% have bi-directional data integration
Data-Driven Decisions
28% use structured data for planning
Maturity Gap Cost: Plants Overestimating Readiness Miss 3–5 Years of Competitive Advantage
The Five Dimensions of FMCG Industry 4.0 Maturity
Industry 4.0 maturity in FMCG manufacturing is not a single measure — it spans five distinct capability dimensions, each of which can be at a different maturity level within the same facility. A plant can have advanced robotic automation but primitive data connectivity, or sophisticated analytics capability built on incomplete sensor infrastructure. Understanding all five dimensions independently is essential for accurate self-assessment and targeted investment planning.
Dimension 1
Connectivity
Asset-to-system data flow — how completely your equipment communicates with your digital infrastructure in real time
Dimension 2
AI & Analytics
Depth of analytical capability — from basic reporting through predictive modelling and autonomous decision support
Dimension 3
Robotic Automation
Breadth and sophistication of robotic deployment — from isolated task automation to fully collaborative, adaptive robotic systems
Dimension 4
System Integration
How tightly your operational systems — CMMS, ERP, MES, SCADA — share data and coordinate actions across the facility
Dimension 5
People & Culture
Organisational readiness — team digital literacy, change management capability, and leadership commitment to Industry 4.0 investment
Dimension 1: Connectivity — Four Maturity Levels
Connectivity is the foundation of every other Industry 4.0 capability. Without reliable, real-time data flow from physical assets to digital systems, analytics have nothing to analyse, predictive models have nothing to predict from, and integration systems have nothing to integrate. Connectivity maturity in FMCG manufacturing spans four levels — from manual paper-based data collection at Level 1 to autonomous, self-configuring asset networks at Level 4.
Level 1
Manual / Disconnected
31% of FMCG plants
Paper-based shift logs, manual meter readings, no real-time asset data. Production data entered into spreadsheets post-shift. Failure data captured only after breakdown events.
Signals: No CMMS or spreadsheet-based maintenance tracking
Level 2
Partial / Siloed
38% of FMCG plants
Some assets connected via PLC or SCADA, but data lives in isolated systems not accessible plant-wide. Manual data transfers between systems. OEE calculated retrospectively from partial data.
Signals: CMMS exists but is not connected to production systems
Level 3
Connected / Integrated
24% of FMCG plants
Real-time data from most assets flowing into integrated systems. Live OEE dashboards. Automated alerts on threshold breaches. IoT sensors on critical equipment. CMMS integrated with production data.
Signals: Live OEE visibility, automated work order creation on alarms
Level 4
Autonomous / Intelligent
7% of FMCG plants
Full asset network with edge computing, digital twin synchronisation, and autonomous data routing. Self-healing connectivity. Predictive anomaly detection running continuously across all assets.
Signals: Digital twins active, edge AI on production floor
Dimension 2: AI & Analytics — Four Maturity Levels
Analytics maturity determines how effectively a plant converts data into decisions. At the lowest level, data is collected but never analysed. At the highest level, AI systems make autonomous maintenance and production decisions without human intervention. Most FMCG plants are stuck between Levels 1 and 2 — collecting data but using it only for retrospective reporting, not forward-looking prediction.
Level 1 — Descriptive
Reports tell you what happened. Shift summaries, downtime logs, monthly OEE reports. No real-time visibility.
34%
Level 2 — Diagnostic
Analysis tells you why it happened. Root cause tracking, Pareto analysis of failure modes, trend reporting.
41%
Level 3 — Predictive
Models tell you what will happen. Failure probability scoring, remaining useful life, condition-based alerts.
19%
Level 4 — Prescriptive
AI recommends and executes actions. Autonomous maintenance scheduling, self-optimising production parameters.
6%
The jump from Level 2 to Level 3 is the highest-ROI transition in analytics maturity. It requires structured data infrastructure and a CMMS platform capable of connecting asset condition data to maintenance scheduling — the foundation Oxmaint provides.
Dimension 3: Robotic Automation — Four Maturity Levels
Robotic maturity in FMCG goes far beyond "how many robots you have." A plant can have 40 robots all operating as isolated, unconnected task automators — that is Level 2, not Level 4. True robotic maturity is defined by how intelligently robots adapt to conditions, how completely they are maintained, and how deeply they are integrated with production intelligence systems.
Level 1
Task Automation
Isolated, fixed-program robots
Robots perform single, fixed tasks with no external data connectivity. No sensor feedback beyond basic safety stops. Maintenance is purely reactive — robots are serviced after breakdown, not before.
Signals: No vibration monitoring, no calibration schedules, calendar-only PM
Level 2
Monitored Automation
Connected but not integrated
Robots produce operational data (cycle counts, alarm logs) but data lives in robot controller, not in plant systems. Maintenance is calendar-based with some condition monitoring on critical components.
Signals: Robot data visible on pendant, not in CMMS or MES
Level 3
Integrated Automation
Connected and maintained predictively
Robot performance data integrated with CMMS and production systems. Predictive maintenance active on servo motors, gearboxes, and end-effectors. Work orders auto-generated from condition data.
Signals: CMMS receives robot alarm data, PM scheduled by condition
Level 4
Adaptive Automation
Self-optimising robotic systems
Robots adjust speed, path, and operating parameters autonomously based on real-time product, throughput, and condition data. Digital twins active for simulation and optimisation. Self-scheduling maintenance.
Signals: Digital twin active, robots adjust parameters without human input
Dimension 4: System Integration & Dimension 5: People & Culture
System integration and organisational culture are the two most underestimated dimensions of Industry 4.0 maturity — and the two most frequently responsible for programme failures. A plant can have Level 3 connectivity and Level 3 analytics, yet remain stuck at overall Level 2 maturity because its ERP, CMMS, and MES don't share data, or because its maintenance teams don't trust digital outputs enough to act on them.
System Integration
L1 Standalone systems, manual data re-entry between platforms
L2 Point-to-point integrations, some automated data sharing
L3 Unified data layer — CMMS, ERP, MES share real-time data
L4 Autonomous cross-system orchestration, AI coordinates all platforms
People & Culture
L1 Digital tools viewed as overhead; paper preferred by maintenance teams
L2 Digital adoption patchy; some teams use tools, others resist
L3 Digital-first culture; data used in daily decisions at all levels
L4 Continuous improvement embedded; teams proactively drive digital capability
Industry Benchmark
L1 System Integration: 28% of plants | Culture: 35% of plants
L2 System Integration: 44% of plants | Culture: 42% of plants
L3 System Integration: 22% of plants | Culture: 18% of plants
L4 System Integration: 6% of plants | Culture: 5% of plants
Your Overall Maturity Score: How to Calculate It
Your overall Industry 4.0 maturity score is the weighted average of your five dimension scores. Connectivity and AI & Analytics carry the highest weight because they are the enabling infrastructure for every other capability — a plant cannot have mature robotics or integration without first solving connectivity and data quality. Use the weights below to calculate your composite score and identify which dimensions are pulling your overall maturity down.
Connectivity
Weight: 25% — Foundation for all other capabilities. No connectivity = no analytics, no integration, no intelligence.
25%
AI & Analytics
Weight: 25% — Converts data into decisions. The primary driver of maintenance cost reduction and OEE improvement.
25%
Robotic Automation
Weight: 20% — Throughput and quality driver. Maturity is measured by intelligence and integration, not robot count.
20%
System Integration
Weight: 20% — Determines whether platform investments compound or stay siloed. Critical for full-facility ROI.
20%
People & Culture
Weight: 10% — Adoption multiplier. The best technology delivers zero ROI if teams don't use it.
10%
Composite Score Range
1.0 → 4.0
Score 1.0–1.7: Foundational stage — prioritise connectivity and CMMS deployment. Score 1.8–2.5: Developing stage — close data gaps, begin predictive analytics pilots. Score 2.6–3.3: Advanced stage — integrate systems, expand predictive coverage. Score 3.4–4.0: Leading stage — focus on autonomous optimisation and full-facility digital twin.
The Advancement Roadmap: Moving Up Each Level
For each of the four overall maturity bands, there is a defined set of investments, capability builds, and technology deployments that move a plant to the next level. The roadmap below shows what plants in each band should focus on — and the typical timeline and ROI associated with each advancement step.
1→2
Foundational to Developing
Deploy mobile CMMS with digital work orders and asset registry
Add IoT sensors to 3–5 highest-cost assets (vibration + current)
Establish daily shift data capture with structured downtime coding
Build OEE dashboard from PLC and manual entry data
Timeline: 3–6 months | ROI: 4–7x
2→3
Developing to Advanced
Expand IoT coverage to all critical assets — connect to CMMS
Activate predictive maintenance on top-10 failure-prone assets
Integrate CMMS with ERP for parts, costs, and purchase orders
Begin robotic condition monitoring with automated PM scheduling
Timeline: 6–12 months | ROI: 6–10x
3→4
Advanced to Leading
Deploy digital twins on primary filling lines and robotic cells
Full MES–CMMS–ERP data unification across all production lines
Activate prescriptive analytics and autonomous PM scheduling
Robotic self-optimisation with AI-driven path and parameter tuning
Timeline: 12–24 months | ROI: 8–14x
4.0
Leading — Sustaining Edge
Continuous model refinement as wear data accumulates across all assets
CapEx scenario modelling using full-facility digital twin
Supply chain integration — connect plant condition data to procurement
External benchmarking against Industry 4.0 leaders quarterly
Focus: Continuous optimisation | ROI: Compounding
The Six Most Common Maturity Advancement Blockers
The same six obstacles appear at every FMCG plant attempting to advance its Industry 4.0 maturity. None of them are insurmountable, and each has a proven resolution path. Identifying which blocker is most relevant to your facility is the first step to moving past it.
No Budget for Digital Investment
Resolved
Start with one critical asset. A single avoided emergency repair on a filling machine typically returns 8–15x the cost of a pilot CMMS + sensor deployment
Team Skills Gap
Resolved
Modern CMMS platforms require no IT or data science expertise. Technicians are productive within 2–3 days on mobile-first platforms designed for plant floor use
Legacy Equipment Can't Be Connected
Resolved
Wireless IoT sensors retrofit onto any asset regardless of age or manufacturer. No PLC connectivity required. Installation takes hours, not weeks
Data Quality Is Too Poor to Use
Resolved
Poor data quality is a symptom of Level 1 maturity — not a precondition for staying there. Structured data capture tools improve data quality as a by-product of adoption within 4–8 weeks
Systems Won't Integrate
Resolved
API-first CMMS platforms integrate with SAP, Oracle, Infor, and most ERP systems via pre-built connectors. Integration projects that once took 6 months now take 2–4 weeks
Teams Won't Change How They Work
Resolved
Adoption follows quick wins. Show technicians that digital PM schedules reduce emergency callouts within 30 days, and resistance transforms into advocacy faster than any change management programme
Frequently Asked Questions
How do we self-assess our Industry 4.0 maturity accurately?
The most reliable self-assessment combines three inputs: a structured questionnaire covering all five dimensions (with specific yes/no questions rather than subjective ratings), a data infrastructure audit (what data actually flows where, in real time), and a comparison against the level definitions in this framework. The key discipline is answering based on what your plant does for all assets, not what it does for one or two showcase lines. A plant where three lines have live OEE but two are paper-based is a Level 2, not a Level 3 — maturity is determined by the floor, not the ceiling of your capability.
Which maturity dimension should we prioritise first?
Almost always Connectivity, regardless of which other dimensions feel most urgent. You cannot build analytics capability without data, cannot integrate systems without a data layer to integrate, and cannot build digital culture around tools that don't work reliably. The single most common Industry 4.0 failure pattern is investing in analytics or ERP integration before connectivity is solid — resulting in expensive platforms that produce unreliable outputs because the underlying data is incomplete or stale. Solve connectivity first, then analytics, then integration. Robotic maturity and culture will advance naturally as the data infrastructure improves.
What is a realistic timeline to advance from Level 1 to Level 3 overall maturity?
For a mid-size FMCG plant (4–8 production lines, 100–400 employees) starting from Level 1, the realistic timeline to reach Level 3 across all five dimensions is 18–30 months with consistent investment and programme management. The fastest plants achieve it in 14–18 months by focusing exclusively on the highest-ROI sequence: mobile CMMS deployment (months 1–3), IoT sensor expansion (months 4–8), predictive analytics activation (months 9–14), and system integration (months 15–24). The slowest plants take 36–48 months because they attempt all dimensions simultaneously without a structured sequence, spreading resource and attention too thin to achieve meaningful progress in any single dimension.
How does robotic maturity affect overall Industry 4.0 score?
Robotic maturity carries a 20% weight in the composite score, but its indirect impact is larger than its direct weight suggests. Plants with Level 3–4 robotic maturity have, by definition, solved connectivity (their robots are integrated with CMMS and production systems), advanced analytics (they are running predictive maintenance on robotic components), and system integration (robot data is flowing into ERP and MES). Advancing robotic maturity therefore pulls up connectivity, analytics, and integration scores simultaneously — making it one of the highest-leverage dimensions for plants that have significant robotic assets on their production floor.
What does Oxmaint specifically provide for plants at each maturity level?
At Level 1, Oxmaint replaces paper-based maintenance with mobile digital work orders, asset registry, and structured downtime capture — typically moving plants to Level 2 within 60–90 days. At Level 2, Oxmaint adds IoT sensor integration, automated PM scheduling from condition data, and OEE dashboards connected to production systems. At Level 3, Oxmaint activates predictive analytics, digital twin integration, and automated work order generation from sensor and twin signals. At Level 4, Oxmaint provides the closed-loop validation infrastructure that continuously improves prediction accuracy as intervention data accumulates. Every transition is supported by Oxmaint's implementation team and pre-configured FMCG industry templates.
Industry 4.0 Readiness
Find Out Exactly Where Your Plant Stands — and What the Next Level Looks Like
Oxmaint's team works with FMCG plants at every maturity level — from deploying first digital work orders to activating full predictive analytics and robotic system integration. Book a 30-minute assessment call and get a scored maturity profile across all five dimensions, a prioritised gap analysis, and a 90-day advancement roadmap built for your specific facility.
✓ Scored across all 5 maturity dimensions
✓ Benchmarked against FMCG industry data
✓ Prioritised gap analysis included
✓ 90-day roadmap with ROI projections