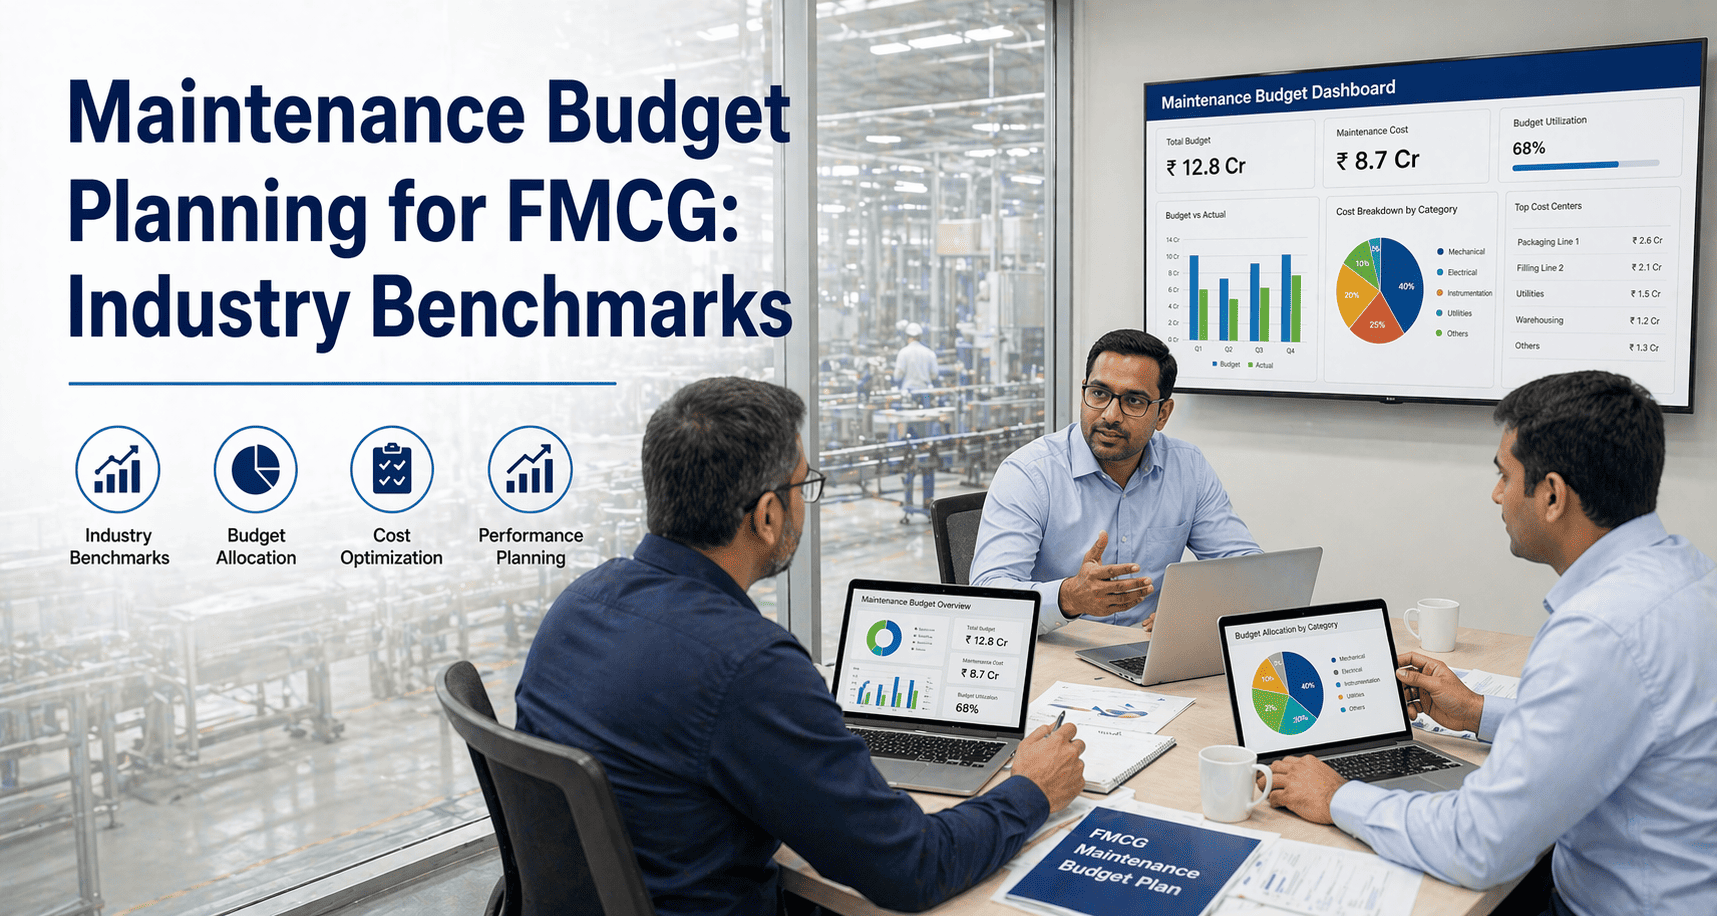
Maintenance Budget Planning for FMCG | Benchmarks Guide
By Jack Edwards on April 25, 2026
Most FMCG maintenance budgets are built the same way every year: take last year's spend, add 5%, argue with finance about why it should be more, and accept a figure that is ultimately disconnected from the actual asset base it is supposed to support. The problem is not that maintenance teams lack data — it is that the data they have is the wrong type. Reactive spend percentages, cost-per-hour figures, and labour utilisation rates are outputs, not planning instruments. World-class FMCG maintenance budgeting uses Replacement Asset Value as the baseline, segments spend by maintenance type, and validates every line against equipment age, criticality, and failure history — producing a budget that finance can defend and operations can execute against. If your maintenance budget still relies on last year plus inflation as its primary justification, start a free trial with Oxmaint and access the asset data that makes evidence-based budget planning possible, or book a demo to see how FMCG maintenance leaders are using CMMS data to make their budget case to the board.
Maintenance Budget — FMCG Benchmarks
FMCG Maintenance Budget Planning: Benchmarks, RAV Ratios, and the CMMS Advantage
Move from gut-feel budgeting to evidence-based maintenance financial planning. Oxmaint delivers the asset condition data, spend analytics, and benchmark comparisons that turn your maintenance budget from a cost argument into a capital investment case.
Range of maintenance spend as % of RAV — from world-class to reactive-heavy FMCG operations
4.8x
Higher cost of reactive repairs vs equivalent planned maintenance — the core driver of budget overruns
22%
Average maintenance cost reduction achieved within 18 months of implementing structured CMMS-based planning
38%
Of FMCG maintenance budgets are spent on reactive repairs — vs a world-class target of under 15%
The RAV Framework — How World-Class FMCG Plants Build Their Maintenance Budget
Replacement Asset Value is the current cost to replace all production assets at today's prices. It is the only rational baseline for maintenance budget planning — because it anchors your maintenance spend to the size of the asset base you are protecting, not to historical spend patterns.
1.5–3%
World-Class FMCG
Achieved through high PM compliance (85%+), low reactive work (under 15%), mature condition monitoring, and structured CapEx planning. These plants spend less because they prevent more.
3–5%
Industry Average
Typical for FMCG plants with mixed PM and reactive strategies, moderate CMMS adoption, and equipment ages ranging from 5–15 years. Significant improvement potential exists.
6–12%
Reactive / Aging Assets
Plants with significant deferred maintenance, aging critical equipment, high reactive work percentages, and poor spare parts management. Often combined with frequent production losses.
Your RAV
Calculate With Oxmaint
Oxmaint calculates your maintenance spend as a % of RAV automatically from your asset registry and work order cost data — positioning your plant against FMCG industry benchmarks in real time.
8 Key Metrics for Evidence-Based FMCG Maintenance Budget Planning
KPI 01
Maintenance Cost as % of RAV
Benchmark: 1.5–5% · World-class: <3%
Primary budget health indicator — anchors spend to the size and value of the asset base being maintained.
KPI 02
Reactive Maintenance %
Benchmark: <15% reactive · Average: 35–45%
Every percentage point above 15% reactive is a budget multiplier — reactive repairs cost 4.8x more than planned.
KPI 03
Maintenance Cost per Unit Produced
Tracks absolute efficiency — normalises cost to output volume
Allows fair year-on-year budget comparison regardless of production volume changes. Essential for multi-line FMCG plants.
KPI 04
PM Compliance Rate
Target: >85% · World-class: >92%
The leading indicator of future reactive spend — every missed PM creates a probability of an unplanned breakdown within the next planning cycle.
KPI 05
Labour vs Materials Ratio
Typical FMCG split: 45% labour / 55% materials
Shifts in this ratio signal changes in maintenance strategy — a rising materials % often indicates increasing reactive frequency or rising spare parts costs.
KPI 06
Maintenance Backlog (Weeks)
Healthy range: 2–4 weeks · Risk level: >6 weeks
A growing backlog signals under-resourcing. Quantifying the backlog in cost terms is the most effective argument for additional maintenance headcount in a budget review.
KPI 07
MRO Inventory Turn Rate
Target: 0.5–2x annually for FMCG maintenance stores
Low turns indicate excess inventory consuming working capital. High turns (above 3x) suggest stockout risk. CMMS data provides the usage history to optimise both ends.
KPI 08
5-Year CapEx Forecast
Built from asset age, condition score, and MTBF trend
The primary tool for avoiding CapEx surprises. Oxmaint builds rolling 5-year asset replacement forecasts from asset condition scoring and failure history — giving finance the visibility they need to plan capital allocation.
Why Most FMCG Maintenance Budgets Are Wrong From the Start
Problem 01
Last Year Plus Inflation
Budget built on prior spend, not on asset needs. If last year included three major emergency repairs, next year's budget includes the same hidden risk — and the same reactive spend multiplier.
Problem 02
No Asset Condition Baseline
Without a systematic condition assessment of the asset base, budget planning cannot account for aging equipment approaching end-of-life — until that equipment fails and the cost lands as an overrun.
Problem 03
Reactive Spend Masking the True Cost
Emergency repairs and expedited parts procurement often hit separate budget codes — operations, logistics, or procurement — masking the true maintenance cost and making the budget comparison dishonest.
Problem 04
No Forward CapEx Visibility
Finance teams receive CapEx requests in the year the asset fails, not 3–5 years in advance when the condition trend was visible. Oxmaint's CapEx forecasting module makes capital needs visible years before they become urgent.
Traditional Budget Planning vs Oxmaint-Supported Budget Planning
Budget Planning Activity
Traditional Approach
Oxmaint-Supported Approach
Baseline methodology
Prior year spend + inflation estimate
RAV % analysis + asset condition scoring
Reactive spend visibility
Hidden across multiple cost codes
Separated and tracked per asset, per event
PM cost forecasting
Estimated based on team experience
Calculated from scheduled PM frequency × historical cost
CapEx planning horizon
12 months (year-by-year requests)
Rolling 5–10 year forecast from asset age and condition
Budget variance analysis
Post-year reconciliation only
Live cost tracking per asset, per category, per month
Industry benchmarking
No comparison available
Automatic RAV % positioning vs FMCG peer benchmarks
Make Your Maintenance Budget Argument With Data, Not Gut Feel
Oxmaint gives FMCG maintenance leaders the cost analytics, asset condition data, and benchmark comparisons to build a maintenance budget that finance understands and approves — and to execute against it with live spend tracking throughout the year.
The Financial Impact of Better Maintenance Budget Planning
22%
Average maintenance cost reduction in 18 months when reactive spend drops from 38% to under 20%
3.2x
ROI on preventive maintenance investment vs equivalent reactive spend — the core budget efficiency argument
$280K
Average annual savings in emergency repair premiums per FMCG plant when PM compliance exceeds 85%
5 years
CapEx planning horizon unlocked by Oxmaint's asset condition scoring — vs typical 12-month horizon in most FMCG plants
Frequently Asked Questions
What is RAV and how do I calculate it for my FMCG plant?
Replacement Asset Value (RAV) is the estimated cost to replace all production assets in your plant at current market prices. It is calculated by summing the current replacement cost of every significant piece of equipment — filling machines, packaging lines, conveyors, utilities, refrigeration, CIP systems, and supporting infrastructure. For FMCG plants, RAV is typically built from equipment purchase records adjusted for inflation, or from insurer replacement valuations. Oxmaint stores replacement cost per asset in the asset registry, enabling automatic RAV calculation at the plant or portfolio level. Once RAV is established, maintenance spend as a percentage of RAV can be calculated automatically from Oxmaint's cost tracking data. Start your free trial to build your asset registry and calculate your RAV in Oxmaint.
How does Oxmaint help track maintenance costs against budget in real time?
Every work order in Oxmaint captures cost data — labour hours at configured rates, parts used at storeroom or purchase cost, and contractor costs. The maintenance cost dashboard aggregates this data by asset, by cost category (planned maintenance, reactive maintenance, capital works), by time period, and by production area. Maintenance managers see live spend vs budget by category throughout the year — not just at month-end reconciliation. Spend alerts can be configured to notify when a category approaches a budget threshold, enabling proactive management of cost overruns before they become variances that need explaining. Book a demo to see Oxmaint's maintenance cost dashboard.
How do I use Oxmaint to build a CapEx request for aging production equipment?
Oxmaint's CapEx forecasting module uses three data inputs per asset: age, condition score (updated each time a PM or inspection is completed), and MTBF trend (calculated automatically from work order history). From these three factors, the system generates a risk-weighted replacement timeline for each asset — identifying equipment that is likely to require capital replacement within each of the next five budget years. For individual CapEx requests, Oxmaint generates an asset performance summary showing maintenance cost history, downtime hours, MTBF trend, and current condition score — the evidence package that converts an equipment replacement request from a team opinion into a data-backed capital proposal.
What FMCG maintenance cost benchmarks should I compare my plant against?
The primary benchmark for FMCG is maintenance spend as a percentage of RAV. World-class FMCG plants achieve 1.5–3% RAV. Industry average is 3–5% RAV. Plants with high reactive maintenance rates, aging assets, or poor PM compliance typically run 6–12% RAV. Secondary benchmarks include reactive maintenance percentage (target: under 15%), PM compliance rate (target: above 85%), maintenance cost per unit produced (varies by product type), and MRO inventory turn rate (target: 0.5–2x annually). Oxmaint positions your plant against each of these benchmarks automatically from your CMMS data — no manual benchmark comparison required. Start your free trial and see where your plant sits against FMCG benchmarks today.
Maintenance Budget Planning — FMCG
Build a Maintenance Budget That Finance Approves and Operations Can Execute. Oxmaint Makes It Possible.
Asset condition data, RAV benchmarking, live cost tracking, and 5-year CapEx forecasting — all in one CMMS built for FMCG production environments. Stop building your maintenance budget on last year's spend. Start building it on your asset data.