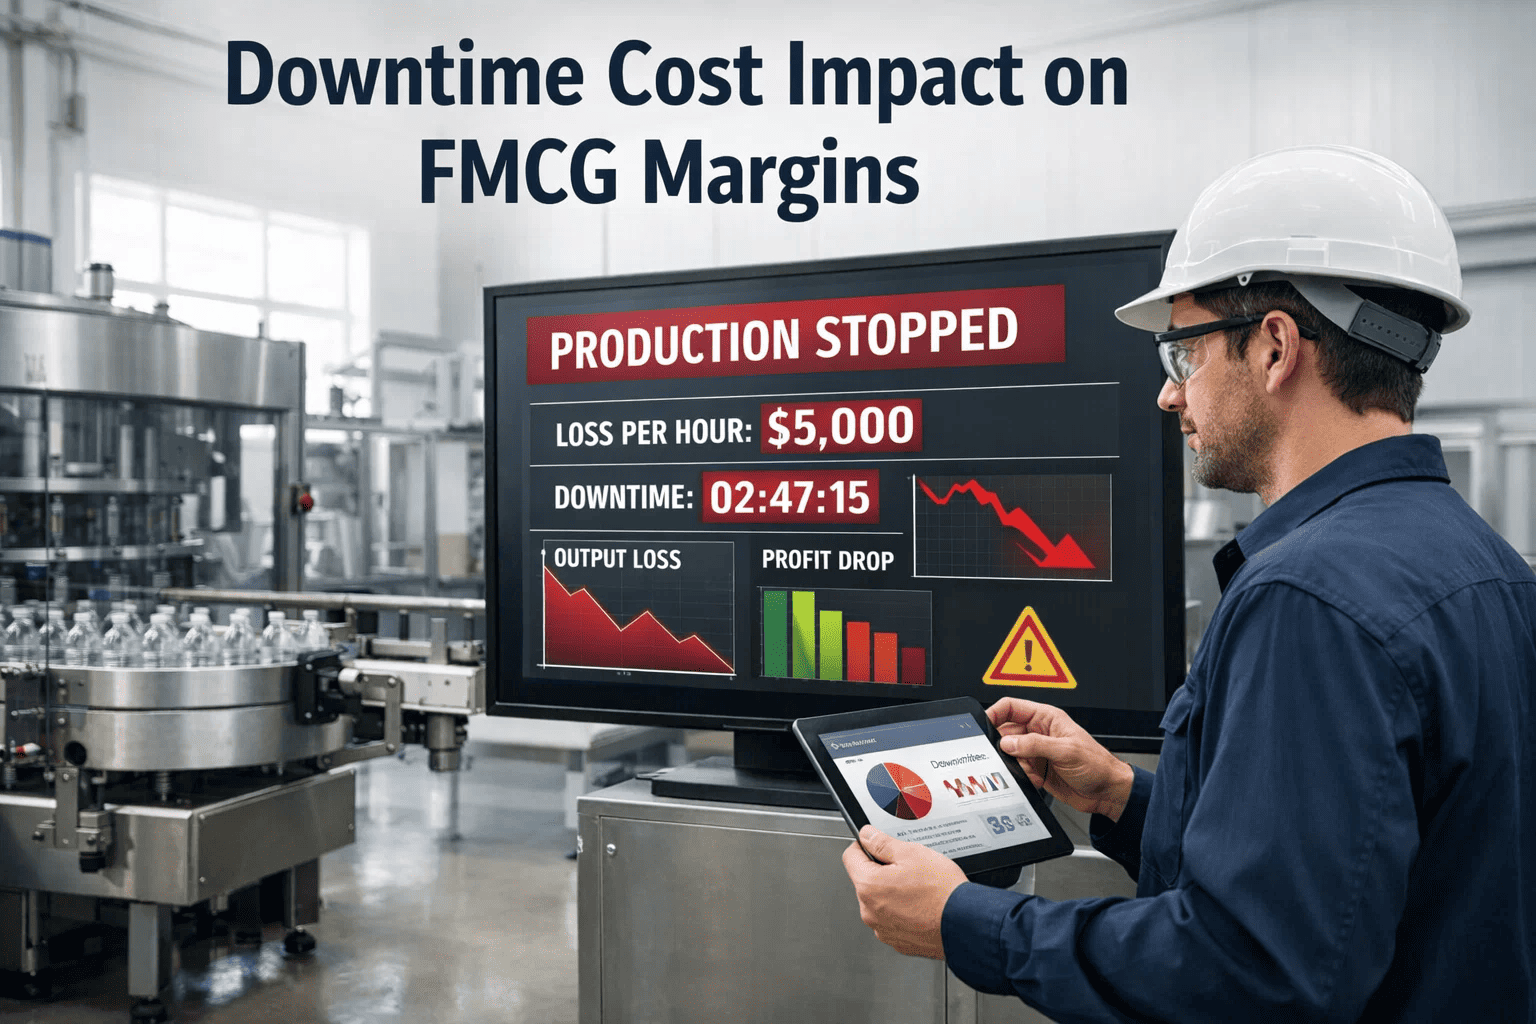
Downtime in FMCG manufacturing is not an operational inconvenience — it is a direct, immediate attack on margin. When a filling line stops for 45 minutes on a plant running at $4,000 to $6,000 of product per hour, the financial damage is instantaneous and irreversible. The shift cannot be rewound. The production window is gone. On a line with a 15% unplanned downtime rate — not unusual for plants without structured preventive maintenance — the cumulative financial impact per year per line frequently exceeds $1 million when all second and third-order costs are correctly accounted for: lost production, reactive repair premiums, wasted materials, spoiled product, schedule disruption, and the overtime cost of attempting to recover output. The industry norm is to track downtime in hours — but the plants turning it into a competitive advantage track it in dollars, per incident, in real time. Start a free trial and begin tracking the real financial cost of every downtime event on your FMCG lines, or book a demo to see how Oxmaint quantifies the true per-minute cost of unplanned downtime on your specific line data.
$4–6K
Lost Revenue per Hour
per stopped FMCG production line — before accounting for reactive repair, waste, and schedule impact
4.8x
Emergency vs. Planned Repair Cost
reactive repair costs 4.8× more than the equivalent planned preventive maintenance task
15%
Typical Unplanned Downtime Rate
share of scheduled production time lost to unplanned failures in plants without structured PM programs
$1M+
Annual Downtime Cost per Line
total financial impact per FMCG production line annually at 15% unplanned downtime rate
Every minute of unplanned downtime has a precise financial cost — do you know yours?
Oxmaint calculates your per-minute downtime cost automatically — combining production throughput, labor burden, material waste, energy draw, and repair cost into a single financial figure that makes the ROI of preventive maintenance immediately obvious to every level of your organization.
The True Cost of Downtime: 6 Financial Impact Layers
Most FMCG plants calculate downtime cost as lost throughput value alone — and then wonder why their downtime ROI case never gets approved. The actual financial impact of unplanned downtime has six layers, each adding additional cost on top of the base production loss. Understanding all six is what transforms downtime from a maintenance KPI into a financial leadership conversation. Start a free trial and begin quantifying all six layers automatically, or book a demo to see the full downtime cost model applied to your plant data.
Layer 1
Direct Production Loss
Line throughput rate × product margin × downtime hours
The baseline layer — revenue that cannot be produced while the line is stopped. On a high-speed FMCG line generating $5,000 of product per hour, 3 hours of unplanned downtime equals $15,000 of production loss before any other cost is added. Most plants only calculate this layer — missing 40 to 60 percent of the true incident cost.
Typical share: 35–50% of total downtime cost
Layer 2
Reactive Repair Premium
Emergency labor rate (1.5–2.5× standard) + expedited parts premium
Unplanned repairs cost 4.8 times more than equivalent planned maintenance. The premium comes from emergency callout rates for technicians, next-day or same-day parts delivery at 3 to 5 times catalog price, and the time premium of diagnosing an unknown failure versus executing a documented procedure on a known maintenance task.
Typical share: 10–20% of total downtime cost
Layer 3
Material and Product Waste
WIP in process at stop + restart waste + spoilage risk during stoppage
Product in process at the moment of failure must often be scrapped — particularly in heat-sensitive, allergen-controlled, or time-critical applications. Perishable products sitting in a stopped line accumulate microbiological risk. The restart after a significant breakdown generates a startup waste cycle as the line restabilizes to production-quality conditions.
Typical share: 8–15% of total downtime cost in food manufacturing
Layer 4
Labor Idle and Recovery Cost
Operator idle hours (rate × headcount × downtime duration) + overtime recovery cost
Operators continue to be paid while their line is stopped — creating a pure labor cost with zero production output. To recover lost production, plants often run overtime shifts or Sunday production at premium rates. The recovery cost frequently exceeds the original production loss value by 20 to 40 percent when overtime rates and shift premiums compound.
Typical share: 10–18% of total downtime cost
Layer 5
Scheduling and Supply Chain Disruption
Changeover cost of emergency re-sequencing + expedited logistics cost
Unplanned downtime forces emergency rescheduling — disrupting downstream lines waiting for components, triggering expedited logistics to meet retailer OTIF (On-Time In Full) commitments, and potentially triggering retailer fines for missed delivery windows. Major FMCG retailers impose penalties of 1 to 3 percent of invoice value for OTIF failures — a cost that traces back directly to the original equipment failure.
Typical share: 5–12% of total downtime cost
Layer 6
Energy Demand Penalty
Peak demand charge triggered by restart load + inefficient idle energy draw
Many FMCG plants are on demand-based energy tariffs — where peak power draw during a shift determines the demand charge component of the electricity bill. Restarting multiple systems simultaneously after an unplanned stop creates a demand spike. Plants with multiple downtime events per shift may trigger demand charges that add 5 to 15 percent to their monthly energy bill without any corresponding production benefit.
Typical share: 3–8% of total downtime cost — often completely uncounted
Downtime Cost by Plant Type and Scale
Based on 8,000 annual operating hours, 15% unplanned downtime rate, all 6 cost layers included. Planned maintenance programs typically reduce this to 5–7% unplanned downtime.
Reactive Downtime vs. Proactive Prevention: Financial Comparison
How Oxmaint Reduces FMCG Downtime Cost
Per-Minute Cost
Financial Downtime Costing per Event
Every downtime event automatically carries a calculated financial cost — production loss, labor idle cost, and repair cost combined in real time. Maintenance managers present downtime impact in dollars, not hours — accelerating investment approval for preventive maintenance programs.
PM Scheduling
Production-Triggered Maintenance
PM tasks triggered by actual production cycles, run hours, and condition scores — not calendar dates. Ensures every critical component receives maintenance at the correct interval regardless of seasonal volume variation, with automated work order creation that removes scheduling manual effort.
Asset Intelligence
MTBF and Failure Pattern Analytics
Rolling MTBF analysis per asset identifies declining performance trends before the next failure — allowing intervention before the breakdown, not after. Failure pattern recognition on repeat-failure assets drives root cause investigation that eliminates, not just repairs, the recurring source of downtime cost.
Response Speed
Mobile Work Orders with Full Asset History
Technicians arrive at a breakdown with the complete asset maintenance history, previous failure causes, and embedded repair procedures on their mobile device — reducing MTTR by 30 to 50 percent by eliminating the diagnostic rework that occurs when responders approach an asset without context.
Downtime Reduction ROI
55%
Downtime Rate Reduction
From 15% to 7% unplanned downtime with structured preventive maintenance program at 12-month maturity
4.8x
Reactive vs. Planned Cost
The maintenance cost multiple eliminated by moving from reactive repair to planned preventive maintenance
35%
Total Maintenance Cost Down
Reduction in total maintenance spend at full PM maturity — from eliminating reactive repair premium costs
14pts
OEE Improvement
Typical OEE gain from structured PM program — from 63% baseline to 77% at 12-month PM compliance
Frequently Asked Questions
How do you calculate the true cost of downtime in FMCG manufacturing?
True FMCG downtime cost has six layers: direct production loss (throughput rate × margin × downtime hours), reactive repair premium (emergency labor and expedited parts at 4.8× planned cost), material and product waste (WIP scrapped at time of failure), labor idle and recovery cost (operator idle time plus overtime to recover output), scheduling and supply chain disruption (expedited logistics and potential retailer OTIF penalties), and energy demand penalty (peak demand charges from simultaneous system restart). Most plants calculate only the first layer — underestimating total downtime cost by 40 to 60 percent and systematically underinvesting in preventive maintenance as a result.
What is a realistic downtime reduction target for an FMCG plant with no PM program?
Plants operating without a structured preventive maintenance program typically have unplanned downtime rates of 12 to 18 percent of scheduled production time. Implementing a PM program with digital work order management, production-triggered maintenance scheduling, and mobile technician execution typically reduces unplanned downtime to 6 to 8 percent within 12 months of deployment — a 50 to 55 percent reduction. World-class FMCG plants with mature TPM and PM programs achieve unplanned downtime below 3 percent, but this requires 3 to 5 years of consistent program execution.
Why do FMCG plants underestimate downtime cost?
FMCG plants systematically underestimate downtime cost for three reasons: they track downtime in hours rather than in dollars with all cost layers included; they attribute repair costs to the maintenance budget rather than the production downtime event; and they rarely quantify the supply chain and schedule disruption costs that cascade from unplanned stoppages. This accounting gap means the business case for preventive maintenance investment routinely looks weaker than it actually is — delaying approvals that would deliver 4 to 8× return on investment within 18 months.
How quickly can Oxmaint reduce downtime cost in an FMCG plant?
The first measurable downtime reduction from Oxmaint deployment is typically visible within 30 to 60 days — driven by capturing previously untracked downtime events and their causes, which immediately enables Pareto prioritization of the highest-cost failure categories. Structural OEE improvement of 8 to 12 percentage points is typically achieved by month 9 to 12, as PM compliance builds and the highest-frequency failure causes are systematically addressed through root cause improvement cycles. The full 50 to 55 percent reduction in unplanned downtime rate occurs at the 12 to 18 month mark as PM program maturity reaches the point where planned work ratio exceeds 80 percent.
Know the exact dollar cost of every downtime minute — and the ROI of preventing the next one
Oxmaint's FMCG platform captures all six layers of downtime cost in real time, tracks MTBF trends to predict the next failure before it occurs, and builds the financial business case for preventive maintenance investment automatically. Every demo booking becomes a downtime cost reduction conversation — because the numbers make the case themselves.