Unplanned downtime in FMCG production is not just an inconvenience — it is a financial hemorrhage. At an average cost of $3,000 to $5,000 per minute of lost output, a single unexpected line stoppage lasting 45 minutes can wipe out a full shift's margin on that product. Most FMCG plants experience 25 or more unplanned incidents per month, losing an average of 30 hours of production time they can never recover. The good news: the majority of these stoppages are preventable — not through expensive capital investment, but through structured visibility, predictive maintenance, and production-based work order triggers. Start a free trial and begin reducing your unplanned downtime within the first month, or book a demo to see exactly how Oxmaint intercepts failures before they reach your production line.
$3k–$5k
Cost Per Minute
of unplanned downtime in FMCG production
25
Incidents Per Month
average unplanned stoppages per FMCG facility
42%
Caused by Equipment
the leading cause of unplanned FMCG line stoppages
35–50%
Downtime Reduction
achievable with predictive maintenance deployment
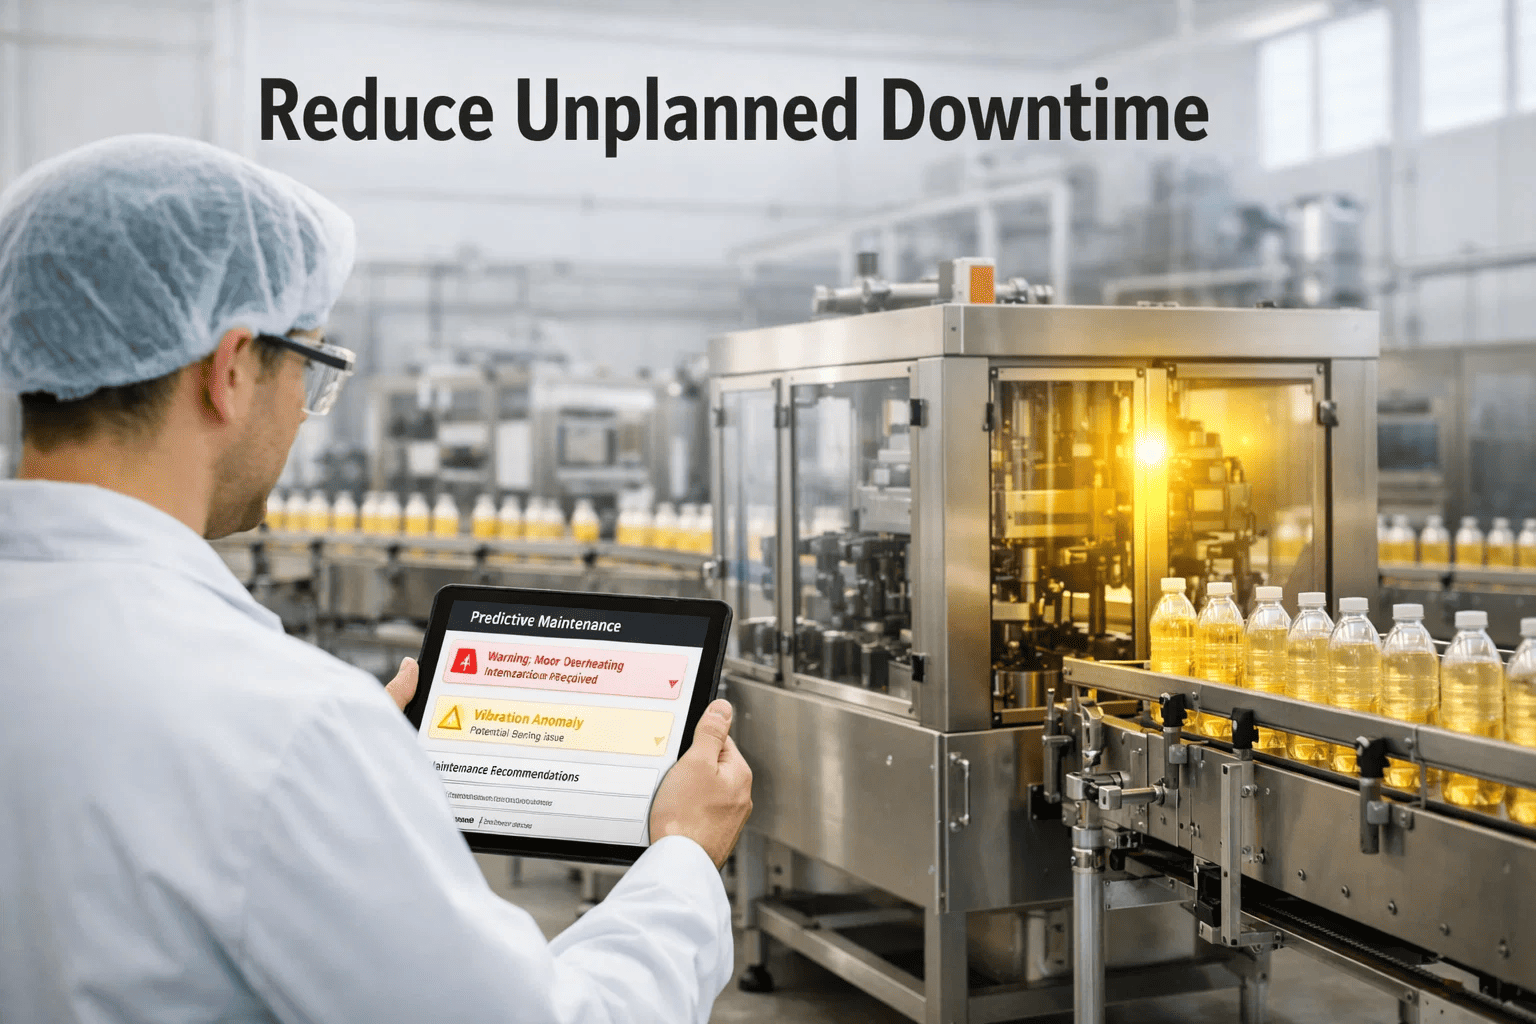
Every unplanned stoppage is a failure of visibility — fix that first
Oxmaint gives FMCG production teams the asset health tracking, condition-based PM scheduling, and real-time IoT monitoring needed to intercept equipment failures before they reach the production floor.
What Is Unplanned Downtime and Why Is It So Costly in FMCG?
Unplanned downtime occurs when a production line stops for an unscheduled reason — equipment failure, material shortage, operator error, or an upstream process breakdown. Unlike planned stops (changeovers, sanitation, scheduled maintenance), unplanned stoppages cannot be managed around. They interrupt production at the worst time, require emergency response, and frequently compound: a stalled conveyor creates a product jam that triggers a quality hold that delays the next scheduled run.
The True Cost of One Unplanned Stoppage
1
Direct Output Loss
Units not produced during the stoppage — calculated at full margin contribution, not just material cost. A 60-minute stop at $3,500/min = $210,000 in lost production value.
2
Emergency Repair Premium
Emergency repairs cost 4.8x more than planned maintenance. Rush parts procurement, overtime labor, and expedited contractor call-outs transform a $600 planned PM into a $2,900 emergency repair.
3
Product Loss and Waste
In-process product exposed during an unplanned stop — open fillings, interrupted pasteurization, contamination risk — frequently requires disposal. In food plants, this adds $5,000–$40,000 per food safety incident.
4
Schedule Cascade and Overtime
Missed production targets require overtime recovery runs — often at 1.5x to 2x labor cost — and push back downstream scheduling, potentially causing missed customer delivery windows with contractual penalties.
Root Causes of Unplanned Downtime in FMCG Production Lines
Not all downtime sources are equal. Accurate pareto analysis of your plant's specific downtime causes is the foundation of any reduction program. Before investing in solutions, you need to know whether your biggest problem is equipment failure, changeover delays, minor stoppages, or upstream supply. The most common root causes — and their relative contribution in FMCG plants — are:
42%
Equipment Failure
Mechanical or electrical failures that halt the line. Includes bearing seizures, motor burnouts, sensor faults, and pneumatic system failures. The highest-impact cause and the most directly preventable with planned maintenance.
29%
Aging Infrastructure
Equipment operating beyond its design life or maintained on an extended replacement cycle for budget reasons. Assets without condition scoring accumulate hidden degradation that eventually becomes an unplanned failure.
18%
Human Error
Operator setup errors, missed lubrication, incorrect changeover steps, and improper restart procedures. Most human-error downtime is addressable through digital inspection checklists and structured operator SOPs.
11%
Supply Chain Issues
Material shortages, ingredient quality failures, and packaging supply gaps that force unscheduled line stoppages. Partly outside maintenance control, but predictable scheduling gaps allow proactive mitigation.
Reactive vs. Proactive Maintenance: The Downtime Impact
The single most powerful downtime reduction lever available to any FMCG plant is shifting maintenance from reactive to planned and predictive. This is not about spending more on maintenance — it is about spending maintenance resources before failures occur, not after them. The operational outcomes of this shift are measurable and compound over time.
Six Strategies to Reduce Unplanned Downtime in FMCG
Downtime reduction is a program, not a single fix. The most successful FMCG plants layer multiple strategies that compound on each other — starting with visibility, progressing to prevention, and ultimately reaching prediction. Start a free trial to implement all six of these strategies in a unified platform, or book a demo to see each one in action.
01
Real-Time Downtime Capture
Automate downtime capture with IoT signals or operator input — capturing reason codes, duration, and affected assets in real time. You cannot reduce what you cannot measure. Most plants undercount downtime by 25–40% using manual logs.
02
Asset Condition Scoring
Give every critical asset a live health score based on sensor data, inspection results, and PM history. Declining condition scores are the signal to act — before the asset fails in the middle of a production run.
03
Production-Triggered PM
Schedule maintenance by production units, cycles, and run hours — not calendar dates. A conveyor that runs 24/7 during peak season ages 3x faster than during off-peak. PM schedules that ignore this create dangerous maintenance gaps.
04
IoT and SCADA Integration
Connect production line sensors directly to your maintenance management system. Vibration anomalies, temperature drift, and pressure deviation automatically generate maintenance alerts — before human operators notice any performance change.
05
Pareto-Driven Priority Focus
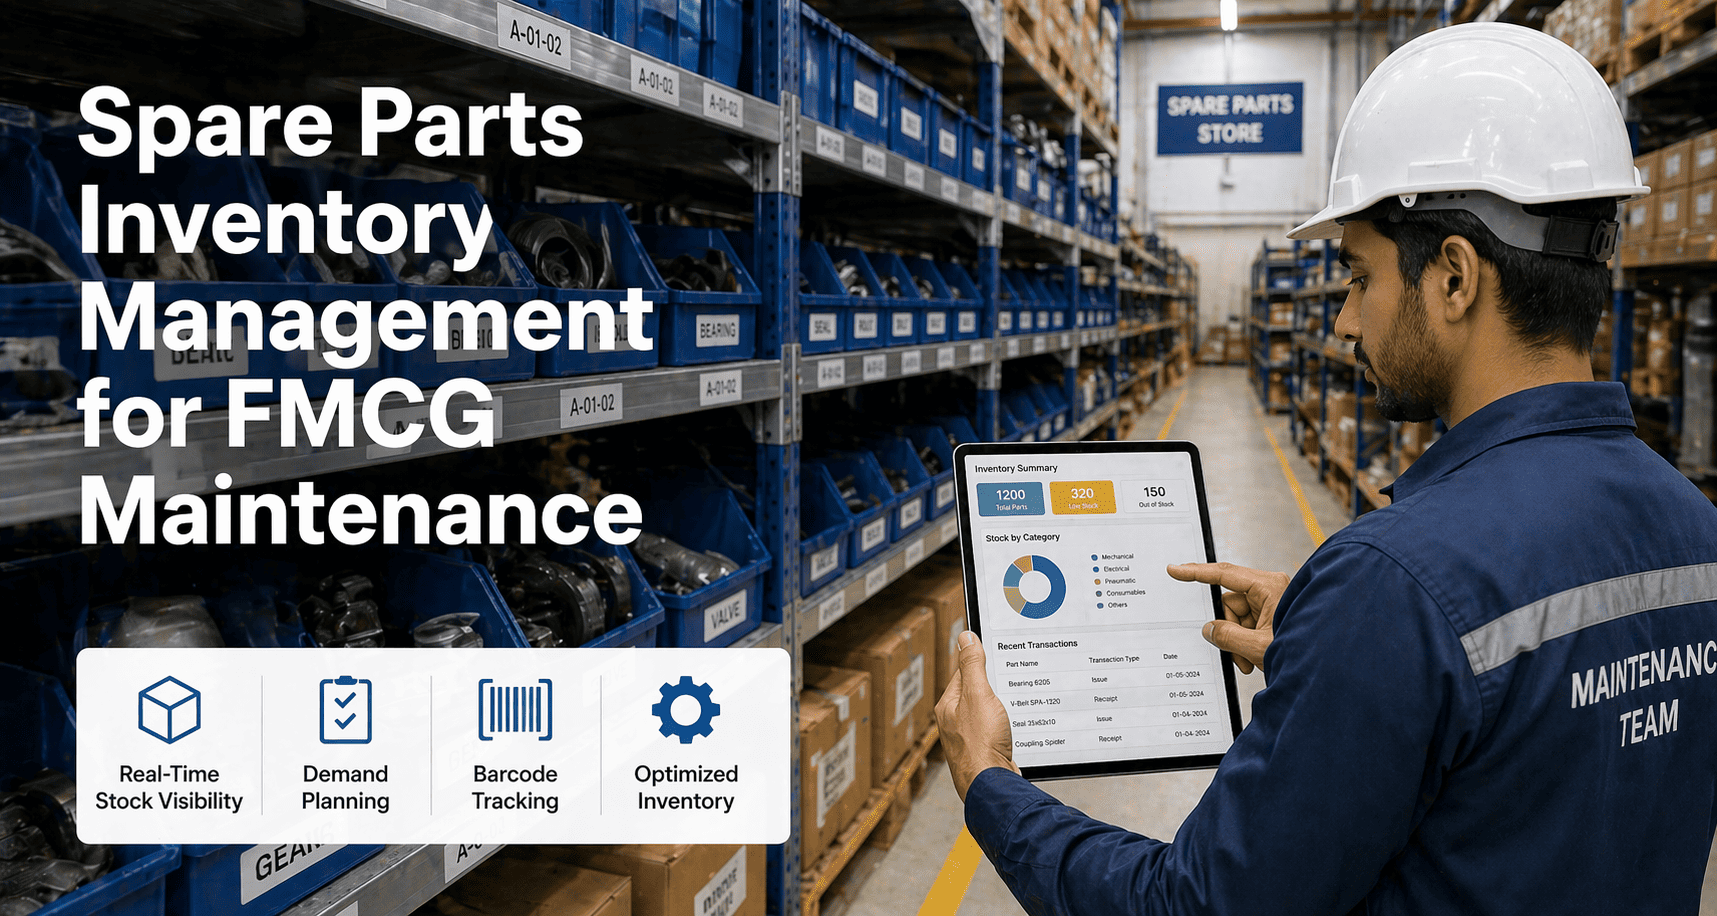
Apply the 80/20 rule: identify the top 20% of assets or failure modes generating 80% of your downtime. Focus maintenance investment, spare parts, and inspection frequency on these assets first. Most plants have 4–6 assets driving the majority of their downtime losses.
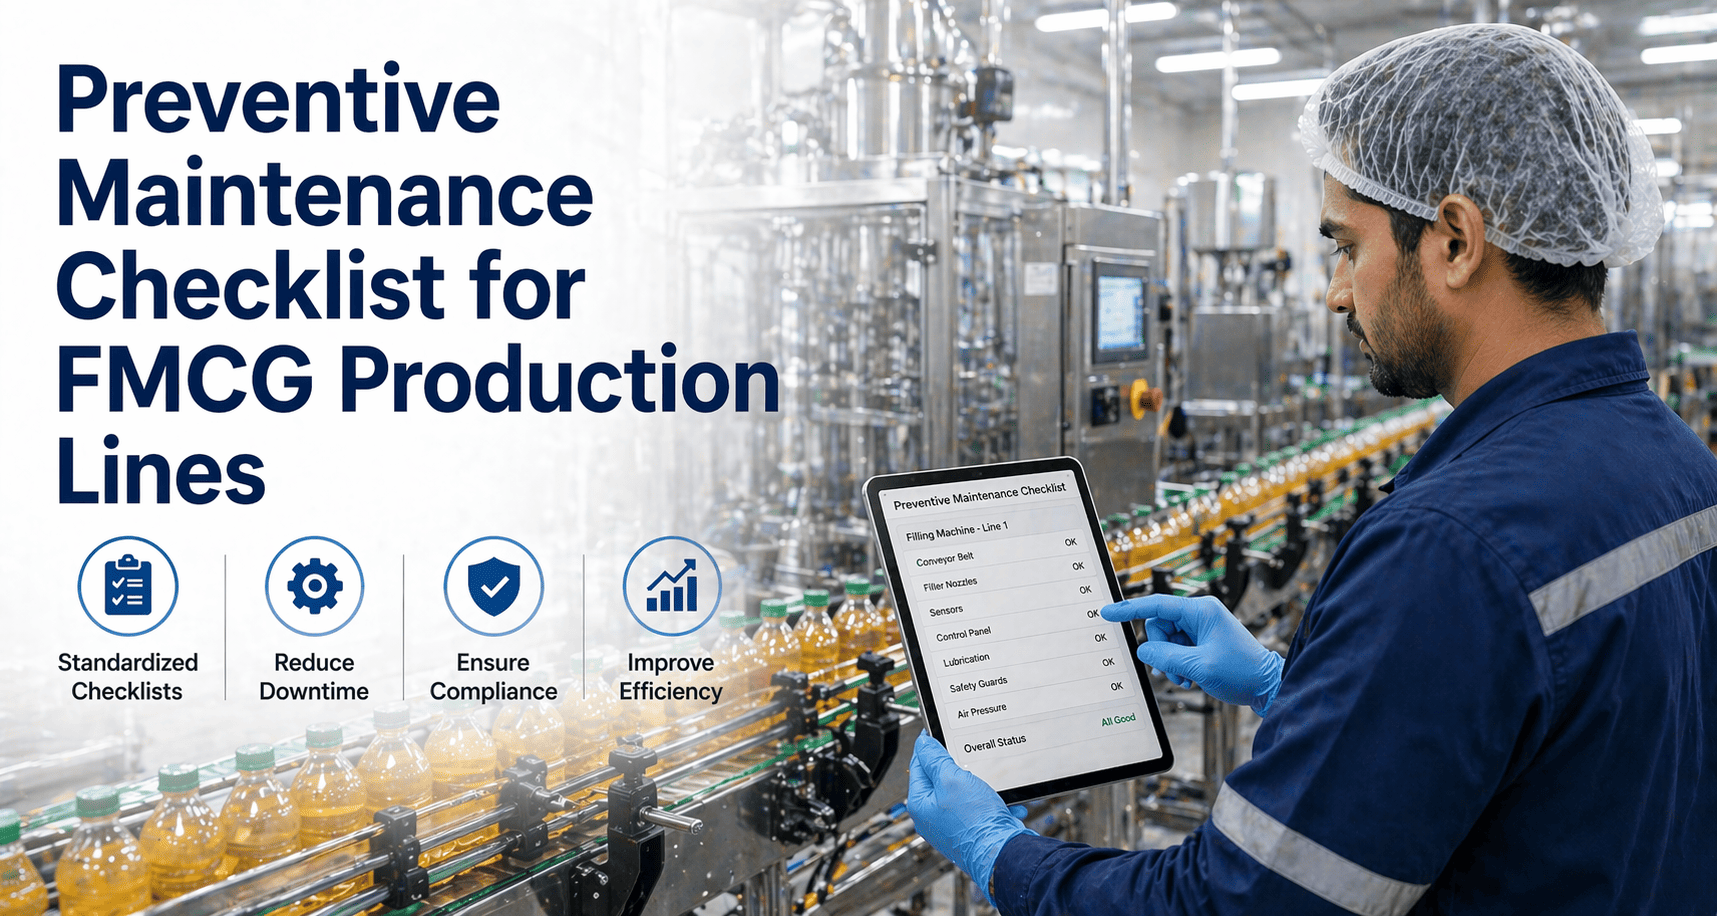
06
Digital Operator Inspections
Replace paper-based operator rounds with mobile digital checklists that capture asset condition, abnormality reports, and GMP compliance in real time. Operator-reported early warning signs are the lowest-cost early detection mechanism available.
How Oxmaint Reduces Unplanned Downtime in FMCG Plants
Step 1
Build Your Full Asset Registry
Every production line asset entered with nameplate data, condition rating, maintenance history, and criticality score. The asset registry is the foundation — you cannot manage what is not mapped.
Step 2
Activate Condition-Based PM Scheduling
Maintenance tasks automatically triggered by production counts, run hours, and IoT sensor thresholds — dispatched to technician mobile apps with full asset context and required parts list attached.
Step 3
Monitor Asset Health in Real Time
IoT and SCADA integration feeds live asset condition data into Oxmaint health scores. Anomaly alerts fire automatically — giving maintenance teams 2 to 8 weeks of lead time before failure on critical rotating equipment.
Step 4
Track Downtime and Drive Improvement
Every stoppage — planned and unplanned — captured with reason code, duration, and asset link. Pareto reports surface the top downtime drivers across every shift and line, prioritizing where improvement effort delivers the largest return.
Downtime Reduction Results
35–50%
Downtime Reduction
Reported by FMCG plants deploying predictive maintenance with real-time condition monitoring
4.8x
Emergency Cost Premium
Reactive repair costs versus planned maintenance costs — the financial case for prevention versus reaction
92%
PM Compliance Achievable
Best-in-class FMCG plants complete over 92% of scheduled PMs on time with digital work order management
11 months
Average ROI Breakeven
Typical time to full investment return from downtime reduction savings and maintenance cost optimization
Frequently Asked Questions
How much does unplanned downtime cost an FMCG plant per year?
A typical FMCG facility losing 30 hours per month to unplanned downtime — at a conservative $3,000 per minute — loses approximately $5.4 million per year in direct production output. When emergency repair premiums, product disposal, overtime recovery, and customer delivery penalties are added, the annual true cost of unplanned downtime frequently reaches 8–11% of annual revenue for affected manufacturers.
What is the fastest way to reduce unplanned downtime in a food plant?
The fastest impact comes from two actions: first, implementing real-time automated downtime capture with reason coding — this immediately reveals which assets and failure modes are driving 80% of losses. Second, shifting the top 10–15 highest-impact assets from reactive to condition-based planned maintenance. Most plants see measurable downtime improvement within 30–60 days of implementing these two steps because they eliminate the most frequent and costly repeat failures first.
Can predictive maintenance eliminate all unplanned downtime?
No maintenance strategy eliminates all unplanned downtime — sudden failures from external events, material defects, or catastrophic overstress will always occur. However, predictive maintenance with IoT monitoring routinely reduces equipment-related unplanned downtime by 35–50%, and best-in-class programs reduce it by 60–70% on monitored assets. The goal is not zero — it is reducing unplanned events to the point where scheduled maintenance windows absorb virtually all required maintenance work.
How does production-triggered maintenance differ from calendar PM?
Calendar-based PM schedules maintenance at fixed time intervals regardless of actual equipment use. A filling machine running 18-hour days in peak season accumulates wear three times faster than during a 6-hour off-peak day — a monthly calendar PM schedule protects neither situation correctly. Production-triggered maintenance schedules PM tasks based on actual units produced, cycles completed, or run hours accumulated — ensuring maintenance always occurs at the right interval for actual equipment condition, eliminating both over- and under-maintenance.
Stop losing production to failures you could have seen coming
Oxmaint gives FMCG plant teams real-time asset health monitoring, production-triggered PM scheduling, and automated downtime analytics — deployed in days, not months. Join manufacturers already running 35–50% fewer unplanned stoppages.