Most plants can quote their OEE number without hesitation. Far fewer can say exactly which of the six loss categories is dragging it down, or by how much. That gap is where improvement plans go generic — teams chase the loss that's loudest instead of the one that's biggest, and OEE barely moves despite real effort.
A Number Alone Doesn't Tell You Where To Act
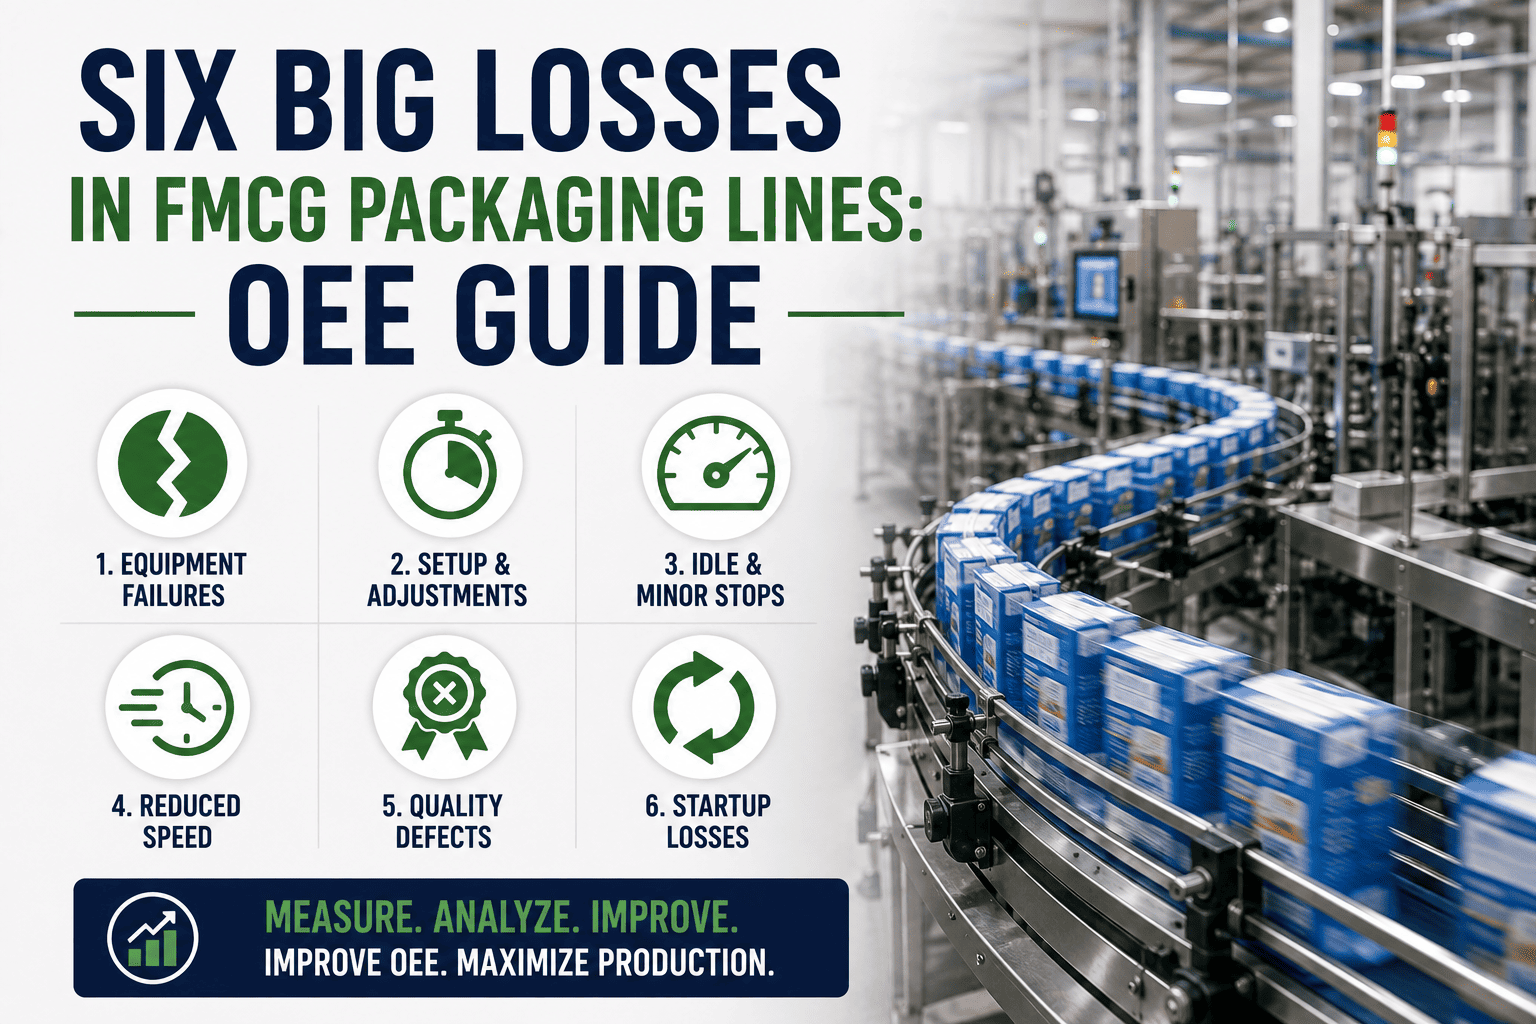
The Six Big Losses framework exists because OEE by itself is a scorecard, not a diagnosis. Breaking it into breakdowns, changeover, small stops, reduced speed, startup rejects, and quality defects turns one number into six answerable questions — and points improvement effort at whichever one is actually costing the most.
The Losses Everyone Underestimates
Two categories consistently get missed because they don't look dramatic on their own.
Micro-Stops
Individually too short to log as downtime, but dozens per shift can add up to more lost time than one breakdown.
Reduced Speed Loss
A line running below rated speed doesn't trigger any alarm, so it can persist for months unnoticed.
Startup Rejects
Product scrapped while a line ramps back up gets treated as normal, even when it's a recurring, trackable loss.
Loss Category, OEE Factor Affected, How To Measure It
| Loss Category |
OEE Factor Affected |
How To Measure It |
| Breakdowns & changeovers |
Availability |
Logged stop duration against planned run time |
| Micro-stops & reduced speed |
Performance |
Actual output rate against ideal cycle time |
| Startup rejects & defects |
Quality |
Good units produced against total units run |
Turning Six Losses Into A Prioritized Plan
Loss Category Tagging
Every stop, slowdown, and reject tagged to one of the six categories, not lumped into a generic downtime bucket.
Loss Ranking By Impact
Categories ranked by total time or output lost, so improvement effort goes to the biggest number first.
Trend Tracking Over Time
Each category's contribution tracked month over month, proving whether an improvement action actually worked.
The Six Big Losses framework only drives real OEE improvement when every stop and defect is logged to the right category automatically, not reconstructed from memory at month-end. Teams that sign up for Oxmaint tag every loss event, rank categories by impact, and track OEE trends against every line automatically, or book a demo to see a Six Big Losses improvement program running live.
Q
Why do micro-stops often outweigh breakdowns in total lost time?
A single breakdown gets noticed and logged, but dozens of short stops under a few minutes each often go unrecorded individually, even though their combined duration across a shift can exceed the time lost to one major failure.
Q
How is reduced speed loss different from a stoppage?
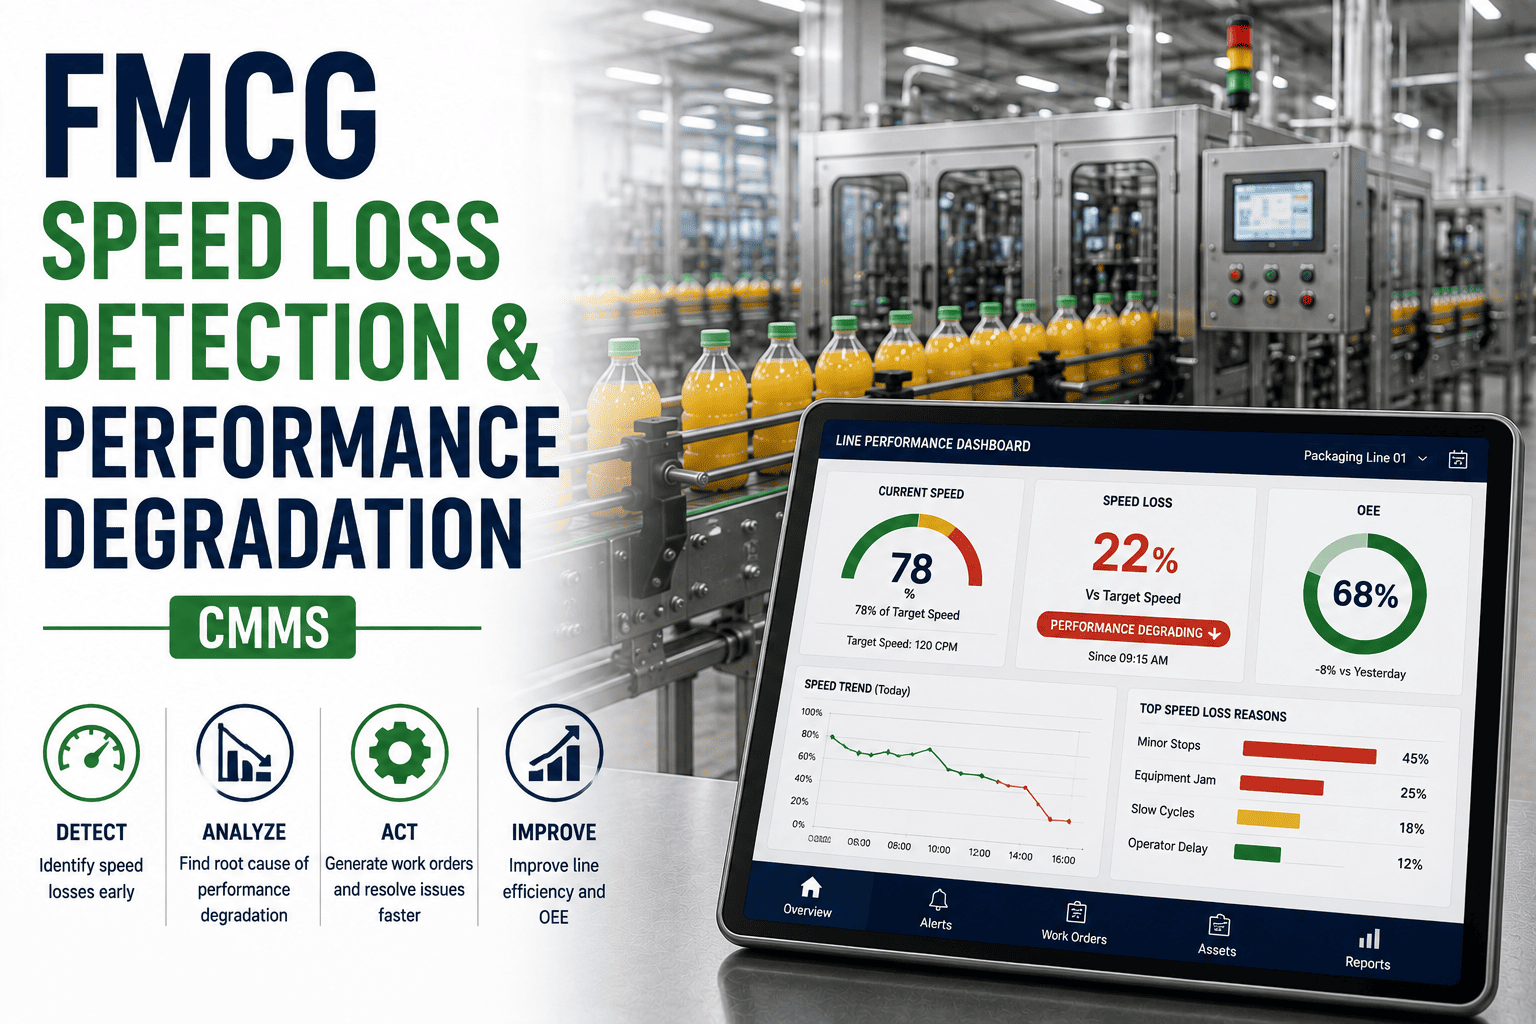
Reduced speed loss happens while the line is technically running, just below its rated cycle time, so it doesn't generate a downtime event at all — it only becomes visible when actual output is compared against the ideal rate.
Q
Which loss category should a plant tackle first?
The category should be chosen by measured impact, not intuition — ranking all six by total time or output lost usually reveals a different priority than whichever loss happens to be most visible on the floor.
Find Out Which Loss Is Actually Costing You The Most
Tag every stop, slowdown, and reject to the right loss category and track OEE trends against every packaging line. Sign up for a free trial to set up your first Six Big Losses tracking program, or book a demo to see it running live.
.png)