A dairy plant in Punjab lost its environmental discharge consent for 6 weeks after its effluent treatment plant failed a surprise inspection — BOD levels at 380 mg/L against a permitted limit of 30 mg/L. The root cause was a failed aerator motor that had been drawing elevated current for 3 weeks before seizure, combined with an RO membrane that had not been cleaned in 8 months and was operating at 40% of design permeate flow. The plant had to tanker 200,000 litres of effluent daily to an authorized treatment facility at $1,800 per day while repairs were completed — a $75,000 bill for a problem that a $200 motor vibration check and a $400 membrane cleaning would have prevented entirely. Water and wastewater systems in FMCG facilities are regulated infrastructure with hard compliance limits — and unlike production equipment, their failure does not just cost money; it stops the plant. A facility that cannot treat its effluent to discharge standards cannot produce, because production generates wastewater that has nowhere to go. Start your free trial to track water and wastewater system maintenance with compliance dashboards. Book a demo to see OxMaint's Energy and Sustainability Tracking module for water systems.
Energy & Sustainability Tracking
Your Discharge Consent Depends on Equipment That Nobody Maintains
OxMaint tracks water treatment and ETP maintenance — membrane cleaning schedules, chemical dosing pump PM, aerator motor health, and discharge parameter trending — connecting every maintenance action to regulatory compliance status.
15–25%
of FMCG plant operating cost consumed by water intake, treatment, and discharge
$75K–$200K
typical cost of a single ETP failure event — tankering, fines, and production hold
20–35%
water cost reduction achievable through treatment system maintenance optimization
The Two Water Systems Every FMCG Plant Must Maintain
FMCG facilities operate two water systems that are mirror images of each other: the intake treatment system that turns raw water into process-quality water, and the effluent treatment system that turns process wastewater into discharge-compliant water. Both systems have equipment that degrades gradually, both have regulatory compliance limits that cannot be exceeded, and both are chronically under-maintained because they sit outside the production area and out of the maintenance team's daily line of sight.
Intake Water Treatment
Raw water to process-grade quality
Multimedia filters (sand, carbon, softeners)
RO membranes and high-pressure pumps
UV disinfection and chlorination systems
Chemical dosing (antiscalant, pH adjustment)
Storage tanks and distribution pumps
If it fails: product quality risk, CIP effectiveness compromised, production water supply interrupted
Effluent Treatment (ETP)
Process wastewater to discharge-compliant quality
Equalization tank and pH correction
Aeration system (blowers, diffusers, motors)
Clarifiers and sludge handling
Tertiary filtration and polishing
Discharge monitoring and flow measurement
If it fails: discharge consent revoked, production must stop, tankering costs $1,500–$3,000/day
The ETP is the higher-risk system because its failure has an immediate regulatory consequence. An intake water system failure degrades product quality gradually and can be compensated with temporary measures (tanker water, bottled water for sensitive processes). An ETP failure that causes a discharge exceedance is a regulatory event that can result in consent revocation, production shutdown orders, and fines — with no workaround other than tankering effluent off-site at $1,500–$3,000 per day until the system is repaired.
The Six Components That Determine Water System Performance
RO Membranes
Fouling from scaling, biofilm, and colloidal deposits reduces permeate flow by 5–15% per month without cleaning. Damaged membranes pass contaminants that compromise product water quality and increase downstream treatment load.
PM: Permeate flow and rejection rate check daily. Normalized permeate flow trending weekly. CIP cleaning when flow drops 10–15% from baseline. Membrane autopsy on replacement to identify fouling type.
Chemical Dosing Systems
Metering pump diaphragm wear causes under-dosing of antiscalant (accelerates membrane fouling), chlorine (microbiological risk), or pH adjustment chemicals (corrosion or scaling). Dosing accuracy drifts 10–20% over 3–6 months without calibration.
PM: Dosing rate verification against target weekly. Pump diaphragm inspection quarterly. Calibration tube test monthly. Chemical tank level trending to verify consumption matches expected rate.
Aeration System (Blowers, Diffusers, Motors)
Diffuser membrane fouling reduces oxygen transfer efficiency by 20–40% — biological treatment becomes oxygen-limited and BOD removal drops below discharge limits. Blower bearing failure is the single most common cause of total ETP failure in FMCG facilities.
PM: Dissolved oxygen monitoring continuous. Blower vibration check weekly. Diffuser efficiency test quarterly (oxygen transfer rate). Motor current trending continuous. Blower oil and filter change per OEM schedule.
Clarifiers and Sludge Handling
Sludge scraper mechanism failure causes sludge buildup that reduces effective settling volume. Sludge pump failure causes sludge to overflow into effluent — catastrophic TSS exceedance. Return sludge pump failure starves biological process of active biomass.
PM: Sludge blanket depth measurement daily. Scraper mechanism inspection weekly. Sludge pump flow and pressure check weekly. Sludge age calculation monthly to maintain biological process health.
pH Correction and Equalization
pH probe fouling gives false readings — system over- or under-doses acid/alkali. Equalization tank mixer failure causes slug loads to hit the biological process, shocking the biomass and causing 3–7 days of poor treatment while biology recovers.
PM: pH probe cleaning and calibration weekly. Equalization mixer function check daily. Chemical dosing pump verification weekly. Influent pH trending to detect slug loads from production.
Instrumentation and Online Analyzers
Flow meters, turbidity sensors, conductivity probes, and online BOD/COD analyzers all drift without calibration. Drifted instruments give false compliance readings — the discharge report shows "pass" while the actual effluent exceeds limits.
PM: All online analyzers calibrated monthly against lab reference. Flow meter verification quarterly. Sensor cleaning weekly. Replacement of pH and DO probes per OEM lifecycle (typically 12–18 months).
Compliance Dashboard
Track Every Parameter Against Discharge Limits in Real Time
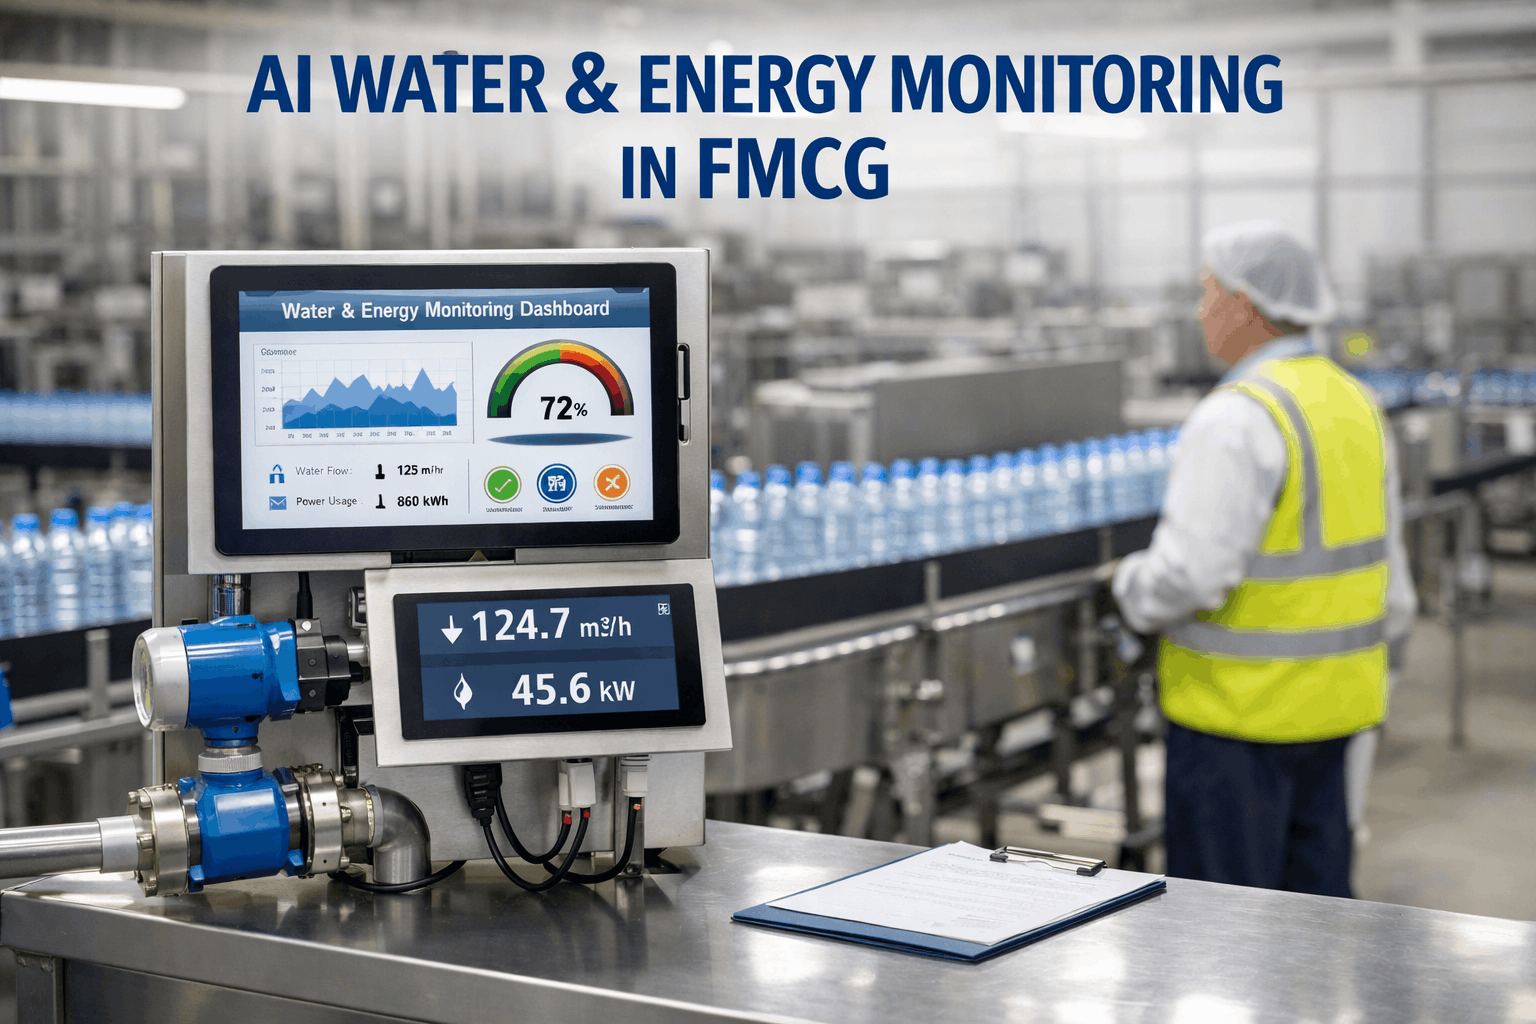
OxMaint connects to water system instrumentation and displays BOD, COD, TSS, pH, and flow against your consent limits — alerting maintenance when equipment degradation threatens compliance before an exceedance occurs.
Discharge Compliance: The Parameters That Determine Whether You Can Produce
The BOD and TSS limits are the most frequently breached parameters in FMCG effluent treatment because they depend on biological process health — which in turn depends entirely on aeration and clarification equipment maintenance. A blower that fails on Friday night and is not repaired until Monday morning creates 60 hours of oxygen-depleted conditions in the biological reactor. The biomass dies or goes dormant. Even after the blower is repaired, biological recovery takes 3–7 days — during which every litre of effluent discharged is non-compliant.
Water Cost Optimization: Where Maintenance Saves Money
Beyond compliance, water system maintenance directly reduces operating costs. An RO membrane running at 60% efficiency due to fouling consumes 40% more electricity per cubic meter of permeate. A blower running with a fouled intake filter draws 15–25% more power. These energy penalties accumulate quietly on the electricity bill, hidden inside overall plant consumption.
RO Membrane Cleaning
Clean on schedule vs. run to minimum flow
25–40% energy reduction per m3 of permeate; 2x membrane life extension from 3 to 6 years
$18K–$35K/yr savings
Blower Filter Maintenance
Replace intake filters on schedule vs. run until blocked
15–25% blower energy reduction; prevents motor overheating and premature bearing failure
$8K–$18K/yr savings
Leak Survey on Water Distribution
Quarterly survey of process water distribution lines
Typical FMCG plant loses 5–12% of treated water to distribution leaks that go undetected
$6K–$15K/yr savings
Chemical Dosing Optimization
Calibrate dosing pumps monthly vs. run at fixed rate
15–30% chemical cost reduction from precise dosing instead of over-dosing for safety margin
$5K–$12K/yr savings
The ROI: What Water System Maintenance Delivers
Compliance event avoidance
$75K–$200K/event
Energy optimization
$32K/yr
Membrane and equipment life
$20K/yr
Chemical cost reduction
$12K/yr
Water loss reduction
$10K/yr
Annual water system PM programme cost$14,000
Annual savings + risk prevention$74K/yr + $75K–$200K/event
One Prevented ETP Failure Pays for 5–14 Years of Water System Maintenance
Implementation: 45-Day Water System Maintenance Programme
Week 1–2
Water System Asset Census and Baseline
Register every pump, blower, membrane, dosing system, analyzer, and instrument as individual CMMS assets. Record nameplate data, current operating parameters, and last maintenance date. Baseline RO permeate flow, blower vibration, and all discharge parameters against consent limits. Photograph current condition.
Week 3–4
Fix Critical Findings and Calibrate Instruments
Clean fouled RO membranes. Replace failed diffuser membranes. Calibrate all online analyzers against lab reference. Repair any leaking dosing pumps. Verify all discharge monitoring instruments are reading accurately. Address any finding that threatens immediate compliance.
Week 5–6
Build PM Schedule and Compliance Dashboard
Create component-specific PM templates: membrane cleaning triggers, blower PM weekly, dosing pump monthly, analyzer calibration monthly, clarifier inspection weekly. Configure compliance dashboard showing all discharge parameters against consent limits with alert thresholds at 80% of limit. First full PM cycle executed.
Frequently Asked Questions
Energy & Sustainability Tracking
Every Membrane Maintained. Every Parameter Tracked. Every Consent Protected.
20–35%
water cost reduction