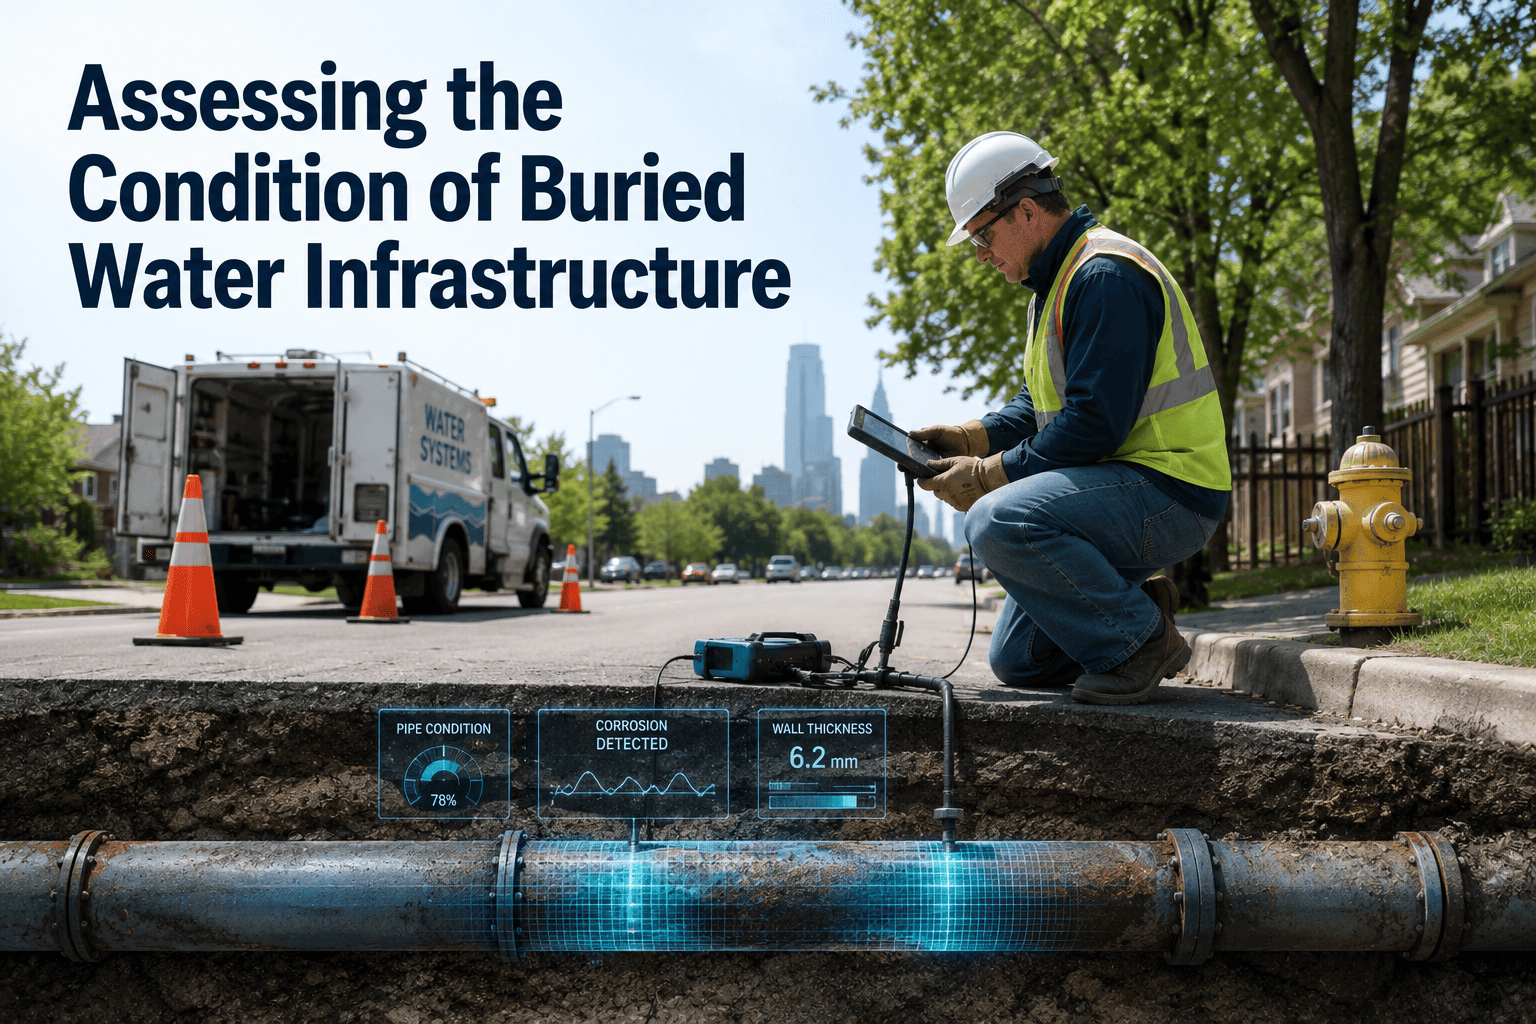
Assessing the Condition of Buried Water Infrastructure

By Corin Hale on July 9, 2026

asset-condition-assessment-buried-water-infrastructure

A mid-sized utility in the Midwest lost water service to nearly 4,000 households last winter when a 60-year-old cast iron main gave way under a frozen intersection. Nobody had inspected that stretch of pipe in over a decade, because it was buried eight feet down with no visible signs of trouble. Across the U.S. and Canada, utilities now report over 260,000 water main breaks every year, costing roughly $2.6 billion in repairs alone, and the average failing pipe is 53 years old. If your buried assets are still assessed by guesswork and gut feel, start a free trial with Oxmaint to see how continuous condition data changes the picture.

Water & Wastewater Utilities / Buried Asset Intelligence

Assessing the Condition of Buried Water Infrastructure Before It Assesses Itself

Buried pipes are the hardest assets to see and the most expensive to replace on a guess. Oxmaint combines direct and indirect condition data into a single risk score per pipe segment, so replacement dollars go to the mains that actually need them.

452,000
miles of U.S. and Canadian water main past their useful life
260,000
water main breaks reported annually across both countries
53 yrs
average age of a water main at the point of failure
$452B
funding shortfall to replace pipe already beyond service life
Stop Guessing, Start Scoring

Turn Buried Pipe Into a Ranked, Manageable Asset List

Oxmaint pulls together pipe age, material, soil corrosivity, break history, and inspection data into one likelihood-of-failure score per segment, built on the same risk logic utilities already use for asset management planning.

Why Buried Pipe Is the Hardest Asset in Your Inventory

A transformer or a pump throws a warning sign long before it fails: heat, noise, vibration you can hear from the room next door. A water main gives you nothing until the ground opens up. Direct assessment methods, like excavation and internal pipe inspection, give the clearest picture of true condition but are slow and costly to run across an entire system. Indirect methods, such as ground-penetrating radar, acoustic leak correlation, and soil corrosivity surveys, let utilities screen far more pipe without digging, then send direct assessment crews only where the risk score says it matters.

The Condition Assessment Toolkit — Direct vs. Indirect Methods
Indirect
Acoustic & Vibration Leak Detection
Sensors listen for the sound signature of a leak or wall thinning traveling through the pipe wall, without breaking ground.
Indirect
Soil Corrosivity & Over-the-Line Survey
Resistivity and potential readings along the pipe route flag corrosive soil pockets that erode metallic mains from outside.
Direct
Internal Pipe Inspection
Cameras or sensor tools travel inside the main to measure wall loss, tuberculation, and joint condition first-hand.
Direct
Excavation & Coupon Sampling
A physical pipe sample is pulled and tested — the most accurate read on condition, reserved for the highest-risk segments.

Four Reasons Buried Pipe Fails Without Any Warning

01
Corrosive Soil Works From the Outside In
Ductile iron pipe sitting in highly corrosive soil fails at more than six times the rate of the same pipe in low-corrosivity ground, and most of that damage is invisible from the surface.
02
Legacy Materials Are Still in the Ground
Cast iron mains break at roughly ten times the rate of PVC, yet a large share of North American distribution systems still rely on cast iron and asbestos cement pipe laid over 50 years ago.
03
Small-Diameter Pipe Fails Far More Often
Mains 12 inches and under fail roughly five times more frequently than larger transmission pipe, but they rarely get the same inspection budget or attention.
04
Replacement Budgets Can't Cover Everything
At an estimated one million dollars per mile, no utility can replace every aging main at once — condition data is the only way to know which mile actually needs to move first.

How Oxmaint Builds a Living Condition Score for Every Buried Segment

Oxmaint layers pipe records, inspection results, and field sensor data into one platform, converting scattered condition assessment activity into a continuously updated risk register your team can act on. See it mapped against your own service area — start a free 30-day trial or book a demo with our water infrastructure team.

01
Likelihood-of-Failure Scoring
Pipe age, material, diameter, soil corrosivity, and break history combine into a single likelihood-of-failure score per segment, aligned with standard water main risk frameworks.
02
Consequence-of-Failure Mapping
Segments are weighted by what a break would actually cost — proximity to hospitals, road class, customer count — so risk and consequence rank together, not separately.
03
Inspection Data Consolidation
GPR surveys, acoustic leak logs, and internal inspection reports feed into one segment record instead of living in separate spreadsheets and shared drives.
04
Break History Pattern Tracking
Repeat breaks on the same segment or material class are automatically flagged, surfacing early corrosion clusters before a third or fourth failure occurs.
05
Automated Replacement Work Orders
When a segment crosses a critical risk threshold, a work order is generated automatically and routed for capital planning review, closing the loop between data and action.
06
System-Wide Risk Dashboard
Every mile of buried main, ranked by risk, in one map-based dashboard your capital planning team can review in a single meeting instead of a week of spreadsheet reviews.
See Your System Ranked by Risk

Know Which Mile of Pipe to Fund Next Year

Bring your pipe inventory into Oxmaint and get a risk-ranked replacement list built from the same condition data your assessment program already collects, without months of manual GIS work.

Periodic Manual Assessment vs. Oxmaint Continuous Risk Scoring

CategoryPeriodic Manual AssessmentOxmaint Continuous ScoringBusiness Impact
Data sources Separate spreadsheets, paper inspection logs Pipe records, sensors, and inspections in one view Faster, more accurate prioritization
Assessment cycle Every 5 to 10 years, if budget allows Continuously updated risk register Emerging risk caught earlier
Prioritization method Oldest pipe first, regardless of true condition Likelihood and consequence of failure combined Capital spent where risk is highest
Repeat break detection Noticed only after multiple incidents Automatically flagged after first pattern signal Fewer repeat emergency repairs
Replacement planning Manual report compiled once a year Live dashboard ranked by segment risk Faster capital planning cycles

What Better Condition Data Means for Your Capital Plan

$10,000
Average cost of a single water main break repair
5x
Higher failure rate for small-diameter pipe left unscreened
6x
Higher break rate for metallic pipe in corrosive soil
$1M/mi
Typical replacement cost that risk scoring helps you avoid wasting

Frequently Asked Questions

What is the difference between direct and indirect condition assessment?+
Direct methods, like excavation or internal inspection, physically examine the pipe wall and give the most accurate read. Indirect methods, like acoustic monitoring or soil surveys, screen much more pipe without digging so direct assessment can be targeted where risk is highest.
How often should a water utility run a condition assessment program?+
Most utilities can't afford to physically assess every mile on a fixed schedule, which is why risk-based programs continuously re-score segments using age, material, and soil data. Start a free trial to see a continuous scoring model built around your own system.
Which pipe materials fail most often?+
Cast iron and asbestos cement pipe show the highest break rates of any common material, especially once past 50 years old, while PVC consistently shows the lowest. Material alone isn't the full picture — soil corrosivity and diameter shift the risk further.
Can condition assessment data actually reduce break costs?+
Yes. Ranking segments by likelihood and consequence of failure directs limited replacement budget to the pipe most likely to break next, rather than the pipe that simply happens to be oldest on paper.
How does Oxmaint fit into an existing GIS or asset management system?+
Oxmaint layers on top of your existing pipe inventory and inspection records to generate a risk score per segment without replacing your GIS. Book a demo to see it mapped against your own service area.
Buried Asset Intelligence — Oxmaint

Stop Finding Out About Pipe Failure From a Flooded Intersection

Oxmaint turns pipe age, material, soil data, and inspection history into a single, continuously updated risk score for every buried segment in your system — so your next replacement dollar goes exactly where it needs to.
Share This Story, Choose Your Platform!