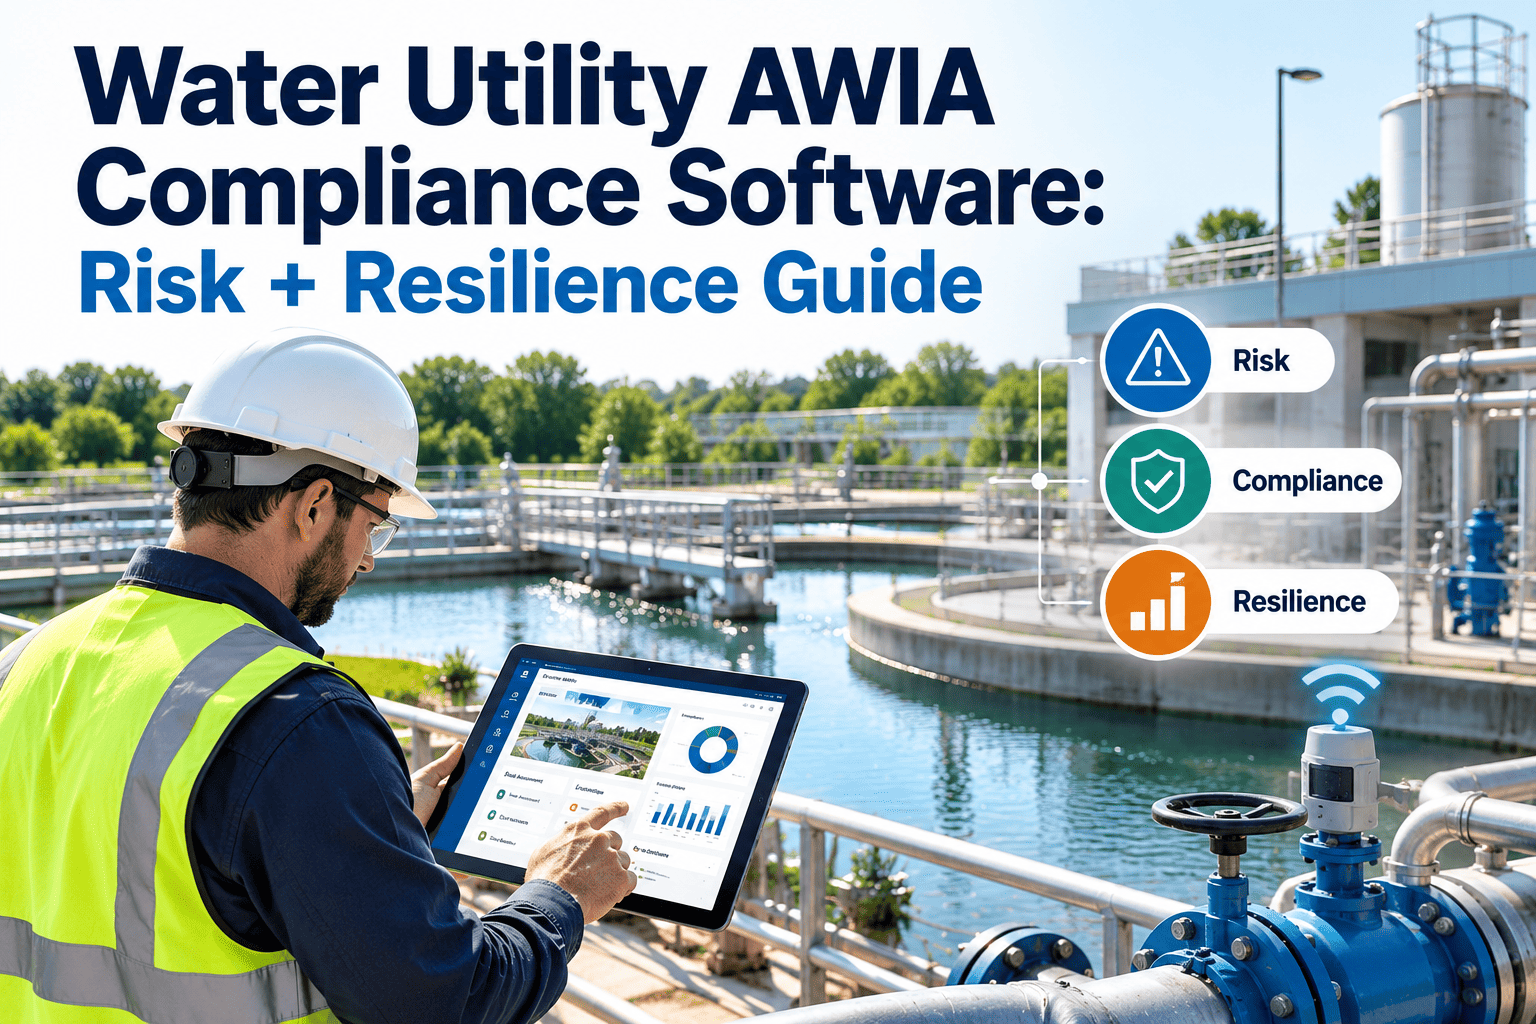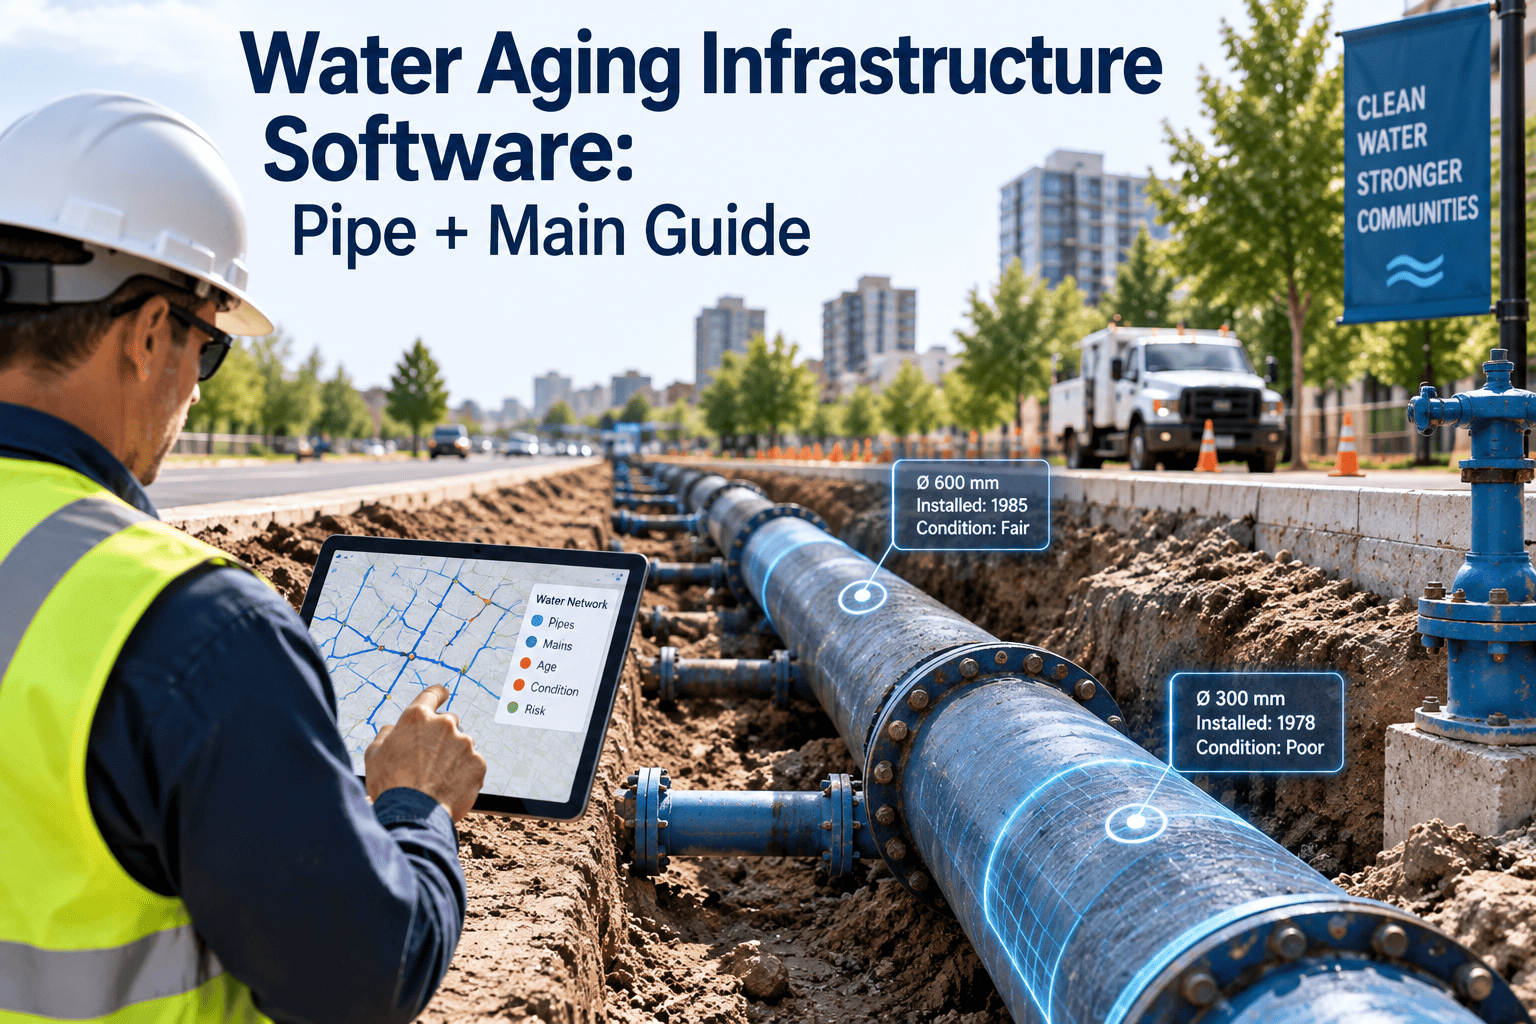
Every water utility is quietly managing two assets at the same time — the water moving through the system, and the pipe network slowly moving toward the end of its service life. Most utilities can report how many miles of main they operate, but far fewer can say which segments are approaching failure, which material class is driving the highest break rate, or which street is one hard freeze away from an emergency shutoff. Aging infrastructure risk rarely announces itself with one dramatic failure — it builds quietly across decades of buried cast iron, unlined ductile pipe, and asbestos cement main that nobody has physically inspected since the day it went into the ground. Requirements under the America's Water Infrastructure Act now expect utilities to formally assess that risk instead of managing it through institutional memory and retiring engineers. OxMaint gives utilities a structured way to track pipe age, material, and break history in one connected system, replacing paper maps and a supervisor's personal notebook.
Turn Decades of Pipe Records Into a Real Risk Register
OxMaint tracks pipe age, material, coating, and every recorded break in one place, so risk scoring is based on real history instead of a rough estimate from the last capital plan.
What Actually Counts as Aging Infrastructure Data
Aging infrastructure data is not a single field on a spreadsheet — it is the combination of installation year, pipe material, diameter, soil condition, and every break or leak event tied to that specific segment over time. A utility that only tracks installation year knows roughly how old a pipe is, but not whether it has already failed twice this decade or whether it sits in corrosive soil that shortens its realistic lifespan. A record that lists material as simply "iron" without distinguishing cast iron from ductile iron, or lined from unlined, hides the exact detail that determines whether a segment is a decade away from replacement or already a liability.
Getting this granularity right matters because a shallow dataset produces a shallow risk score, and a shallow risk score either flags too many segments to act on or misses the ones quietly failing underground. The material class, the installation decade, the break history, and the criticality of what the pipe serves — a hospital, a school, a residential block — all need to sit in the same record before a risk number means anything to a capital planning team.
Why Pipe Age Tracking Beats a Static GIS Layer
Most utilities already have a GIS layer that shows where pipe is buried, and it is easy to assume that is enough. A GIS map is a snapshot of geography, not a living risk model — it tells a crew where to dig, but it does not tell a planning team which segment is statistically likely to fail next quarter. Two pipes can sit two blocks apart on the same map, installed the same year, and carry completely different risk profiles once break history, soil corrosivity, and material lining are factored in.
Comeback-style thinking applies here just as it does to a maintenance shop: a single break on a segment is a data point, but a second or third break on the same stretch of main within a short window is a pattern that a map alone will never surface. Tracking age and material alongside every repair event turns a static geography layer into a genuine early-warning system, one that ranks segments by real probability of failure rather than by how long it has simply been in the ground.
This distinction becomes especially important during budget season, when a planning team has to defend why one street gets a full main replacement while a nearby street only gets a valve upgrade. A ranked, data-backed list makes that conversation far easier to have with a city council or utility board than a map and an engineer's recollection of which streets have felt like trouble lately.
What Happens When Aging Infrastructure Goes Untracked
When pipe age and break history live in separate systems, or nowhere at all, the first real signal of a problem tends to be an emergency — a main break that floods a street, a boil-water notice that erodes public trust overnight, or a water quality complaint that traces back to a corroded unlined segment nobody flagged for replacement. Emergency repairs cost significantly more than planned ones, not just in materials and overtime labor, but in the traffic control, pavement restoration, and customer notification that come with an unplanned dig on a live main. None of that cost shows up in a capital plan until the break has already happened.
Untracked infrastructure also creates real exposure beyond the repair bill itself. Grant applications and state revolving fund requests increasingly expect documented risk data behind a requested capital project, not just an engineer's professional judgment that a segment is old. Insurance carriers and legal teams ask similar questions after a significant failure — whether the utility had visibility into the risk before it materialized. A consolidated record of age, material, and break history is the difference between answering that question with evidence and answering it with an apology.
A segment does not need to be old to be high risk, and it does not need multiple breaks to justify closer monitoring — age, material, and break count should always be scored together rather than any single factor deciding priority on its own. Reviewing this scale alongside actual field conditions keeps the model grounded in reality rather than theory.
Root Causes Behind Accelerated Pipe Deterioration
Not every old pipe is a high-risk pipe, and not every young pipe is safe. Deterioration accelerates for a small number of well-understood reasons, and knowing which one applies to a given segment changes whether the right response is monitoring, lining, or full replacement.
From Reactive Repairs to a Planned Replacement Cycle
Most utilities did not choose to run a reactive maintenance model — it happened gradually, as budgets tightened and inspection backlogs grew faster than crews could work through them. Once a risk register exists, the conversation with a capital planning team changes shape entirely. Instead of debating which anecdote of a recent break should drive next year's budget, the team can point to a ranked list of segments, each with a documented age, material, and failure history behind its position on that list.
The financial case is just as strong as the operational one. Planned replacement work can be bundled with other scheduled street or utility projects, spread evenly across budget cycles, and timed around grant funding windows. Reactive replacement, by contrast, arrives on its own schedule, usually during the worst possible week for a utility's operating budget, and almost always at a higher unit cost than the same work would have carried as part of a planned capital program.
See Every Segment Ranked by Real Failure Risk
OxMaint combines installation year, material, and every logged break into a single risk score per segment, so capital planning starts with evidence instead of a rough age-based guess.
Pipe Segment Risk — Sample Breakdown
Comparing segments side by side, rather than looking at a system-wide average age, is what actually surfaces which stretches of main need capital dollars first. A system-wide average of 38 years can hide a handful of segments that are functionally decades past a safe service life.
| Segment | Material | Install Year | Breaks (5-Yr) | Risk Level |
|---|---|---|---|---|
| Main 14 — Elm Street | Cast Iron, unlined | 1958 | 3 | High Risk |
| Main 22 — Harbor Road | Ductile Iron, lined | 1994 | 0 | Low Risk |
| Main 07 — Oak Avenue | Cast Iron, unlined | 1971 | 1 | Watch |
| Main 31 — River Bend | PVC | 2011 | 0 | Low Risk |
Building an AWIA-Ready Risk Assessment Workflow
A risk and resilience assessment is only useful if it can be repeated consistently every planning cycle, not rebuilt from scratch by whoever happens to hold the institutional knowledge that year. A structured workflow turns aging infrastructure data into a defensible, repeatable process rather than a one-time report.
We had the pipe age data, we just had it in four different formats across three departments. Once it was in one system with break history attached, our risk register basically built itself, and our AWIA assessment took a fraction of the time it used to.
Where This Fits Into an Existing GIS and Work Order Workflow
Utilities are not being asked to abandon the GIS platform they already rely on for field mapping, or the work order system crews already know how to use. The goal is to connect the two so that a break logged in the field automatically updates the risk profile of the segment it belongs to, instead of sitting in a closed work order that nobody revisits once the repair crew leaves the site. That single connection turns years of accumulated repair history into a live dataset rather than a filing cabinet of closed tickets.
For most utilities, the rollout starts small — a single pressure zone or a handful of known problem streets — before expanding system-wide. Field crews keep logging repairs the same way they always have, but each entry now feeds directly into the segment's age, material, and break record, so the risk register stays current without anyone having to manually update a spreadsheet after every job closes out.
Frequently Asked Questions
Track Pipe Age, Material, and Break History in One Connected System
OxMaint links every recorded break back to its segment automatically, so your next risk and resilience assessment starts with a ranked list instead of a blank spreadsheet.