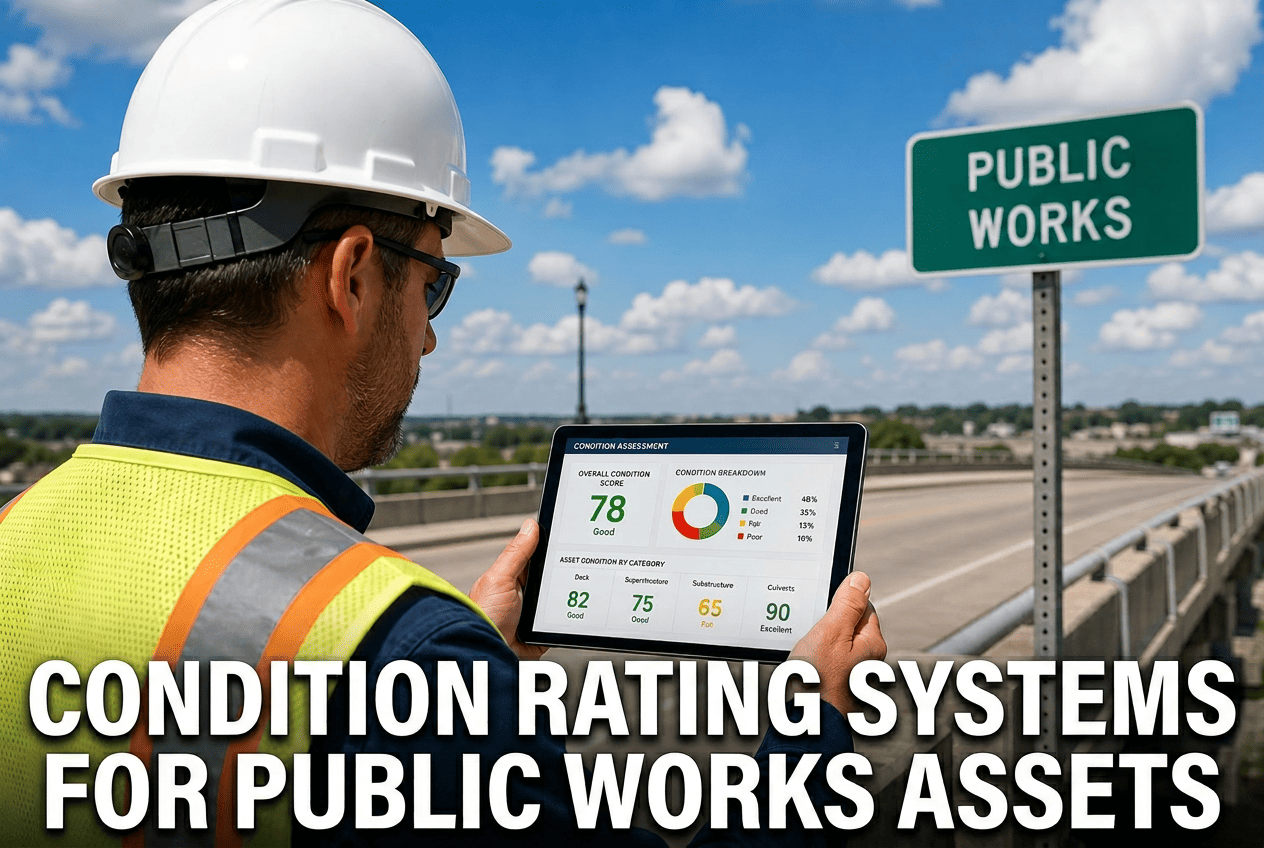
Ask three inspectors to rate the same retaining wall and you may get three different answers. That inconsistency makes capital plans harder to defend and leaves leaders with limited visibility into what is really deteriorating. Asset condition assessment fixes this by giving every asset class a common scale, clear definitions and a repeatable scoring routine. This guide lays out a practical 1-5 framework for roads, bridges, buildings and utilities, and shows how the scores connect to maintenance decisions. To see how these ratings can live next to your work orders, schedule a short walkthrough.
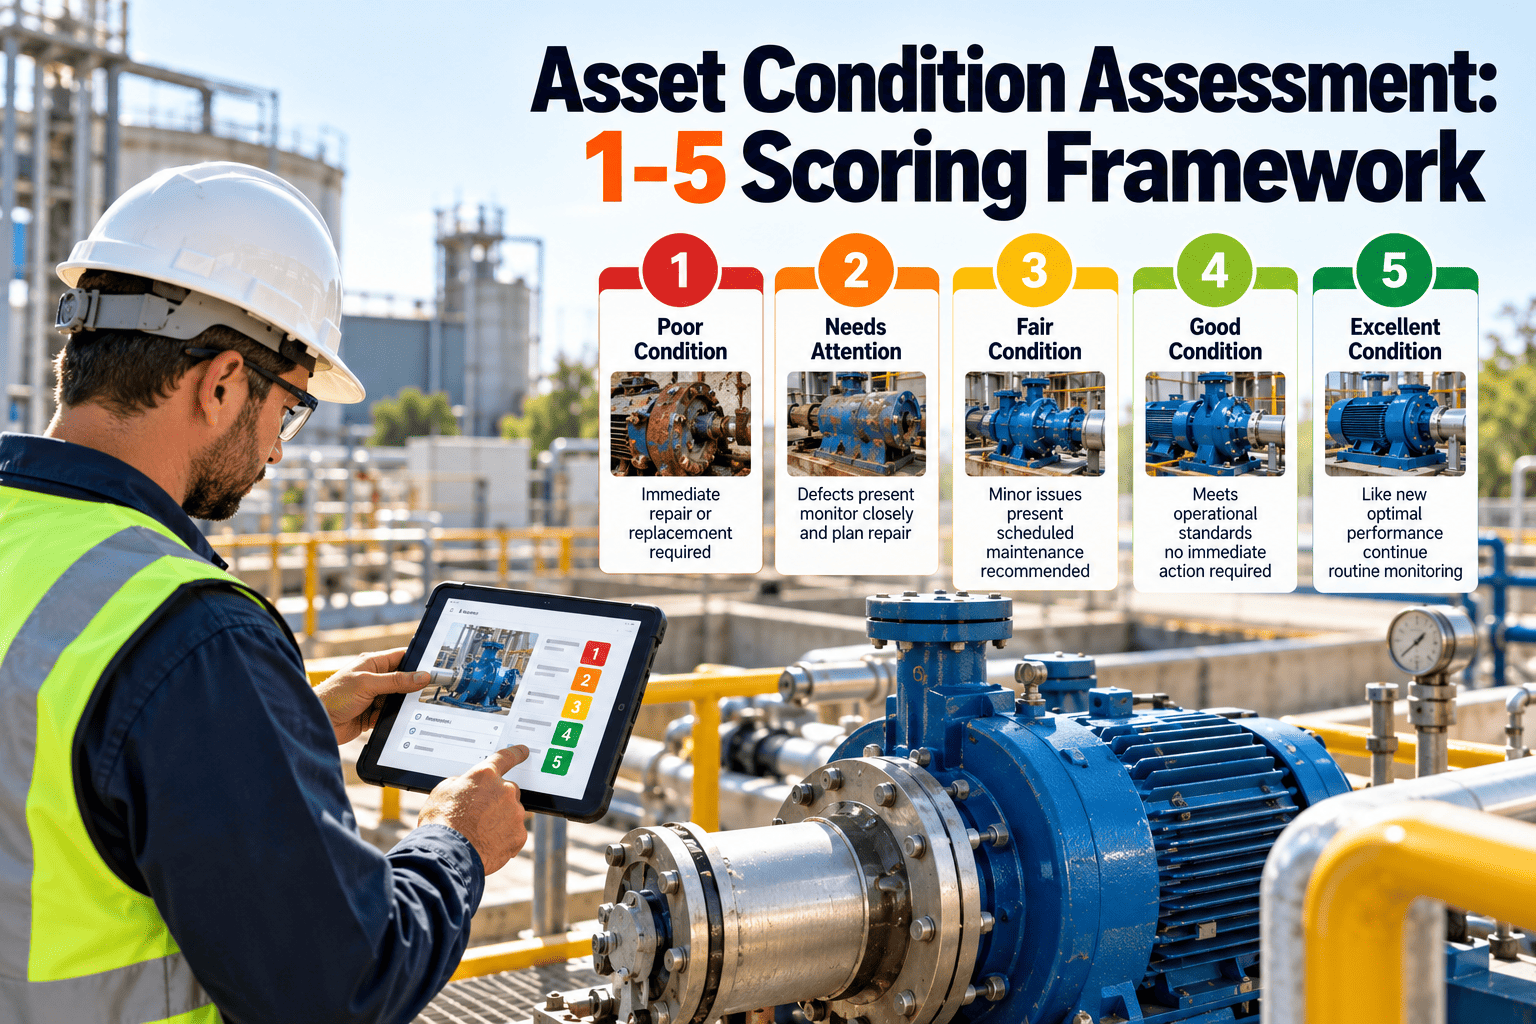
A 1-5 asset condition scoring framework that every inspector can apply the same way
Standardize condition ratings across public infrastructure so planning, budgeting and maintenance all work from one shared picture of asset health.
Why condition data becomes inconsistent and hard to trust
Most agencies do collect condition information. The trouble is that it is collected differently by each team, stored in different places and rarely tied back to the asset record.
| Symptom | Typical cause | Effect on decisions |
|---|---|---|
| Different scales by department | Roads use one index, buildings use letter grades, utilities use informal notes | Leaders cannot compare needs across asset classes |
| Subjective wording | Terms like "poor" or "needs work" with no written definition | Two raters reach different scores for the same defect |
| Stale ratings | Assessments done once for a grant or report, then filed away | Budgets are built on data that no longer reflects the asset |
| Scores stored apart from assets | Spreadsheets and PDFs that are not linked to the register | Work history and condition cannot be reviewed together |
| No link to action | A score exists but does not trigger a task, inspection or review | Deterioration is recorded but not acted on |
The 1-5 condition scale, defined in plain language
In this framework a lower score means a healthier asset. Some agencies reverse the direction, so whichever way you choose, write it down and apply it everywhere.
| Score | Label | General description | Typical response |
|---|---|---|---|
| 1 | Excellent | New or like-new. No visible defects and full expected function. | Routine preventive maintenance only |
| 2 | Good | Minor wear that does not affect performance. Normal aging. | Continue preventive tasks and monitor on cycle |
| 3 | Fair | Visible deterioration. Function intact but defects are spreading. | Targeted corrective work and shorter inspection cycle |
| 4 | Poor | Significant deterioration. Reliability, safety or service level at risk. | Major repair or rehabilitation planned and funded |
| 5 | Failed | Not performing its function, or unsafe to use. Unplanned failure likely or has occurred. | Immediate action, restriction or replacement |
What scores 1, 3 and 5 look like for each asset type
Anchor descriptions make the scale concrete. Build one short set for each class and keep photos of reference examples.
Roads and pavement
- 1
- Smooth surface, no cracking, markings intact.
- 3
- Moderate cracking, some patching, ride quality declining.
- 5
- Widespread failure, potholes, base exposed, safety hazard.
Bridges and culverts
- 1
- Sound structure, no section loss, joints and bearings working.
- 3
- Spalling, corrosion or scour beginning, watch items logged.
- 5
- Critical defects, load restriction or closure considered.
Buildings and facilities
- 1
- Systems operate as designed, envelope tight, finishes sound.
- 3
- Roof, HVAC or finish wear, frequent repairs, aging parts.
- 5
- Major system down, life safety or code concerns, unusable space.
Water, sewer and storm
- 1
- No leaks or blockages, inspection shows clean structure.
- 3
- Root intrusion, minor cracks, recurring cleaning needs.
- 5
- Collapse, major infiltration or repeated main breaks.
Rolling component scores into one asset condition index
Most assets are made of parts that age differently. Scoring the components and weighting them gives a more honest overall condition than a single glance.
- A
Break the asset into components
A building might be split into roof, structure, mechanical, electrical and interior.
- B
Score each component 1 to 5
Use the written anchors and attach photos to support each score.
- C
Apply weights
Give more weight to components with higher safety or replacement cost impact.
- D
Calculate the overall index
Multiply each score by its weight and add the results. Also keep the worst component score visible.
- E
Rank and plan
Sort assets by index and criticality to build the maintenance and capital list.
| Component | Weight | Score | Weighted |
|---|---|---|---|
| Roof | 30% | 4 | 1.2 |
| Structure | 30% | 2 | 0.6 |
| Mechanical | 25% | 3 | 0.75 |
| Interior | 15% | 2 | 0.3 |
| Overall index | 100% | 2.85 |
Combine condition with criticality to see real risk
A poor condition score on a low-use asset is not the same as a fair score on a critical one. Pair the two to rank your work.
| Condition score | Low criticality | Medium criticality | High criticality |
|---|---|---|---|
| 1 to 2 | Routine | Routine | Monitor |
| 3 | Monitor | Plan repair | Plan repair, shorten cycle |
| 4 | Plan repair | Fund rehabilitation | Priority funding |
| 5 | Replace or retire | Immediate action | Immediate action |
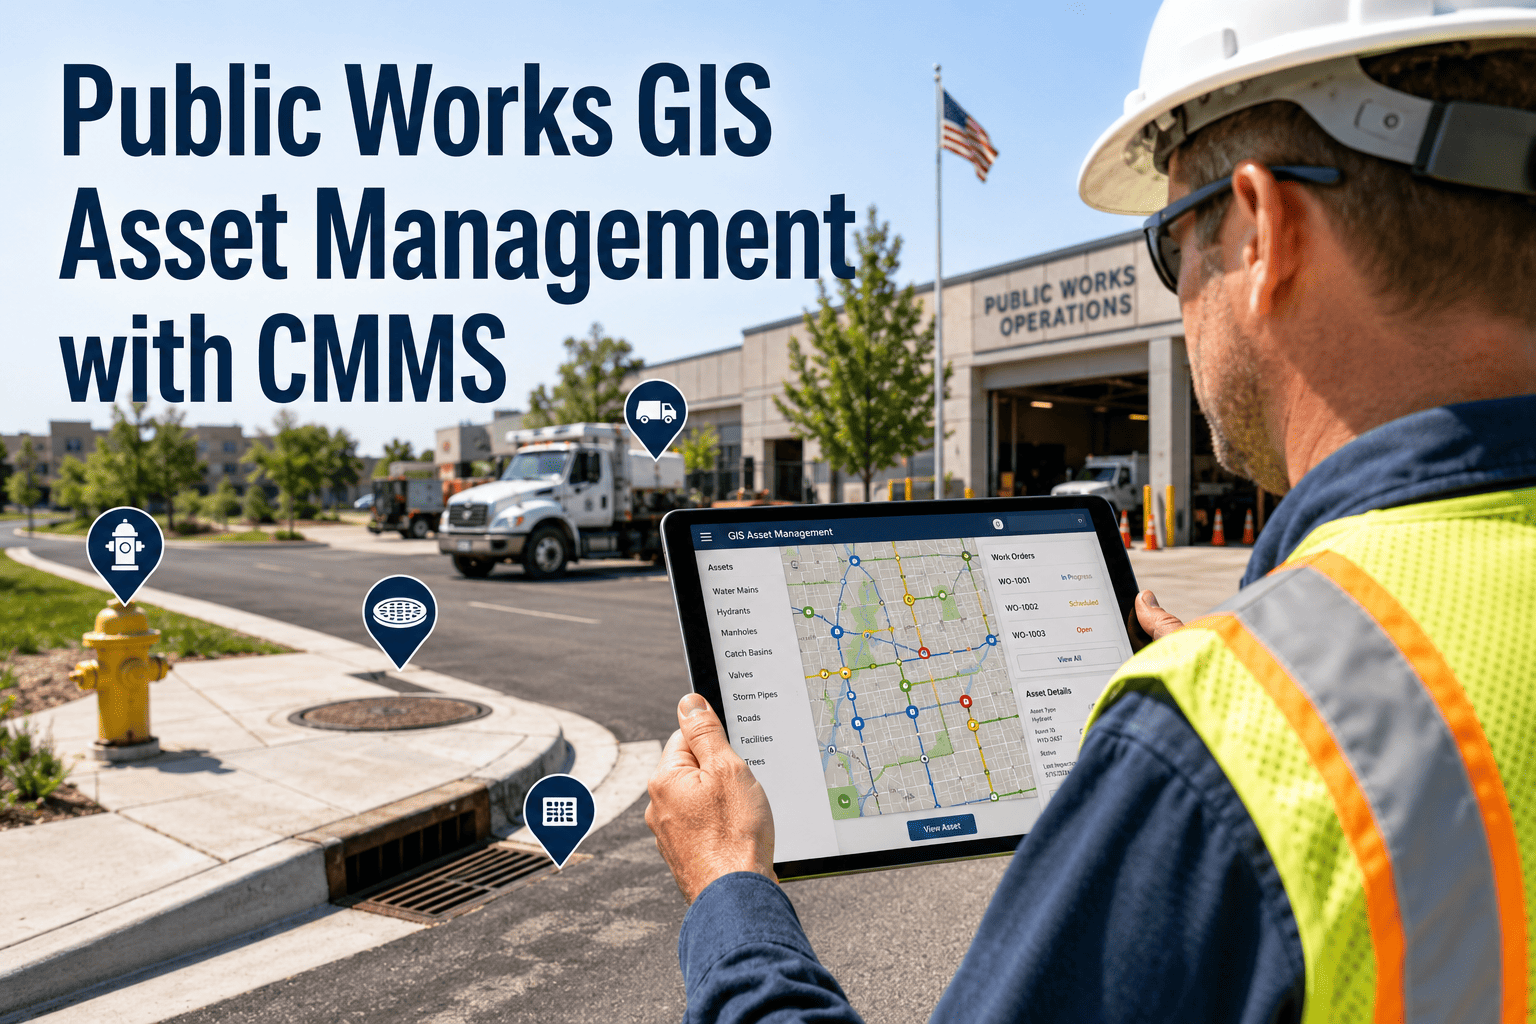
Keep every condition score attached to the asset it describes
See how ratings, photos and work history can sit in one asset record instead of scattered files.
How to keep different inspectors scoring the same way
A good scale still fails if raters interpret it differently. Treat calibration as a recurring routine, not a one-time training.
Before the season
- Publish written anchors with reference photos for each score
- Run a joint walk and score the same assets together
- Agree on how to treat items that fall between two scores
During inspections
- Use mobile forms with required fields and dropdown scores
- Require a photo for any score of 4 or 5
- Record the rater, date and the reason for the score
After collection
- Review a sample of scores from each rater
- Flag large jumps between cycles for re-inspection
- Update the anchors when disagreements reveal gaps
Connect each score to a maintenance response
A score has value only if it changes what happens next. Define triggers so the system proposes the right work automatically.
Why a common scale matters for audits, budgets and standards
Consistent condition data supports several formal needs that public agencies already face.
- Financial reporting: governments that use the modified approach under GASB Statement 34 must assess infrastructure condition and document results, so repeatable methods help.
- Asset management programs: frameworks such as ISO 55000 emphasize decisions based on asset condition, risk and lifecycle cost.
- Grant and funding requests: documented condition and repair history strengthens applications.
- Existing industry indexes: pavement condition index (PCI) and bridge condition ratings can be mapped to the 1-5 scale so specialist data is still used.
Metrics to report each year
Choosing the right method to gather the score
The 1-5 scale describes the result. How you collect the evidence behind each score depends on the asset, its risk and the budget you have. Most programs blend several methods rather than relying on one.
| Method | Best suited for | Limitations | Typical use |
|---|---|---|---|
| Visual inspection | Buildings, sidewalks, signs, parks, general site walks | Depends on rater skill and cannot see hidden defects | Primary method for most assets, repeated on a set cycle |
| Testing and measurement | Pavement roughness, concrete, pipe wall thickness, electrical equipment | Higher cost and specialist staff or contractors required | Confirm a visual score or investigate poor and failed assets |
| Camera and CCTV surveys | Sewer and storm pipes, culverts, tanks | Interpretation needs trained reviewers and a coding standard | Rank pipe segments before cleaning, lining or replacement |
| Condition monitoring | Pumps, motors, HVAC and other rotating or powered equipment | Needs baselines and clear thresholds to avoid false alarms | Feed readings into the score between formal inspections |
| Age and history review | Large populations where inspection is not yet affordable | Age is only a proxy and can hide problems or overstate them | Provisional score until a physical assessment can be done |
Setting inspection cycles by asset class and score
Not every asset needs the same attention. A shorter cycle for deteriorating or critical assets keeps scores current where it matters. The examples below are starting points only, so always follow any regulation or standard that applies to your assets.
Higher criticality assets
- Reassess more often, particularly once the score reaches 3 or worse
- Include structural elements, safety systems and critical mechanical equipment
- Combine visual checks with testing where failure would harm people or service
Lower criticality assets
- Use a longer cycle while scores remain 1 or 2
- Rely on routine crew observations to flag changes between formal reviews
- Shorten the cycle only when defects or complaints appear
Assets with fast deterioration
- Look at corrosive environments, heavy traffic loading and high-cycle equipment
- Track the change in score between cycles, not just the latest value
- Use the trend to decide when rehabilitation is cheaper than repeated repair
Assets with unknown condition
- Assign a provisional score from age and history and mark it as estimated
- Schedule a first physical assessment, starting with the highest criticality
- Replace the estimate with a verified score as inspections are completed
Mistakes that weaken a condition scoring program
Agencies that adopt a scale often hit the same obstacles. Knowing them early makes them easier to avoid.
- Scoring without written anchors: a scale with only the words good, fair and poor invites disagreement. Every score needs a description and a reference photo.
- Averaging away the problem: a single weak component, such as a failing roof or a corroded pipe section, can disappear inside a healthy-looking average. Report the worst component beside the index.
- Treating age as condition: an old asset can be in good shape, and a new one can be damaged. Use age to prioritize inspection, not to replace it.
- Collecting once and filing it: a score without a date and a reassessment cycle quickly becomes unreliable. Store the date, rater and method with every score.
- Keeping scores outside the asset record: when ratings live in a separate spreadsheet, nobody sees them while planning repairs or reviewing work history.
- Ignoring the link to funding: if condition scores never influence the budget conversation, crews stop trusting the process and quality drops.
A phased approach to rolling out the 1-5 framework
A pilot on one asset class is usually more effective than launching across every department at once.
Phase 1: Define
- Agree the direction of the scale and the five labels
- Write anchors for the first asset class with photos
- Choose components and weights for the index
- Decide which methods will feed the score
Phase 2: Pilot
- Load the asset register and set up mobile inspection forms
- Train raters and run a joint calibration walk
- Assess a sample of assets and compare rater results
- Adjust the anchors where raters disagreed
Phase 3: Scale
- Extend the framework to other asset classes
- Connect score triggers to work orders and reinspection
- Publish condition distribution and backlog reports
- Review the framework each year and update it
Condition reports that different audiences can actually use
The same scores serve very different readers. Build a few standard views so each group sees what it needs without a custom spreadsheet each time.
- Elected officials and executives: a one-page summary showing the share of assets at each score by class, the trend since the last cycle and the funding gap for scores of 4 and 5.
- Division managers: a ranked list of assets by index and criticality, with the repair or reassessment already planned for each.
- Supervisors and crews: a map or list of assets due for reassessment and open corrective work tied to recent poor scores.
- Finance and auditors: documented methods, assessment dates and the evidence behind each score, kept in a consistent format.
- Grant and planning staff: photo-supported condition history and repair records that can be pulled into an application quickly.
Using Oxmaint to run the scoring framework
Oxmaint maintenance management software gives the framework a working home.
- Asset management: hold the register, location, class and condition history for every asset.
- Inspections: use mobile checklists with required score fields and photo capture.
- Work orders: turn a poor score into a corrective or capital task with the inspection attached.
- Preventive maintenance and scheduling: set reinspection cycles by asset class and score.
- Reports and dashboards: show condition distribution and backlog for leadership.
Asset condition assessment questions
What is asset condition assessment?
It is the structured evaluation of an asset's physical state using a defined scale, so decisions rely on comparable data.
Why use a 1-5 scale?
Five levels are simple enough for crews to apply consistently while still showing meaningful differences in condition.
Can we keep PCI or bridge ratings?
Yes. Map specialist scores to the 1-5 scale for comparison. You can book a demo to see mapping options.
How often should assets be reassessed?
Set the cycle by asset class and criticality, shortening it as scores worsen or when regulations require specific intervals.
Where should scores be stored?
In the asset record, next to work history. You can sign up for Oxmaint to try this.
Turn inconsistent condition notes into a rating system leaders can use
Start with one asset class, build your anchors and see condition data connect to real maintenance work.