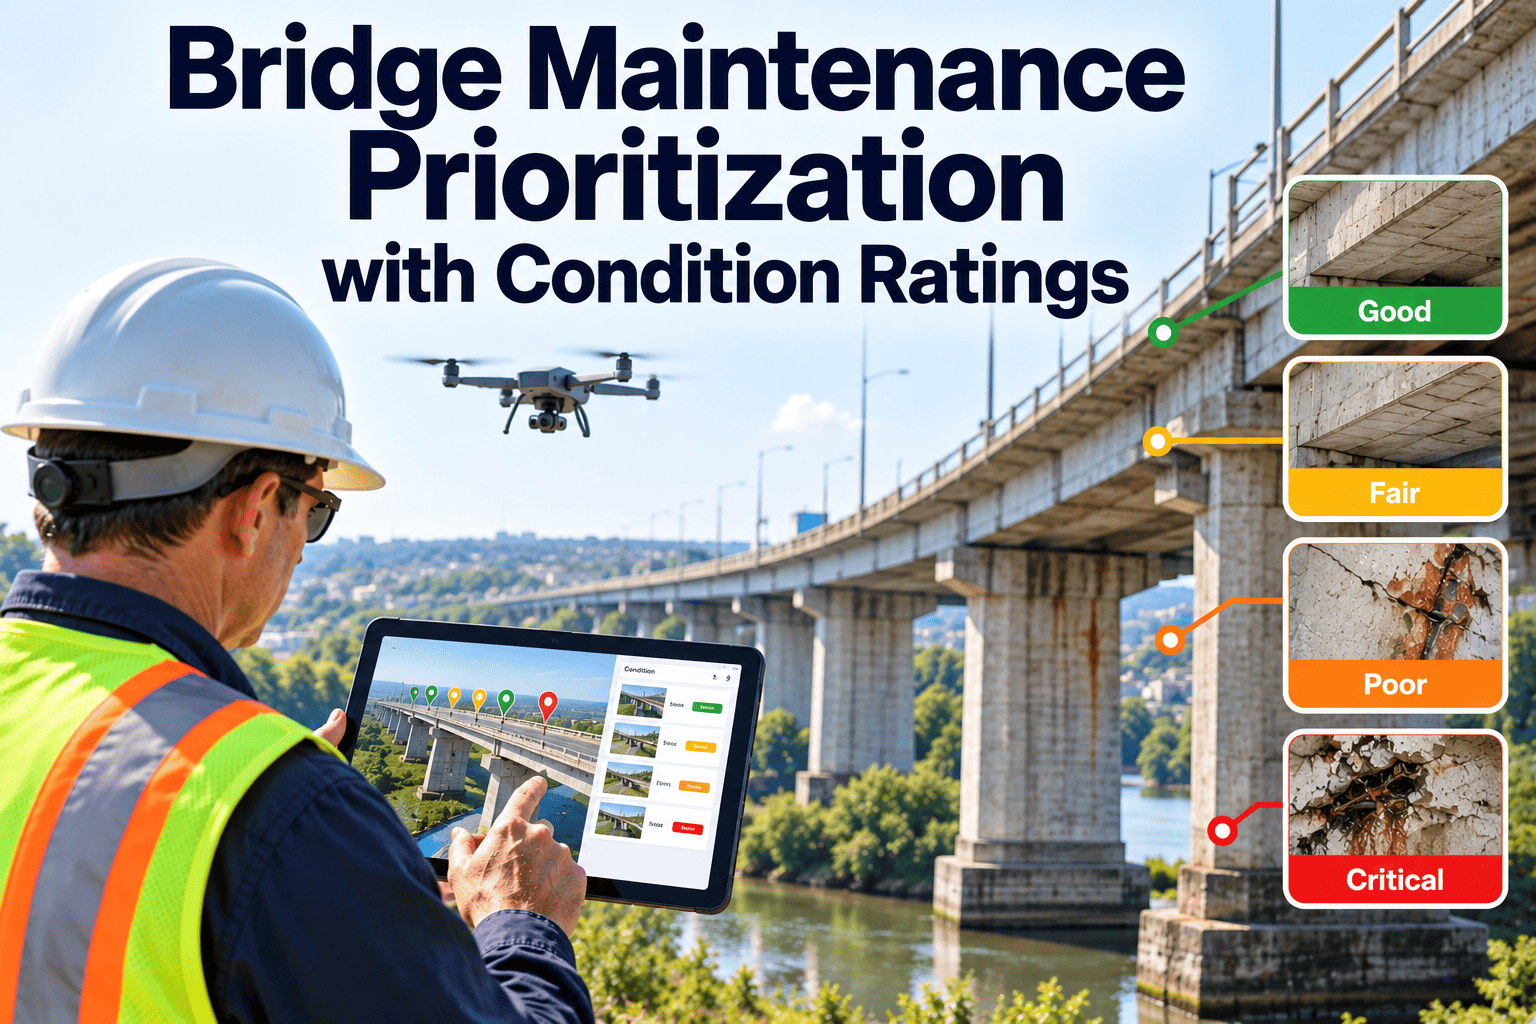
Every bridge owner has the same problem: more deficiencies than money. Inspections produce condition ratings, but ratings alone do not tell a crew which repair to schedule first. Without a clear method, small defects wait, corrective actions slip and the repair list becomes a record of delay. This guide explains how to turn bridge condition ratings into a ranked, defensible work plan that balances safety, traffic and budget, and how to track it in maintenance management software.
Bridge Maintenance Prioritization with Condition Ratings
Convert inspection findings into a ranked repair list. Weigh condition, safety risk, traffic exposure and funding so the right bridge gets the right work at the right time.
Why Bridge Repairs Get Delayed
Findings stay in the report
Inspection reports are filed as documents, so individual defects never become scheduled tasks with owners and dates.
Ratings look the same on paper
Two bridges with the same rating can carry very different traffic and risk, yet appear equal in a simple list.
Funding arrives in blocks
Capital and maintenance budgets follow separate cycles, and minor work loses to larger projects.
Follow-up is not verified
Repairs are done but not re-inspected or recorded against the original finding, so the next review starts from scratch.
Understanding Bridge Condition Ratings
- In the United States, bridges are rated on a 0 to 9 scale for the deck, superstructure and substructure, with culverts rated separately.
- Ratings of 7 to 9 are generally treated as good, 5 or 6 as fair, and 4 or below as poor.
- The lowest component rating typically drives the overall bridge classification, so one weak element can move a whole structure into the poor category.
- Poor does not mean unsafe. It means a bridge has deterioration serious enough to need planned rehabilitation or replacement.
Inspection cycles
- Routine inspections under the National Bridge Inspection Standards generally occur at intervals of up to 24 months, with shorter intervals for bridges that have specific concerns.
- Special inspections cover fracture-critical members, underwater elements and other items that need extra attention.
- Always confirm interval rules with current federal and state requirements, since they are updated over time.
Beyond the Rating: Factors That Rank a Bridge
| Factor | What to look at | Effect on priority |
|---|---|---|
| Component condition | Deck, superstructure, substructure and bearing ratings and notes | Lower ratings raise urgency |
| Safety-critical findings | Section loss, cracking in primary members, scour or settlement | Can override all other factors |
| Traffic exposure | Daily traffic, truck share, school or transit routes | Higher volume raises consequence |
| Detour and network role | Length of alternate route, emergency access, freight corridor | Long detours raise priority |
| Load posting and restrictions | Current limits and how often vehicles exceed them | Posted bridges need clear plans |
| Rate of deterioration | Change in ratings across recent inspections | Faster decline moves work earlier |
| Preservation opportunity | Sealing, joint repair, painting, drainage fixes | Low-cost work on fair bridges may extend life |
A Simple Risk Matrix for Ranking Work
Combine the likelihood of failure or further deterioration with the consequence of that happening. Rows show likelihood and columns show consequence. The grid turns that judgment into four action bands.
From Ranking to Action Tiers
- Immediate safety action. Close lanes, post restrictions or shore up members while a repair is designed. These items are escalated the same day.
- Near-term corrective repair. Fix defects on fair or poor bridges before they spread, such as spalls, bearing damage and failing joints.
- Preventive maintenance. Washing, sealing, drainage cleaning, joint maintenance and minor painting on bridges still in good or fair shape.
- Capital programming. Rehabilitation or replacement candidates move into the funded program with documented justification.
- Monitor and re-inspect. Stable conditions are logged, with targeted follow-up where change is expected.
Common Bridge Defects and Typical Responses
Match each finding to a response type so the work order starts with a sensible plan. Final repair methods always need engineering review.
| Defect | Why it matters | Typical response |
|---|---|---|
| Deck cracking and spalling | Allows water and chlorides to reach reinforcing steel | Seal cracks, patch spalls, plan overlay or deck repair |
| Failed expansion joints | Leaks onto bearings, girders and piers | Repair or replace joints, clean affected elements |
| Corroded steel members | Section loss reduces capacity | Clean, coat or reinforce, with load rating review |
| Bearing damage or misalignment | Restricts movement and loads members unevenly | Adjust or replace bearings under controlled conditions |
| Scour at foundations | Undermines piers and abutments | Install countermeasures and monitor after floods |
| Clogged drains and poor drainage | Keeps water on structural elements | Clean on a schedule, repair deficient drains |
| Approach settlement | Creates impact loads and rough rides | Repair approach slabs and subbase |
Why small items deserve attention
- Drainage, joints and coatings are inexpensive compared with structural repair, yet they decide how fast major elements deteriorate.
- Putting them on a recurring schedule keeps them from competing with larger projects for scarce funding.
Weather Events, Scour and Culverts
- Flood events can change foundation conditions quickly. Set a rule for post-flood inspections of scour-critical bridges and record the results as work orders.
- Culverts are often overlooked because they are small and hidden. Include them in the same ranking process, since blockage or collapse can close a road.
- Freeze-thaw cycles and de-icing salts increase the rate of deck and joint deterioration, so winter maintenance planning should include bridge washing in spring.
- Keep emergency contact lists and contractor arrangements ready for rapid response, with call-out records stored against the structure.
Building a Defensible Scoring Model
Scoring does not replace engineering judgment. It documents the logic behind a list so decisions can be explained to councils, boards and funding agencies.
Keep the model simple
- Use a small number of factors that staff can explain in one sentence each.
- Publish the weights internally so every bridge is scored the same way.
- Revisit the model each year using what the data and past decisions have shown.
Making the Case for Funding
- Show the backlog by action tier, not as one large number, so decision makers can see what is urgent, what is preventive and what belongs in capital programs.
- Present the consequences of deferral in operational terms, such as closure risk, detour length and posted weight limits.
- Separate maintenance funds from capital funds in reports so each request matches the budget it could come from.
- Where federal or state programs support bridge work, keep documentation ready, including inspection records, photographs, ratings and completed repair history.
- Track the results of funded work so the next request starts with evidence that earlier money improved conditions.
Data Quality Habits That Keep Rankings Reliable
A 90-day starting plan
- Days 1 to 30: load bridge assets and convert open inspection findings into work orders.
- Days 31 to 60: apply the scoring model, review results with engineers and set action tiers.
- Days 61 to 90: schedule preventive tasks, begin reporting backlog age and set a quarterly review.
Turn Inspection Findings Into Scheduled Bridge Work
Create work orders directly from findings, rank them and track each one until the repair is verified.
Preventive Work vs Waiting for Rehabilitation
Waiting until condition drops
- Small defects grow into structural repairs
- Emergency work disrupts traffic with little notice
- Capital costs rise and options narrow
- Water and de-icing salts keep working on exposed steel and concrete
Preserving while condition is fair
- Drainage, joints and coatings protect structural elements
- Work can be planned with traffic control in advance
- Service life is extended before major cost is triggered
- Crews build a repeatable cycle of inspection and care
The Defect-to-Closeout Loop
Metrics That Show Whether Prioritization Works
Practical tips
- Review the ranked list each quarter, not just after annual inspections.
- Document why a lower-ranked bridge was funded first so decisions are explainable.
- Keep photos tied to the original finding and the completed repair.
How Oxmaint Supports Bridge Maintenance Planning
- Asset management: register each bridge and its components with location, attributes and full repair history.
- Inspections: use mobile checklists to capture findings and photos in the field, and link them to follow-up work.
- Work orders and corrective maintenance: turn defects into assigned tasks with priority, due dates and costs.
- Preventive maintenance and scheduling: plan recurring washing, drainage, joint and coating tasks by season and traffic window.
- Dashboards and reporting: track open findings, aging backlog and completion rates for managers and funding bodies.
- Contractor coordination: assign outside work and keep verification and documentation in the same record.
Oxmaint complements dedicated bridge inspection and management systems by handling the work that follows each finding. It does not replace engineering judgment or required inspection procedures.
Who Does What in the Prioritization Process
| Role | Responsibility | Output |
|---|---|---|
| Bridge inspector | Rates components, documents defects and flags urgent findings | Inspection report with photos and ratings |
| Bridge engineer | Reviews findings, recommends repair methods and load rating actions | Technical recommendations and priorities |
| Maintenance supervisor | Converts approved work into schedules and crew or contractor assignments | Assigned work orders and planned windows |
| Program manager | Balances the ranked list with budget and funding rules | Funded work plan and backlog report |
| Executive or board | Approves funding and reviews outcomes | Budget decisions and performance review |
Scheduling Around Traffic and Seasons
- Bundle work on the same corridor so lane closures and traffic control setup serve several repairs at once.
- Reserve warm-weather windows for work that needs it, such as coatings, concrete repair and bearing work.
- Plan drainage cleaning and bridge washing before and after winter so salt and debris do not sit on structures.
- Coordinate with schools, transit and emergency services before closures, and record the plan in the work order.
- Keep a short list of ready-to-go repairs that can fill gaps when larger projects are delayed.
Mistakes That Keep Backlogs Growing
Patterns to avoid
- Ranking only by the lowest rating
- Leaving findings in the report with no work order
- Deferring preventive work every budget cycle
- Closing jobs without re-inspection
- Keeping inspection and maintenance data in separate files
Better habits
- Combine condition, consequence and trend
- Create a work order for each actionable finding
- Protect a preventive maintenance line in the budget
- Verify each repair and update the record
- Link inspection findings and repairs to one asset record
Preparing for Inspection Season
- Close or update old findings before new inspections begin, so inspectors see what was repaired and what remains open.
- Give inspectors the repair history for each bridge, including prior ratings, completed work and photographs.
- Confirm access, traffic control and equipment needs early, particularly for underwater or special inspections.
- After inspections, hold a review meeting within a few weeks to convert findings into ranked work orders while details are fresh.
- Compare new ratings with the previous cycle and investigate any bridge that dropped faster than expected.
Frequently Asked Questions
How do condition ratings help prioritize repairs?
They show structural condition by component, which is the starting point. Traffic, risk and funding then refine the order.
Should the lowest-rated bridge always come first?
Not always. A safety-critical finding or a high-consequence bridge can outrank a lower rating on a lightly used route.
Where does preventive maintenance fit?
It protects fair and good bridges before deterioration speeds up. Schedule it in Oxmaint alongside corrective work.
How do we keep track of deferred repairs?
Log each finding as a work order with a tier and target date, then report aging backlog regularly.
Can we see this on our own bridge data?
Yes. Book a demo and bring a sample of inspection findings.
Fix the Right Bridge First, and Prove It
Connect condition ratings, risk and repair work in one system so no inspection finding waits without an owner or a date.