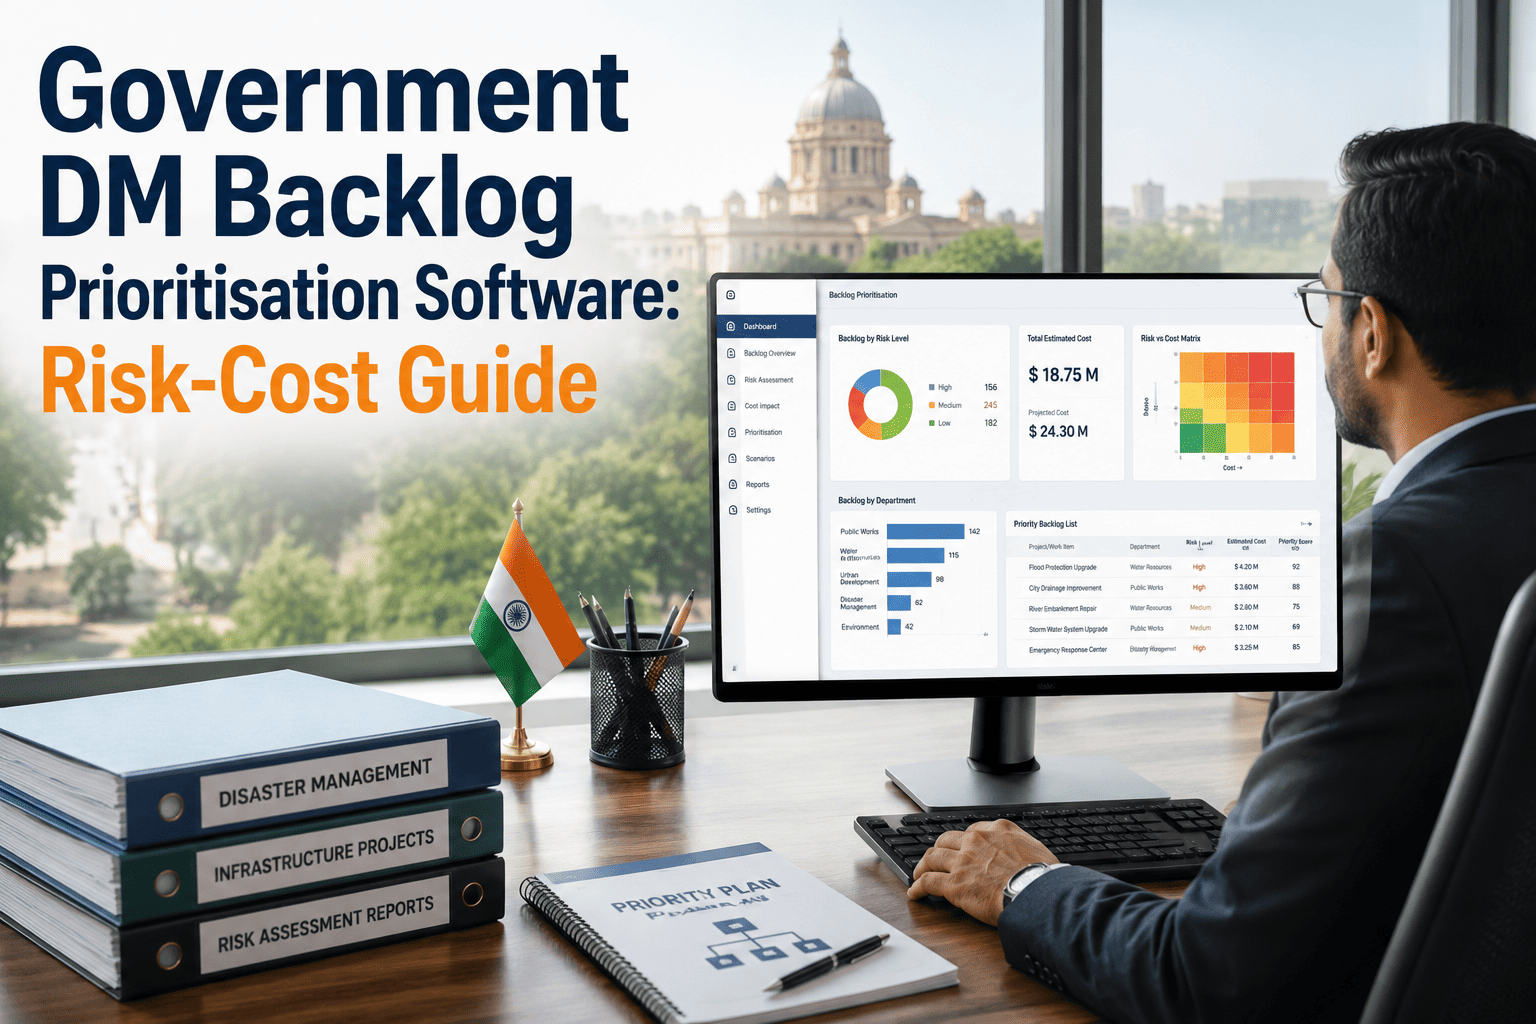
Public agencies across the United States are sitting on a combined deferred maintenance backlog that has crossed $370 billion, and the gap keeps widening every fiscal year. Most facility and fleet teams still work through that backlog the same way they did a decade ago: whoever complains loudest, or whichever building a council member visited last, gets funded first. That approach is not a prioritisation strategy — it is an absence of one, and it is a large part of why building condition was added to GAO's federal high-risk list. A defensible capital plan requires scoring every backlog item against the same risk and cost criteria, every time, so funding follows evidence instead of volume. See how a scoring engine like OxMaint replaces the spreadsheet-and-complaint queue with a ranked, audit-ready plan.
Public Sector CMMS · Deferred Maintenance · Risk-Cost Prioritisation
Government DM Backlog Prioritisation Software — Score Every Deferred Item by Risk, Cost, and Downstream Failure Impact
A finite capital budget and a growing repair queue is not a scheduling problem — it is a scoring problem. Here is the risk-cost framework agencies are using to rank backlogs by consequence, not by who asked first, and how OxMaint runs that framework automatically.
$370B
Combined DOD and federal civilian building deferred maintenance backlog, FY2024
$17B
GSA's own reported deferred maintenance backlog, named a top agency priority
22 Years
Consecutive years federal real property has stayed on GAO's High-Risk List
5 Factors
Scoring dimensions a defensible backlog prioritisation framework must weigh
The Scoring Framework
The Five Dimensions That Should Rank Every Item in Your DM Backlog
Complaint volume, political pressure, and whichever repair request landed on top of the pile are not risk indicators. A multi-factor scoring framework evaluates every deferred maintenance item across the same five dimensions, every time, so two facilities managers scoring the same backlog independently arrive at the same ranking. This is the same logic GAO's best-practice guidance for deferred maintenance and repair points toward — establish timeframes, run condition assessments more frequently where consequences are severe, and set measurable performance goals rather than reacting building by building. A framework that cannot be applied consistently by two different people is not really a framework, it is a preference, and preferences are exactly what auditors and legislators push back on hardest.
01
Life-Safety Impact
Fire protection systems, structural integrity, electrical hazards, and fall protection gaps sit at the top of every scoring model — these are the items that turn a maintenance delay into a liability event.
02
Regulatory Compliance Risk
Deferred items that could trigger a facility shutdown order, a code violation fine, or legal exposure carry weight independent of their raw repair cost.
03
Consequence of Continued Deferral
Some repairs get modestly more expensive with time. Others compound — a small roof leak deferred becomes structural decking replacement. Scoring has to capture that trajectory, not just today's cost.
04
Mission Criticality
An HVAC failure in an unoccupied storage building and the same failure in a courthouse or a public health clinic are not the same risk, even at identical repair cost.
05
Cost-Effectiveness of Timely Repair
Items where a repair today prevents an exponentially larger replacement later should outrank items with a flatter cost curve, even when the immediate dollar figure is smaller.
Backlog Scoring · Public Sector · OxMaint
Stop Ranking Your Backlog by Complaint Date
OxMaint scores every open work item on condition and criticality the moment it is logged, so your capital plan is ranked by risk before anyone has to argue for it in a budget meeting.
Facility Condition Index
Where Your Backlog Sits on the FCI Scale — and What It Means for Funding Priority
The Facility Condition Index expresses deferred maintenance cost as a ratio of current asset replacement value. It is the standard metric agencies, universities, and healthcare systems use to justify capital requests — but FCI alone only tells you how bad the problem is, not what to fix first.
Cost of Waiting
What Deferral Actually Does to Repair Cost Over Time
Repaired within Year 1
1.0x baseline cost
Deferred to Year 2–3
1.3x baseline cost
Deferred to Year 3–5
2.1x baseline cost
Deferred beyond Year 5
4x+ or full replacement
Illustrative Example
An $80,000 HVAC repair, deferred, becomes a $340,000 replacement
This is the argument that gets capital requests approved — a scored, dated cost trajectory next to the current repair estimate, not a maintenance team asking for money on faith.
How OxMaint Runs This
From Scored Backlog to Board-Ready Capital Plan, Without the Manual Compilation
The five-dimension framework only works if every item is scored the same way, every time, without depending on one analyst's memory of which building matters most. OxMaint runs the scoring, the cascade mapping, and the reporting as a continuous background process instead of a once-a-year scramble.
01
Automatic Risk-Cost Scoring
Every backlog item is scored on condition (1–5) and criticality — safety impact, operational impact, and compliance requirement — the moment it is logged, not months later at renewal or audit time.
02
Downstream Failure Mapping
A deferred pump or panel rarely fails alone. OxMaint tracks the connected systems a delayed repair puts at risk, so the ripple cost is visible before a funding decision, not after the outage.
03
Multi-Year Capital Forecasting
Predictive models project asset replacement needs by year, facility, and budget category, giving legislators and finance committees multi-year requirements with confidence intervals instead of a single lump number.
04
Audit-Ready Documentation
Every condition assessment, score, and capital decision is logged with a timestamp and approval trail, so audit preparation is a data export rather than a weeks-long reconstruction project.
Reported Outcomes
What Agencies Report After Moving to Risk-Cost Backlog Scoring
50%
Backlog Reduction in 18 Months
Reported by an agency that replaced complaint-driven funding with a documented risk-priority matrix across its facility portfolio.
2 Days
Audit Prep, Down from 6 Weeks
Once every score, assessment, and decision carries a timestamp and approval, compiling an audit package becomes an export rather than a reconstruction.
120
Facilities on One Scored Backlog
Real-time condition data across an entire multi-site portfolio, ranked on the same five-dimension criteria facility by facility.
8 Years
Backlog Growth Trend Reversed
The same agency reversed eight years of continuous backlog growth within eighteen months of full deployment.
Common Questions
Government Backlog Prioritisation — Questions Facility and Budget Teams Ask
What is the single most important factor in prioritising a government deferred maintenance backlog?
+
No single factor works alone — life-safety impact and regulatory compliance risk should always outrank cost, but cost-effectiveness determines sequencing within a risk tier. A framework that combines all five dimensions is what survives legislative review.
Start a free trial to see the scoring model applied to your own backlog.
How is the Facility Condition Index used alongside risk scoring?
+
FCI tells you how bad the overall problem is at a facility or asset-class level. Risk-cost scoring tells you which specific item inside that backlog to fund first. Agencies present both together in capital requests.
Book a demo to see a sample board report.
Can risk-cost scoring hold up better than complaint-based prioritisation under legislative scrutiny?
+
Yes — a documented, repeatable score with a timestamped assessment behind it is defensible in a way that "this building's council member called first" is not. Legislators and auditors consistently respond better to a ranked, evidenced backlog.
Try OxMaint free to build that documentation trail.
How often should a backlog item's risk score be recalculated?
+
Scores should update whenever a condition assessment is refreshed, after any related failure elsewhere in the facility, and at minimum annually ahead of budget season. Static, once-a-year scoring misses items that deteriorate faster than expected.
Book a demo to see automatic rescoring in action.
What data does an agency need before it can start risk-cost scoring its backlog?
+
A current asset inventory, a condition rating per asset, and a defined criticality tier per facility are the minimum starting inputs — the rest can be built as work orders and assessments accumulate.
Start free and import your existing inventory to begin scoring immediately.
OxMaint · Public Sector · Risk-Cost Backlog Scoring
Fund What Actually Puts Your Agency at Risk — Not What Got Loudest
OxMaint scores every deferred maintenance item on life-safety impact, compliance risk, deferral cost, mission criticality, and cost-effectiveness — automatically, continuously, and with a full audit trail behind every ranking. Build the capital plan that survives budget season on the first pass.