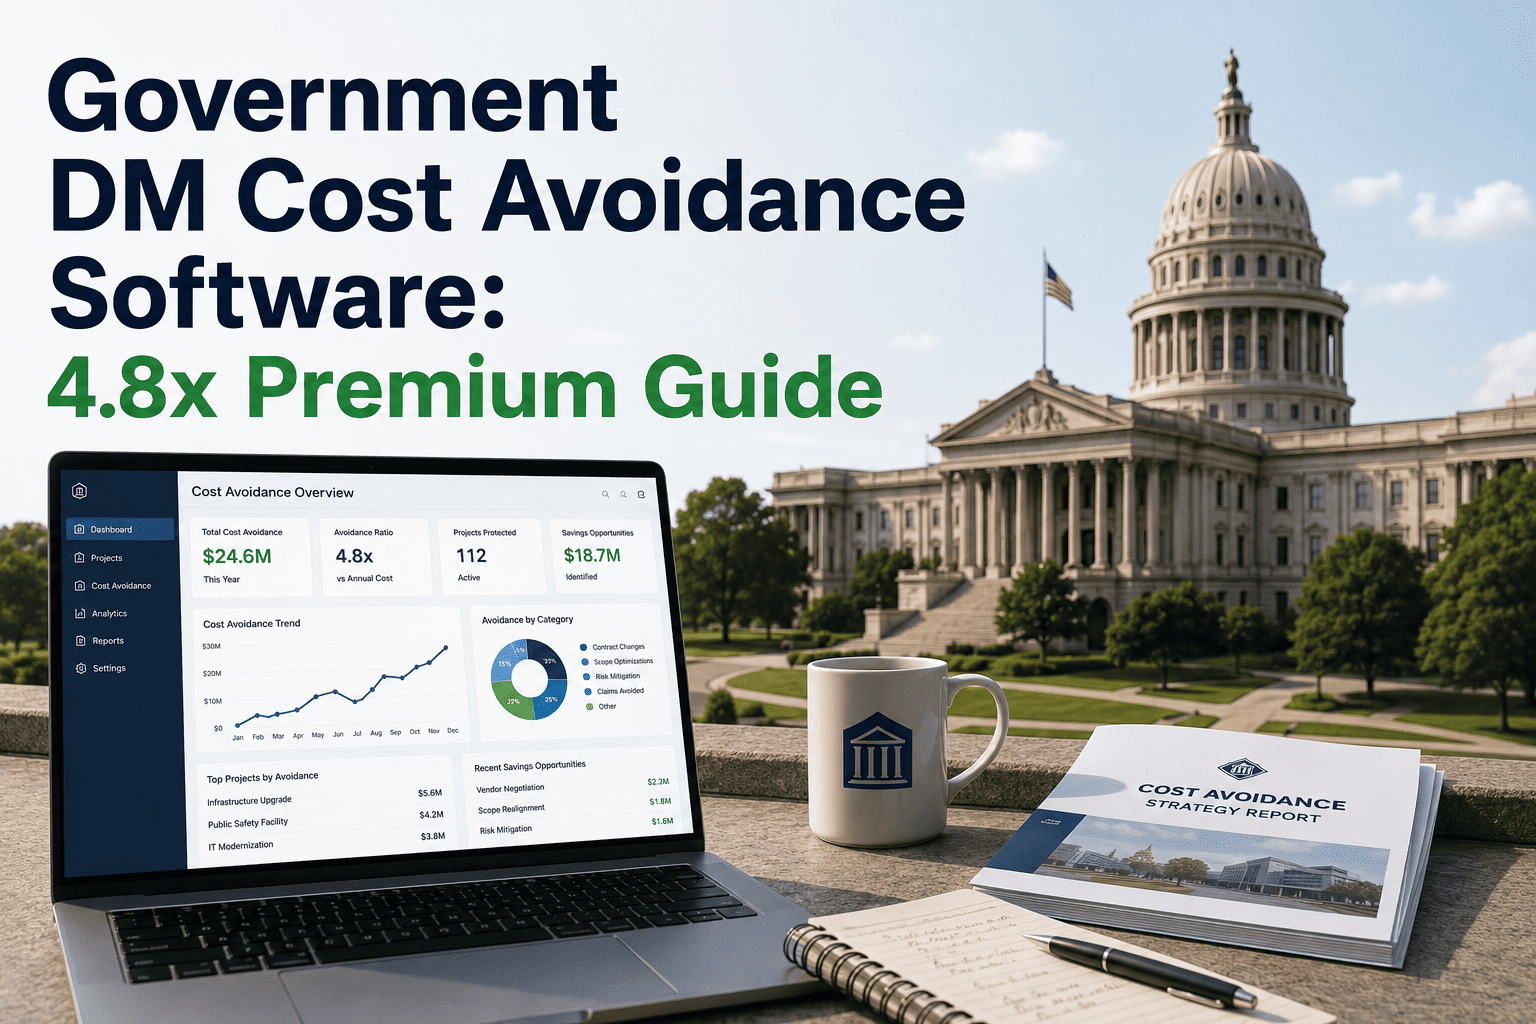
Government maintenance teams under budget pressure face a recurring question from finance leadership: how much did planned maintenance actually save this year? The honest answer usually lives nowhere, because emergency repair costs and planned maintenance costs sit in separate ledgers and nobody has calculated the gap between them. Industry benchmarking consistently shows unplanned emergency repairs costing three to nine times more than the same job done as scheduled maintenance, with public sector facilities commonly landing near a 4.8x premium once overtime labor, expedited parts freight, and downtime are added in. A report that shows this premium in dollars, asset by asset, is what turns a maintenance department from a line-item cost into a documented value generator the budget office can defend. Book a demo to see how OxMaint builds this report directly from your existing work order data.
Guide · Maintenance Finance · Cost Avoidance Reporting
Government DM Cost Avoidance Software: The 4.8x Premium Guide
A practical walkthrough of how to measure, document, and report the dollar gap between deferred-then-emergency repairs and planned maintenance — the single number that justifies every maintenance budget request.
4.8x
Average cost premium of an emergency repair over the equivalent planned maintenance job in public sector facilities
61%
Share of government maintenance budgets typically consumed by reactive, unplanned work orders
Why the 4.8x Premium Exists — and Why It Is Defensible to Finance
A planned repair and an emergency repair on the identical asset can differ in cost by a factor most finance directors have never seen quantified. The premium is not a rounded estimate for a slide deck — it is the sum of four measurable cost categories that a CMMS can capture on every single work order once labor, parts, and downtime are logged consistently.
Labor Premium
Overtime and Emergency Callout Rates
Emergency work frequently happens outside standard shift hours, triggering overtime, weekend, or contractor callout rates that can run 1.5x to 2x the standard labor rate for the same technician performing the same task during a scheduled window.
Parts Premium
Expedited Freight and Non-Stocked Parts
A planned job orders parts on standard lead time at standard freight cost. An emergency job pays rush shipping, sources from a secondary supplier at a markup, or substitutes a more expensive part because the correct one is not on the shelf.
Downtime Premium
Service Interruption and Secondary Damage
An asset that fails in service, rather than being taken offline for scheduled work, often causes secondary damage to adjacent systems and forces an unplanned closure of the facility, room, or service the asset supports.
Compliance Premium
Inspection, Documentation, and Penalty Exposure
Failures discovered during an emergency, rather than a scheduled inspection, can trigger unplanned regulatory notifications, additional inspection cycles, and in some asset classes exposure to compliance penalties tied to the failure itself.
The Cost Avoidance Formula: What to Track on Every Work Order
Cost avoidance reporting requires exactly one comparison, applied consistently: the actual cost of the emergency repair against the estimated cost of the same repair if it had been performed as planned maintenance. The table below shows the fields a CMMS needs on every closed work order to make that comparison defensible rather than anecdotal.
| Data Field |
Captured On |
Why It Matters to the Delta |
OxMaint Capture Point |
| Work order type |
Every work order |
Separates emergency/reactive from planned/PM at the record level so the comparison is automatic, not manually sorted |
Required field at work order creation — cannot be left blank |
| Actual labor hours and rate |
Work order closure |
Overtime and callout rates are logged against the actual hours worked, not estimated afterward |
Technician time logged in-app; rate pulled from labor category on file |
| Parts cost, actual vs. standard |
Parts issued to work order |
Expedited or substitute parts costs are compared against the catalog standard cost for the same part |
Inventory module flags cost variance above threshold automatically |
| Downtime duration |
Asset status change log |
Downtime hours multiplied by an agreed service-impact value produce a defensible downtime cost figure |
Asset status timestamps captured automatically from work order open/close events |
| Planned-equivalent estimate |
PM template library |
Every emergency work order is matched against the standard planned cost for that asset and failure type |
PM template cost baseline auto-suggested from asset history and category |
COST AVOIDANCE · OXMAINT · GOVERNMENT
Every Reactive Work Order Is a Number Finance Wants to See
OxMaint captures work order type, labor, parts, and downtime automatically, then calculates the planned-versus-emergency delta on every closed job — turning maintenance data into a cost avoidance report finance leadership can act on.
Building the Cost Avoidance Report: Four Steps to a Number the Budget Office Trusts
1
Establish Planned-Cost Baselines by Asset Category
Before any delta can be calculated, every major asset category needs a documented planned maintenance cost — labor hours at standard rate plus catalog parts cost for the most common preventive and corrective jobs on that asset type. Without this baseline, every future comparison is an estimate rather than a calculation.
2
Classify Every Work Order at Creation, Not Closure
Work order type — planned, reactive, or emergency — has to be set when the work order opens. Classifying retroactively at closeout introduces judgment calls and inconsistent categorization that undermine the credibility of the report months later.
3
Capture Actual Cost Against the Baseline on Every Closure
At closure, the system compares actual labor, parts, and downtime cost for the emergency job against the planned baseline for that asset category. This delta, multiplied across the full volume of reactive work in a reporting period, produces the total cost avoidance opportunity — the number that shows what proactive investment would have saved.
4
Report the Trend, Not Just the Snapshot
A single quarter's delta is informative. A twelve-month trend showing the delta narrowing as PM compliance improves is what secures next year's maintenance budget, because it demonstrates the return on the preventive maintenance investment in the agency's own numbers.
Expert Review
The 4.8x figure gets quoted constantly, but most agencies cannot point to their own number because the underlying data was never captured consistently. Work order type gets recorded inconsistently, planned-cost baselines do not exist for most asset categories, and downtime is rarely logged with enough precision to cost it accurately. The agencies that succeed with cost avoidance reporting are the ones that treat it as a data discipline built into daily work order closure, not a quarterly spreadsheet exercise assembled under deadline. Once that discipline is in place, the report essentially builds itself from the maintenance data the team was already generating.
Daniel Reyes, CMRP
Certified Maintenance and Reliability Professional · 15 years public sector maintenance operations and CMMS financial reporting
Frequently Asked Questions
Where does the 4.8x premium figure come from?
It reflects the combined labor overtime, expedited parts, and downtime cost gap commonly observed between emergency and planned repairs on comparable assets in public facilities. Your own number will vary by asset mix and labor structure —
start free to calculate it from your own work order history.
Do we need a full year of data before we can report cost avoidance?
No. A meaningful first report can be built from 90 days of consistently classified work orders once planned-cost baselines are set. The trend becomes more persuasive over subsequent quarters as more data accumulates.
How do we set a planned-cost baseline for an asset with no maintenance history?
Use the manufacturer's recommended PM interval and standard labor and parts cost for that asset class as a starting baseline, then refine it once several planned jobs have been completed and logged in the system.
Can this report be shared directly with a budget office or council?
Yes, provided the underlying data is captured consistently rather than estimated after the fact. A report built from logged labor, parts, and downtime figures withstands scrutiny in a way that a modeled estimate cannot.
Book a demo to see a sample cost avoidance report format.
Does reducing reactive work always reduce the total maintenance budget?
Not necessarily in year one, since planned maintenance itself has a cost. The value shows in the ratio shifting over time — a smaller share of the budget consumed by premium-priced emergency work and a larger share delivering planned, lower-cost outcomes.
COST AVOIDANCE · GOVERNMENT · OXMAINT
Turn Reactive Maintenance Cost Into a Number Finance Cannot Ignore
OxMaint captures work order type, labor, parts, and downtime on every job and calculates the emergency-versus-planned delta automatically — giving public sector maintenance teams the documented cost avoidance report that secures the next budget cycle.