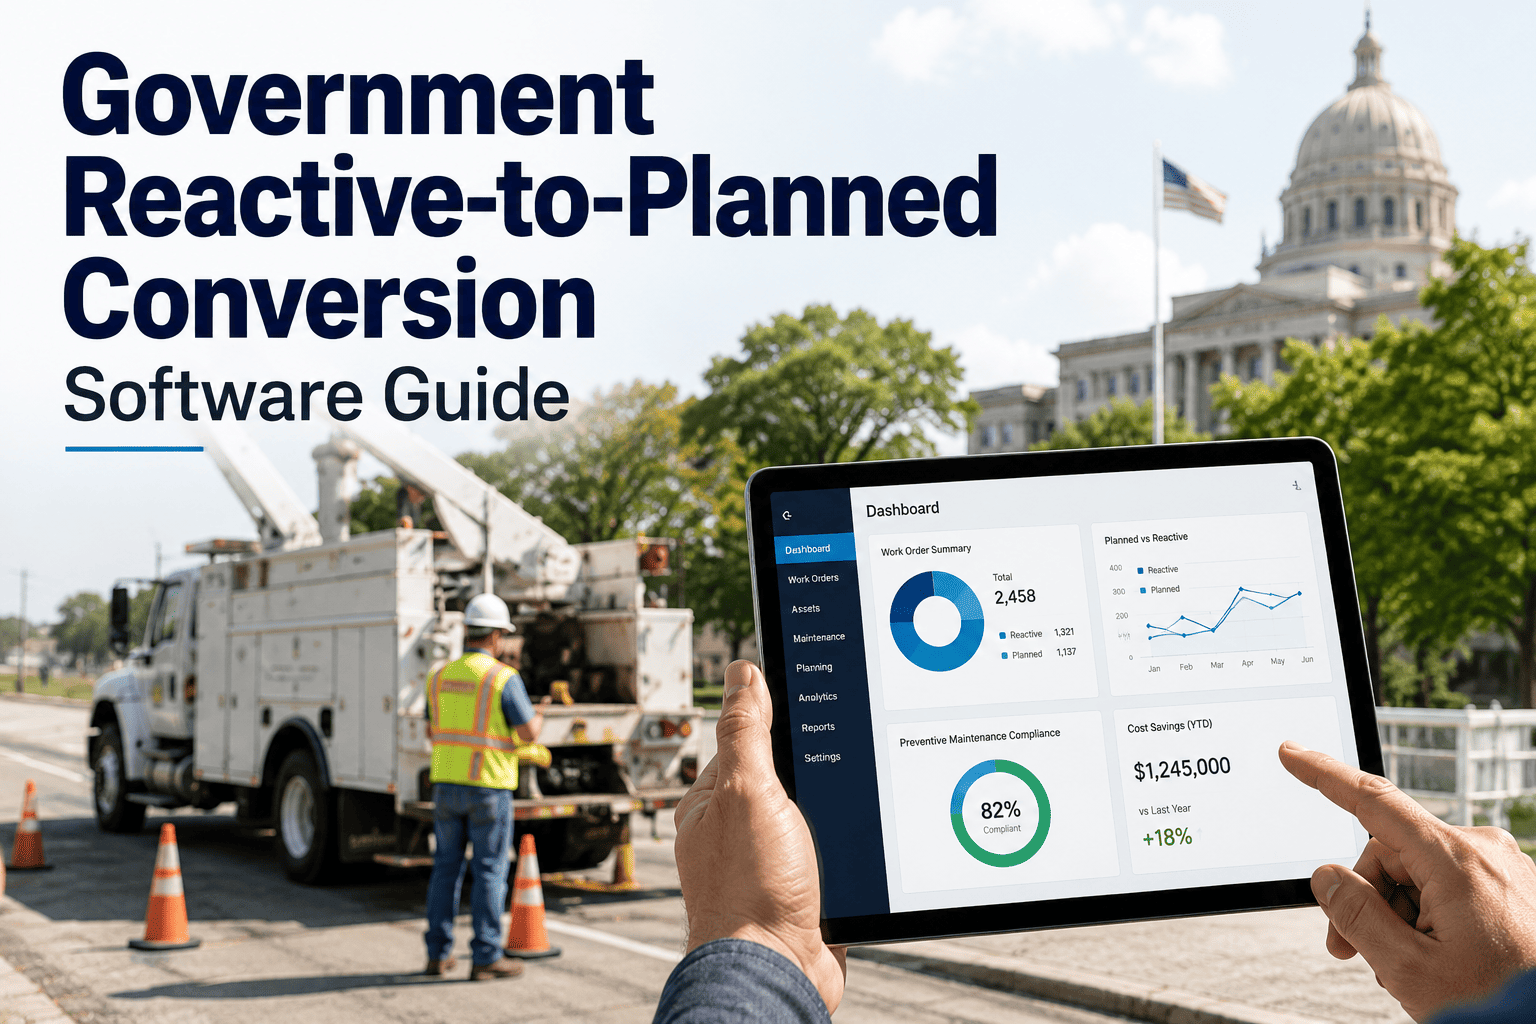
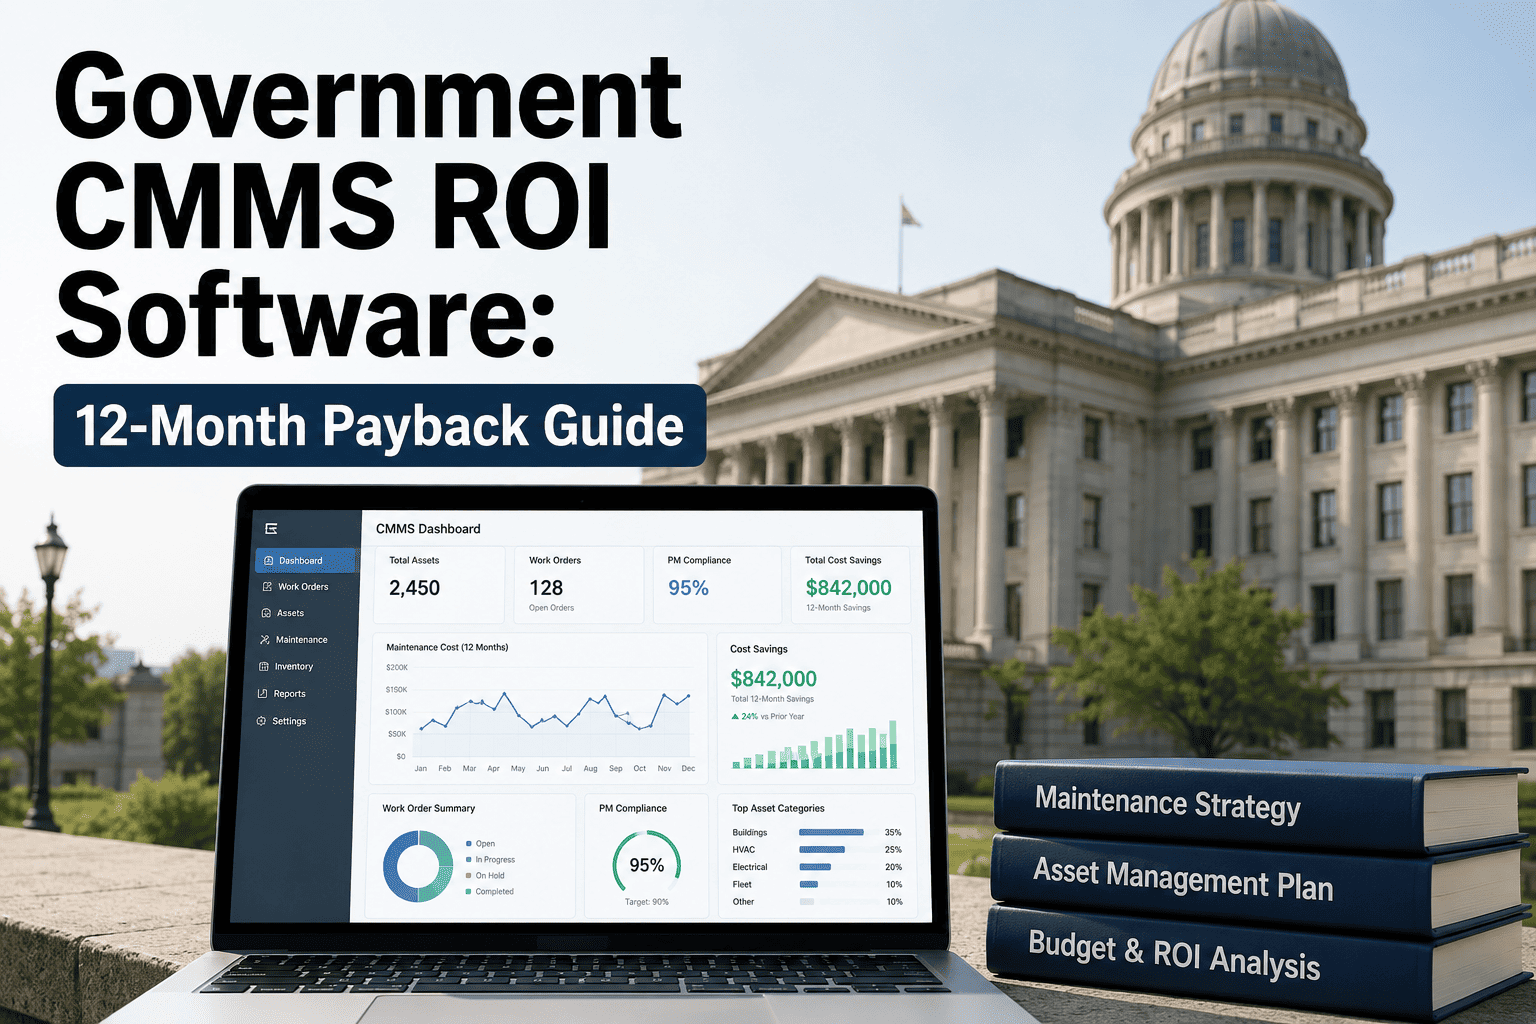
Every public agency runs two maintenance budgets — the one printed in the annual plan and the one that actually gets spent putting out fires. In most municipal, county, and state operations, more than half of every maintenance dollar is consumed by reactive emergency repairs that cost 4.8 times what the same job would have cost as planned work. That premium is not a small overrun. It is the single largest recoverable line item in most public works and facilities budgets, and it is the reason forward-thinking agencies are converting reactive work into planned maintenance using CMMS — closing the audit gap, extending asset life, and freeing crews from the overtime treadmill. Start free with Oxmaint to begin measuring your own reactive premium today.
The 4.8x Premium: What Reactive Really Costs Public Agencies
Before you can build a conversion program, you have to see the true cost of the current pattern. The invoices from emergency repairs almost always understate the damage because they leave out overtime, expedited freight, collateral wear, and the preventive work that never happened because the crew was chasing a failure. Here is what the numbers look like across a typical municipal operation in 2026.
52%
Budget consumed
Share of government maintenance spend going to reactive repairs today
4.8x
Cost premium
What emergency repairs cost versus the same job planned in advance
$1.2M
Annual waste
Reactive overspend in a typical mid-size municipal operation each year
80%
Planned target
Planned-work ratio leading public agencies achieve within 12 months
The gap between where most agencies sit today and where structured programs land is not a minor efficiency question. It is the difference between a department that spends its budget on emergencies and one that spends it on the assets residents actually care about.
Anatomy of a $2,400 Pump Repair That Should Have Cost $500
The 4.8x number becomes concrete when you break down a single work order. A lift-station pump that fails on a Friday afternoon does not just cost more parts — it triggers a cascade of premium charges that never appear on a planned job. Overtime rates kick in, freight goes expedited, a contractor gets called from home, and by the time the pump is running again the collateral damage to the motor housing has doubled the parts bill. Every layer below is money that a scheduled repair would have avoided, and every layer shows up in the same public works budget line that pays for road resurfacing and park upkeep.
$500
Standard-rate labor, weekday hours$180
Stocked replacement part$220
Ground shipping, standard lead time$40
Scheduled window, no overtime$60
No collateral damage$0
$2,400
Overtime labor at 1.5–2x rate$540
Whatever part is available now$430
Expedited freight, weekend$310
Contractor callout fee$480
Collateral damage to motor housing$640
Multiply that gap across a year of pumps, HVAC units, generators, transit vehicles, and building systems and the recoverable amount usually lands between $340,000 and $1.2M for a mid-size agency — money that comes directly out of the same fund that pays for the roads and parks residents actually see. The compounding effect matters even more than the single-event number: every emergency the crew handles is preventive work that did not get done, which seeds the next emergency, which pulls the crew off the next PM, and so on. Breaking that loop is the entire point of the conversion program.
Every reactive job you convert to planned work returns roughly $1,900 in avoided premium. Oxmaint tracks the conversion in real time so directors can prove savings in every budget hearing.
The Five Reasons Public Agencies Stay Trapped in Reactive Mode
Every director already knows planned maintenance is cheaper. The question is why the shift never sticks. In public sector operations, the barrier is almost never willingness — it is the structural gap between how work is dispatched today and how a conversion program actually runs. These are the five patterns that keep agencies stuck.
01
No unified asset register
Assets live across spreadsheets, PDFs, tribal knowledge, and legacy databases that nobody has fully reconciled. Without one register, you cannot schedule PMs against what you own.
02
Work orders start on paper
Citizen calls and inspection findings get written on tickets that never make it back to a database. Trends stay invisible, so PM triggers never fire and the same pump keeps failing.
03
PM ratio never gets measured
If nobody reports planned versus reactive share every month, there is nothing to bend. Directors cannot defend a conversion program in council if the baseline number does not exist.
04
Retirements walk out with the knowledge
Senior technicians carry the failure histories in their heads. When they retire, the institutional memory leaves with them and the next generation restarts the reactive cycle from zero.
05
Audits penalize the undocumented
State and federal auditors need dated, attached, work-order-linked records. Reactive work performed without documentation becomes an audit finding — and often a grant disqualification.
Reactive vs Planned: The Side-by-Side Public Agencies Need
Council members and finance directors do not always speak the language of maintenance. This is the comparison that turns a technical conversation into a budget conversation — every row is a place where the conversion program directly changes what taxpayers pay.
| Dimension |
Reactive maintenance |
Planned maintenance |
| Cost per repair |
4.8x baseline, with overtime and expedited parts |
Baseline standard-rate labor and stocked parts |
| Labor pattern |
Weekends, nights, callouts, contractor premiums |
Scheduled weekday windows, no overtime |
| Asset service life |
Shortened by 20–40% from cascading damage |
Extended 25–35% through consistent servicing |
| Compliance audit position |
Undocumented work becomes findings and fines |
Dated, attached, work-order-linked records |
| Grant eligibility |
Weak asset condition data disqualifies applications |
3–5x higher award rate with documented history |
| Citizen response time |
Days to first response as crews chase failures |
Hours through auto-routing and mobile dispatch |
| Budget defensibility |
Reactive spikes make budgets impossible to forecast |
Trended data justifies every line in council |
| Workforce continuity |
Retirements take institutional knowledge with them |
Documented histories preserve knowledge in system |
Every row above is measurable. The reason agencies choose a CMMS conversion program is that every row also becomes a defensible data point in the next capital budget hearing.
The Conversion Journey: From 52% Reactive to 20% in 12 Months
Reducing reactive share is a phased discipline, not a switch. Leading public agencies follow a repeatable arc that starts with visibility, moves through triggered PMs, and ends with predictive maintenance driven by condition data. Here is what the twelve-month curve looks like in practice.
Baseline and Register
Import every asset into one register — pumps, generators, HVAC units, fleet vehicles, buildings, linear infrastructure. Route every work order through the CMMS, from citizen calls to inspection findings to crew tickets. Establish the reactive baseline so the conversion is measurable from day one and every subsequent month carries a comparable number.
Reactive share52%
Triggered PMs Live
Attach PM schedules to the top 20% of assets responsible for 80% of failures. Automate the recurring work orders so they generate themselves on the right cadence. Load spare parts against each PM so the right kit arrives before the technician does, cutting out the mid-repair supply run that turns a two-hour job into a full afternoon.
Reactive share38%
Failure History Compounds
Twelve weeks of clean data lets directors identify the assets that keep breaking. PM intervals get tuned. Repeat-failure assets go on the capital replacement list with real evidence attached.
Reactive share27%
Condition-Based Triggers
Sensor and inspection data start generating condition-based work orders. Crews shift from calendar PMs to predictive intervention. Overtime falls. Audit packages generate themselves.
Reactive share20%
What Public Agencies Actually Recover
The conversion program returns value in four distinct buckets — direct cost savings, extended asset life, compliance protection, and grant leverage. Each one carries its own dollar figure that a director can bring to council. These are the numbers the leading public sector operators publish.
25–35%
Lifecycle cost reduction
Total lifecycle cost drops when reactive share falls from 52% to 20% — because emergency premiums vanish and assets last longer between replacements.
3–5x
Grant award rate
Federal and state grant applications backed by documented asset condition data are approved at three to five times the rate of undocumented submissions.
12–18 days
Earlier failure warning
Condition-based programs identify motor and pump degradation more than two weeks before failure — enough runway to schedule work during low-demand windows.
$241K
Annual documented savings
Typical mid-size municipal savings after a full year on a structured CMMS conversion program — before counting extended asset life or grant leverage.
How Oxmaint Runs the Conversion for Public Agencies
Oxmaint is built for the operational reality of government — spread-out assets, tight audit expectations, mixed crews, and budget cycles that reward evidence. Every feature below directly serves the reactive-to-planned conversion, not just general maintenance tracking.
01
Unified asset register in weeks
Import from spreadsheets, GIS layers, and legacy CMMS in one pass. Linear assets like roads and pipes sit alongside point assets like pump stations and treatment plants in the same register.
02
Automated PM triggers
Schedule PMs by time, meter reading, or condition threshold. Work orders generate themselves, assign to the right crew, and carry the parts list and safety procedure attached.
03
Mobile work order capture
Field crews close work on phones and tablets, attach photos and readings, and log labor time on the spot. Nothing lives on paper long enough to get lost.
04
Reactive vs planned dashboard
Directors see the conversion ratio live — by department, by asset class, by month. The number every council member wants to see is the one that renders on the home screen.
05
Audit-ready documentation
Every work order carries dated records, attached inspections, parts consumed, and technician sign-off. Audit packages export in the format state and federal reviewers expect.
06
Grant-ready condition reports
Asset condition trends and maintenance history export directly into the evidence packages that federal infrastructure grants require — the same data that lifts award rates 3–5x.
Public agencies deploying Oxmaint typically hit the 38% reactive milestone by month six. See what your own baseline looks like and how fast the curve bends for your assets.
What Changes for the People Actually Doing the Work
Conversion programs succeed or fail at the crew level. The point is not to add process — it is to remove the chaos that has crews driving across the county to fix things twice. Here is the shift every department experiences once the program takes hold.
Before
- Crews start each day with no clear plan — they wait for the phone to ring
- Half the shift is spent driving between emergencies across the jurisdiction
- Parts run out mid-repair and technicians drive back for stock
- Same three assets keep failing because nobody sees the pattern
- Overtime is expected, budgeted for, and permanent
- Retirements erase the failure history the department depended on
After
- Every crew starts the day with a routed schedule on their mobile device
- Work is clustered by location and asset — fewer miles, more wrench time
- Parts arrive with the work order because the PM carries the kit list
- Repeat-failure assets get flagged automatically for capital review
- Overtime falls as scheduled windows replace night and weekend callouts
- Institutional knowledge lives in the system, not in one person's head
Which Public Assets Return the Fastest Payback
Not every asset in a municipal register carries the same reactive premium. A conversion program that starts with the highest-cost failure modes returns visible savings inside the first quarter and gives directors an easy win to bring to council. Here is where public agencies typically find the fastest payback when they layer PMs onto their existing asset base.
A
Lift stations and pumps
Wet-well pumps are the number-one source of after-hours callouts in most public works departments. Vibration and runtime PMs cut failure rates within one quarter and eliminate the classic Friday-afternoon emergency.
B
Building HVAC systems
Courthouse, library, and administrative HVAC failures generate both cost premiums and public complaints. Compressor and air-handler PMs identify drift 10–15 days early, replacing weekend contractor calls with planned window work.
C
Fleet and transit vehicles
Municipal fleets are a natural PM target because mileage-based schedules are already familiar. Moving to a CMMS-driven schedule cuts breakdown recovery costs and extends vehicle service life by years.
D
Emergency generators
Standby generators at public safety and water facilities fail exactly when they are needed most. Load-bank tests and battery PMs move these assets out of the reactive column entirely and satisfy compliance requirements at the same time.
E
Water treatment instrumentation
Calibration lapses on instrumentation drive both compliance findings and unplanned shutdowns. Scheduled calibration PMs eliminate the audit exposure and prevent the cascading rework a missed reading triggers.
F
Roof and building envelope
Envelope failures are quiet until they are catastrophic. Twice-yearly inspection PMs catch flashing, sealant, and drain issues before a single storm converts a $1,500 patch into a $45,000 interior restoration.
The Budget Conversation That Actually Wins Approval
The reason most conversion programs stall in council is not skepticism about maintenance — it is the absence of a defensible number. Finance committees respond to specific, trended, comparable data. Oxmaint gives directors the exact evidence package that changes the conversation from "how much are you asking for" to "what will it cost us if we do not."
$$
Show the recovered premium as a specific dollar
Multiply your current reactive job count by the 4.8x premium and report the recoverable amount. "We are spending an extra $840,000 a year on emergency labor and freight" is a number every council member understands.
%
Report PM ratio every month
One number, one chart, every meeting. Watching the reactive share fall from 52% to 27% over nine months is more persuasive than any slide deck and turns the program into a visible council commitment.
Yr
Connect asset life to CapEx deferral
Every additional year of service life on a $1.2M generator or pump is a capital replacement deferred. Directors who translate PM investment into avoided CapEx get budget approval on the first pass, not the third.
$G
Bring the grant leverage into the pitch
Documented asset condition data lifts federal infrastructure grant approval rates 3–5x. The CMMS is not just a cost center — it is the evidence engine that unlocks capital funding from state and federal programs.
Frequently Asked Questions
What is the 4.8x reactive premium and where does the number come from?
It is the average multiplier that public sector reactive repairs cost versus the same job performed as planned work — documented across DOE studies and municipal CMMS benchmarks. A $500 planned pump repair typically runs $2,400 as an emergency.
Measure your own baseline free.
How long does it take to move a public agency from 52% to 20% reactive?
Typical timelines land at 12–18 months. Most agencies see reactive share drop to 38% by month six and 27% by month nine, with the last stretch driven by condition-based triggers rather than calendar PMs alone.
Does CMMS conversion really improve grant approval rates?
Yes — federal and state infrastructure grants approve applications backed by documented asset condition data at roughly 3–5x the rate of undocumented submissions. The maintenance history becomes the evidence base the grant reviewer needs.
What kinds of public agencies benefit most from this conversion?
Municipal public works, county facilities, state transportation depots, water and wastewater utilities, and federal building operations all show the same premium pattern. The larger and more distributed the asset base, the bigger the recoverable amount.
How does Oxmaint help with audits and compliance documentation?
Every work order carries dated records, attached inspections, parts, and technician sign-off. Audit packages export in the formats state and federal reviewers expect — closing the documentation gap that generates most findings.
Book a walkthrough to see the audit export live.
Stop paying the 4.8x premium every Friday afternoon
The reactive-to-planned conversion is the single largest recoverable expense in most public agency budgets. Oxmaint gives directors the register, the automated PMs, the dashboard, and the audit trail to bend the curve — and prove the savings in every budget hearing.