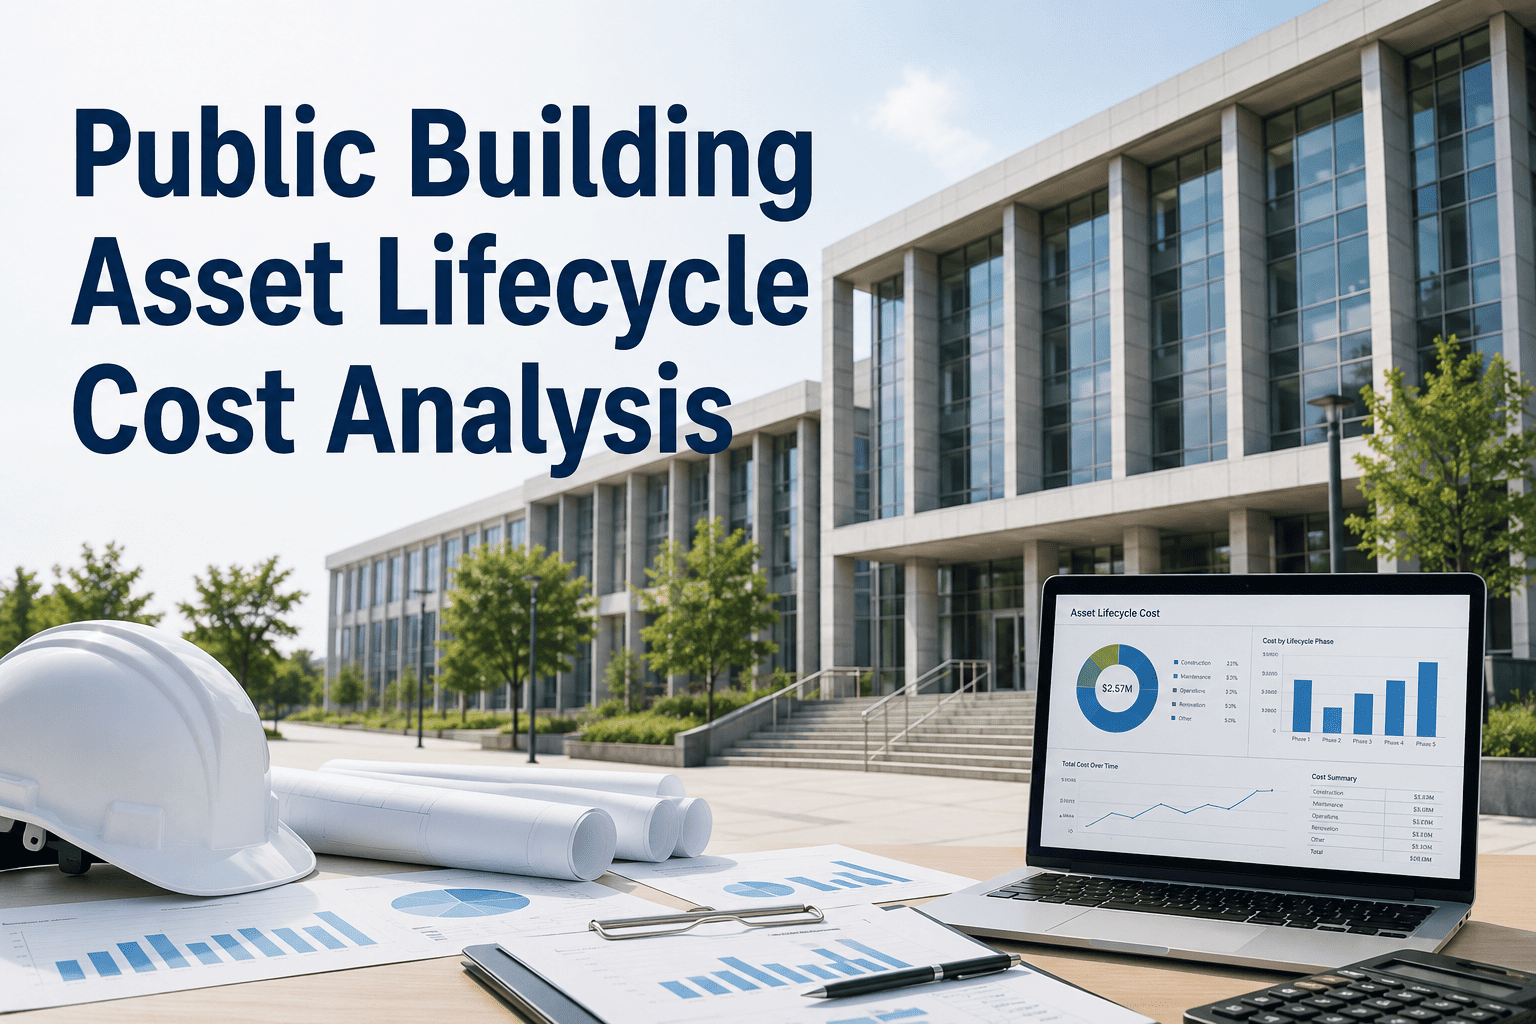
Government budgets are usually built around what an asset costs to buy or build, yet most of its real cost arrives afterward through energy, repairs, downtime, and eventual renewal. Lifecycle cost analysis puts those costs side by side so a council can compare options on total cost over time instead of price today. This guide explains the cost categories, formulas, and data inputs behind a sound repair-versus-replace decision for public infrastructure. It also shows how Oxmaint CMMS software supplies the maintenance history that makes the numbers believable.
Lifecycle Cost Analysis for Government Infrastructure
The cheapest option on the purchase order is often the most expensive option over thirty years. Lifecycle cost analysis shows the difference before the money is committed.
Why lifecycle cost analysis matters when budgets are tight
Limited budget visibility pushes agencies toward the lowest upfront cost. Lifecycle thinking corrects that bias with evidence.
Lifecycle cost categories to capture
A complete analysis follows an asset from decision to disposal. The right-hand column lists costs teams most often forget.
| Phase | Typical cost items | Often missed |
|---|---|---|
| Planning and design | Studies, engineering, permitting | Staff time and public engagement |
| Acquisition | Purchase or construction, installation, commissioning | Training, spares, and documentation |
| Operation | Energy, fuel, chemicals, operators | Efficiency decline as the asset ages |
| Maintenance | Preventive work, inspections, repairs, parts | Internal labor and overtime |
| Downtime and risk | Service interruption, emergency response, claims | Cost to residents and local business |
| Renewal | Rehabilitation, major overhauls, replacement | Temporary works and bypass pumping |
| Disposal | Demolition, hazardous material handling | Residual or salvage value |
The formulas behind lifecycle cost analysis
You do not need complex models to start. Three relationships cover most public sector comparisons.
- Use the same discount rate, analysis period, and price basis for every option.
- Equivalent annual cost helps compare options with different lives.
- Follow your finance office or funding program guidance for the discount rate.
A repair-versus-replace decision path
Work through these questions in order. Many decisions are settled before a full model is needed.
- Is the asset still safe and compliant?If not, act now. Safety and regulation override cost comparisons.
- Does it still meet the required level of service?If capacity or performance is short, repair alone may not solve it.
- What does the failure history show?Rising repeat repairs signal declining economic life.
- How much life will repair buy?Estimate extended years and the upkeep that follows.
- Which option has the lower annual cost and risk?Compare equivalent annual cost, then weigh non-financial factors.
Put real maintenance cost behind every capital request
Track labor, parts, and repeat failures against each asset so repair-or-replace proposals rest on records, not recollection.
Illustrative example: cheaper today, costlier per year
These numbers are hypothetical and simplified, with no discounting. They show why the lowest upfront price can mislead.
Option A: repair
- Upfront cost: $40,000
- Extra life gained: 3 years
- Annual upkeep afterward: $8,000
- Annualized cost: about $21,333
Option B: replace
- Upfront cost: $120,000
- Expected life: 20 years
- Annual upkeep: $3,000
- Annualized cost: about $9,000
- Option A is far cheaper to approve, but costs more each year of service.
- A full analysis would discount future costs and add risk and downtime.
- Replacement may be unaffordable immediately, so phasing and funding matter too.
Data inputs and where to find them
The quality of the analysis depends on the quality of the inputs. Most already exist in maintenance records.
| Input | Source | Quality check |
|---|---|---|
| Failure and repair history | Closed work orders by asset | Are failure causes recorded consistently? |
| Labor and parts cost | Work order time and material entries | Is internal labor charged at a true rate? |
| Energy and chemicals | Utility bills and operating logs | Can they be allocated to the asset? |
| Downtime | Operator logs and outage records | Is duration and impact captured? |
| Remaining useful life | Inspections, condition grades, manufacturer data | Is it based on condition, not only age? |
| Replacement cost | Recent bids, engineer estimates | Is the price year stated? |
| Discount and inflation rates | Finance office or funding program | Is one rate used for all options? |
Factors beyond the spreadsheet
Some of the most important costs are hard to price. List them anyway, so they inform the decision.
Safety and liability
Potential injury, claims, and regulatory findings if the asset fails.Service reliability
Disruption to residents, schools, hospitals, and businesses.Resilience and climate
Performance under heat, flooding, or storms the design did not anticipate.Efficiency gains
Lower energy or water losses from modern equipment.Common mistakes and fixes
Most flawed analyses fail for the same few reasons.
From analysis to a defensible capital plan
Lifecycle results are most useful when they feed a repeatable planning cycle.
- ScreenFlag assets with rising repair cost or poor condition.
- AnalyzeCompare options for the flagged assets.
- RankOrder projects by risk and lifecycle savings.
- FundPlace projects into the multi-year plan.
- VerifyCompare actual costs to the forecast and learn.
How Oxmaint supports lifecycle cost work
Oxmaint is maintenance management software. It records the operational costs and failure history that lifecycle analysis depends on.
- Asset cost historyLabor, parts, and contractor cost accumulate against each asset record.
- Work order failure dataCorrective work orders show repeat failures and repair frequency.
- Preventive schedulingPlanned work extends useful life and keeps routine cost visible.
- InspectionsCondition findings help estimate remaining life.
- Reports and dashboardsCompare cost across assets, classes, and departments.
- InventoryTrack spare parts consumption and cost.
Metrics that support lifecycle decisions
Review these during capital planning, alongside the analysis itself.
Annual maintenance cost per asset
Total maintenance cost ÷ number of assets in the classMaintenance cost ratio
Annual maintenance cost ÷ asset replacement valueRepeat failure rate
Assets with repeat repairs ÷ assets with repairsRemaining life share
Assets beyond expected life ÷ total assetsLifecycle cost analysis FAQs
Is lifecycle cost analysis only for large projects?
No. A simplified version suits routine decisions like pumps, vehicles, and roofs where repairs keep recurring.
What discount rate should we use?
Follow your finance office or funding program guidance and apply one rate to every option consistently.
Can we run it without good maintenance data?
You can estimate, but results are weaker. Start recording costs by asset to improve them.
How does this relate to asset management plans?
It informs lifecycle strategies and the financial plan, showing what each approach costs over time.
Where do we begin?
Pick assets with repeat repairs and gather their cost history. Book a demo to see how.
Lifecycle thinking by asset type
The cost drivers differ across public assets. Knowing them tells you which inputs deserve the most care.
- Water mains and pipesMaterial, soil, and break history drive cost. Repeated breaks add repair, water loss, and service disruption long before replacement is scheduled.
- Pumps and motorsEnergy often dominates lifetime cost. A more efficient replacement can pay back through lower power use even when repair is cheaper today.
- Roads and pavementsTimely preservation costs far less than reconstruction. Delaying treatment lets deterioration accelerate and pushes costs into the future.
- Buildings and HVACMaintenance, energy, and comfort complaints accumulate. Roofs and mechanical systems benefit from planned replacement before leaks and failures cause damage.
- Fleet vehiclesRepair cost, downtime, and resale value define the best replacement point. Track cost per mile or hour to find where it turns upward.
- Streetlights and signalsEfficient LED and controller upgrades can cut energy and call-out costs, so the analysis should include maintenance savings as well as power.
Choosing the analysis period and discount rate
These choices can change the answer, so decide them before comparing options and document why.
- Match the analysis period to the longest realistic asset life, or use equivalent annual cost when lives differ.
- Use your finance office's guidance or the rate required by a grant program, and apply one rate to every option.
- Decide whether to work in real dollars, which exclude inflation, or nominal dollars, and keep that choice consistent.
- Include residual value at the end of the period, such as salvage or remaining useful life, where it is meaningful.
- State whether costs are agency costs only or also include costs borne by residents, such as outage impact.
- Record every assumption in a short sheet, so a reviewer can rerun the analysis later.
Test how sensitive the answer is
Uncertainty is normal. Sensitivity testing shows whether it changes the decision.
Discount rate
Rerun with a higher and lower rate. Long-lived options are more sensitive to this choice.Remaining life
Vary the years that repair will buy. A short extension can reverse a repair decision.Failure frequency
Test fewer and more frequent repairs than history suggests, especially on aging assets.Energy and material prices
Check whether price swings would change which option comes out ahead.What to show council when presenting results
Decision makers need clarity more than complexity. Structure the briefing in this order.
- State the decisionSay plainly what is being compared, such as repairing the pump again or replacing it.
- Show cost today and over timePresent upfront cost beside lifecycle and annual equivalent cost so the contrast is clear.
- Explain the riskDescribe what happens if the asset fails, including safety, service, and regulatory effects.
- Show the sensitivityIndicate which assumptions matter and whether the conclusion holds across them.
- Recommend and commit to follow-upMake a recommendation and promise to compare actual costs to the forecast later.
Questions to ask about any lifecycle claim
Whether a vendor, consultant, or colleague presents the numbers, a few questions test their strength.
- What analysis period and discount rate were used, and were they the same for each option?
- Where did the failure and maintenance cost inputs come from, and do they match our own records?
- Does the estimate include internal labor, downtime, and disposal, or only purchase and parts?
- What happens to the result if remaining life is a few years shorter than assumed?
- Are energy savings and maintenance savings supported by measured data or only by brochure figures?
- Who will verify actual performance after installation, and how will it be recorded?
Worked discounting illustration
These are hypothetical figures at a 4% discount rate, to show how the two formulas behave. Use your own rate and costs.
Present value of a future repair
- A $10,000 repair expected in 5 years
- Discount factor: 1.04 to the power of 5
- Present value: about $8,219
Equivalent annual cost
- A $120,000 asset with a 20-year life
- Annuity factor at 4% over 20 years: about 0.0736
- Equivalent annual cost: about $8,830
- The equivalent annual cost above covers the capital only. Add yearly upkeep to compare it with other options.
- Discounting makes later costs count for less, which is why timing matters when comparing options.
The hidden cost of deferred maintenance
Deferral looks free in the year it happens. Lifecycle analysis makes the later cost visible.
- Small defects grow. A crack sealed now may become a pothole, then a base failure that needs reconstruction.
- Wear accelerates. Equipment run without lubrication or alignment checks fails sooner and more expensively.
- Emergency repair costs more. Overtime, rush parts, and temporary measures replace planned, efficient work.
- Service quality drops. Outages and complaints carry costs that never show on a repair invoice.
- Risk transfers to the future. Each deferred decision leaves the next budget cycle with a bigger problem and fewer options.
- Backlog becomes a liability. A large unfunded backlog affects credit conversations, grant applications, and public trust.
Building a data pipeline for lifecycle decisions
You will make better decisions if data is collected as a by-product of daily work, not assembled in a rush before each budget.
- IdentifyGive every asset a unique ID and parent.
- CaptureRecord labor, parts, and cause on each work order.
- InspectGrade condition on a regular schedule.
- SummarizeRoll cost up by asset, class, and year.
- ReviewCompare against thresholds before each budget.
Make every repair-or-replace case evidence-based
Capture maintenance cost and failure history where the work happens, and bring clear numbers to every budget discussion.