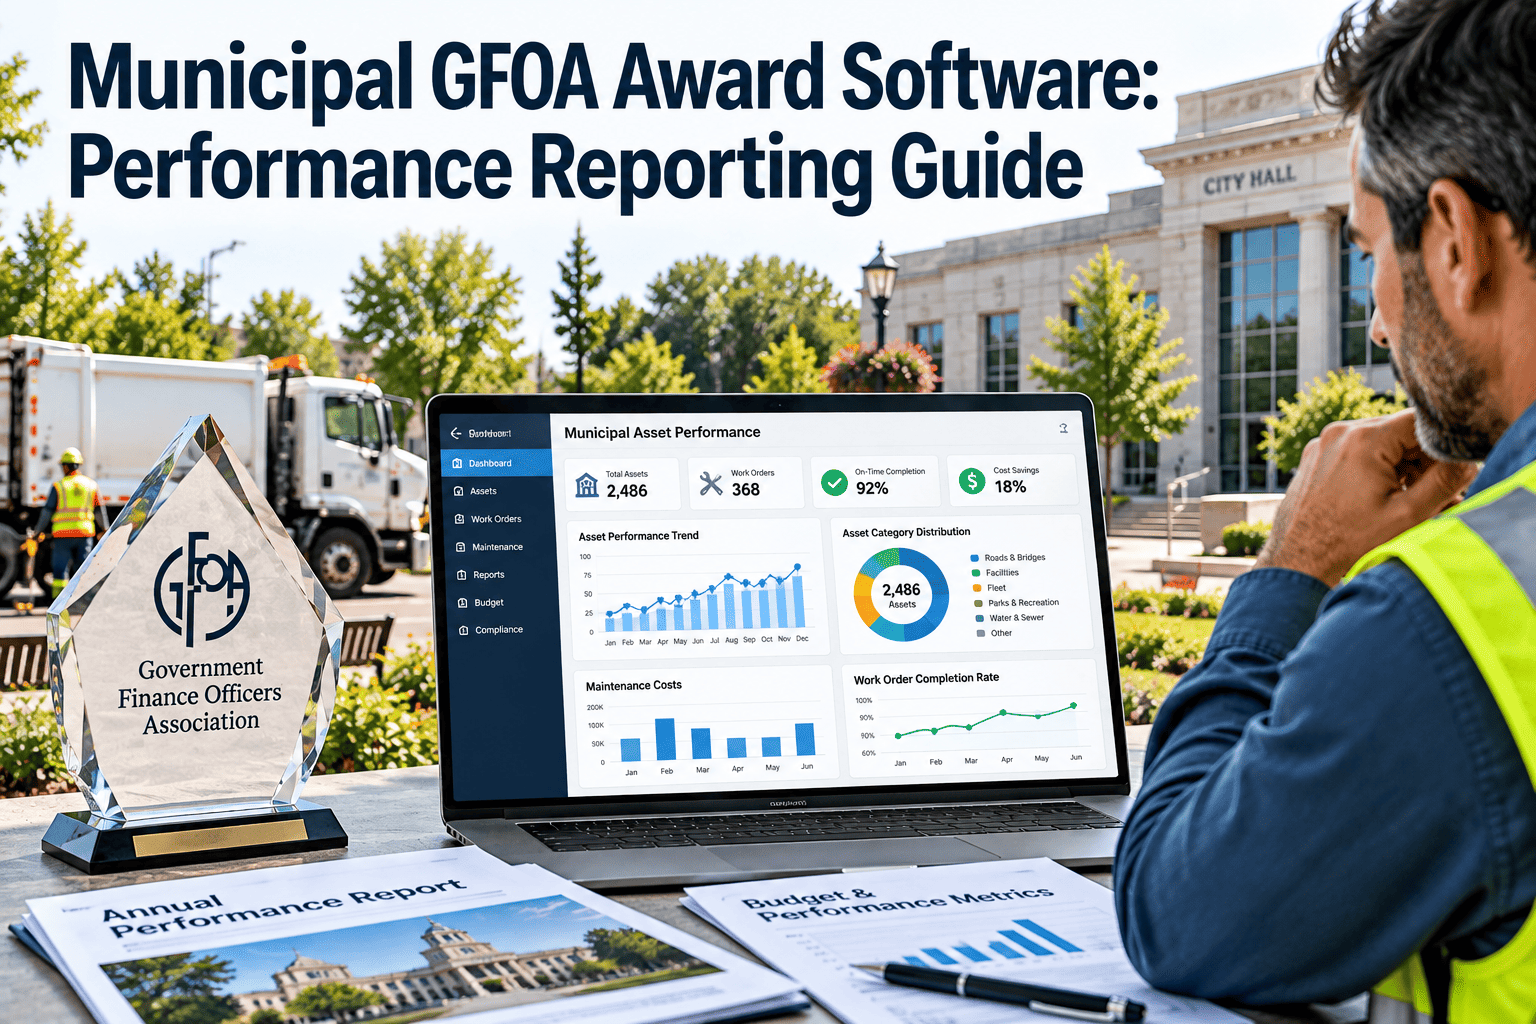
Every budget cycle, finance directors across the United States and Canada assemble a document that has to satisfy two very different audiences at once — the accountants who will check it against generally accepted budgeting practices, and the residents who just want to know whether the streets department is keeping up. The Government Finance Officers Association's Distinguished Budget Presentation Award is where those two goals meet, and its special recognition categories for Performance Measures and Strategic Goals are usually decided less by finance staff than by whether public works, utilities and operations can actually produce reliable, comparable numbers on demand — which is exactly where a maintenance and asset management system earns its place in the process.
Win GFOA special recognition for performance measures with data operations can actually stand behind
Give your budget team asset condition, work order completion and service-level data straight from the CMMS your public works, fleet and utilities teams already run on.
The Distinguished Budget Presentation Award, and what "special recognition" requires
GFOA's Distinguished Budget Presentation Award is the standard credential for governmental budget documents, judged against four criteria: the budget as a policy document, a financial plan, an operations guide and a communications tool.
Beyond the base award, GFOA grants special recognition in specific categories — most notably Performance Measures and Strategic Goals and Strategies — when all three independent reviewers give the document the highest possible score in that category. That bar is where most municipalities stall, because it requires performance data that is current, department-wide and internally consistent, not a handful of illustrative charts pulled together at submission time.
Why public works and operations data is usually the weak link
Finance teams can control the narrative and formatting of a budget book. They cannot manufacture reliable service-level data that public works, utilities, parks and fleet never tracked consistently in the first place.
Metrics differ by department and by year
Streets reports pothole counts, water reports main breaks, and neither uses a comparable baseline year over year — reviewers notice when trend lines cannot actually be trended.
Work order data lives in spreadsheets or paper
Without a system logging completion dates against scheduled dates, "percent of preventive maintenance completed on time" becomes an estimate rather than a reportable figure.
Asset condition is undocumented
Reviewers scoring the operations-guide and performance-measures criteria expect condition and lifecycle data tied to actual assets, not general statements about infrastructure age.
Strategic goals are not linked to operational output
Special recognition for Strategic Goals and Strategies looks for a visible line from council priorities to department-level measures — a link that is hard to draw when operational data is siloed.
What GFOA reviewers are checking for, category by category
The award's four core criteria and the two special-recognition categories most relevant to operations departments map to specific, checkable questions.
| Criterion | What reviewers look for | Where operations data fits |
|---|---|---|
| Policy Document | Clear link between budget decisions and organizational goals | Department priorities tied to service-level targets |
| Financial Plan | Multi-year fiscal outlook and capital planning detail | Asset lifecycle and replacement-cost data for CIP planning |
| Operations Guide | Organizational structure tied to service delivery detail | Work order volume, backlog and completion by division |
| Communications Device | Document is understandable to a non-expert reader | Plain-language KPI summaries and trend charts |
| Performance Measures (special recognition) | Consistent, outcome-oriented metrics tracked over multiple years | PM compliance rate, response time, asset condition index |
| Strategic Goals & Strategies (special recognition) | Council priorities visibly connected to departmental measures | Goal-linked KPIs reported consistently across departments |
How CMMS data becomes performance-measure content
The metrics that satisfy a GFOA reviewer are, almost without exception, metrics a maintenance management system is already generating as a byproduct of daily work.
Work is logged where it happens
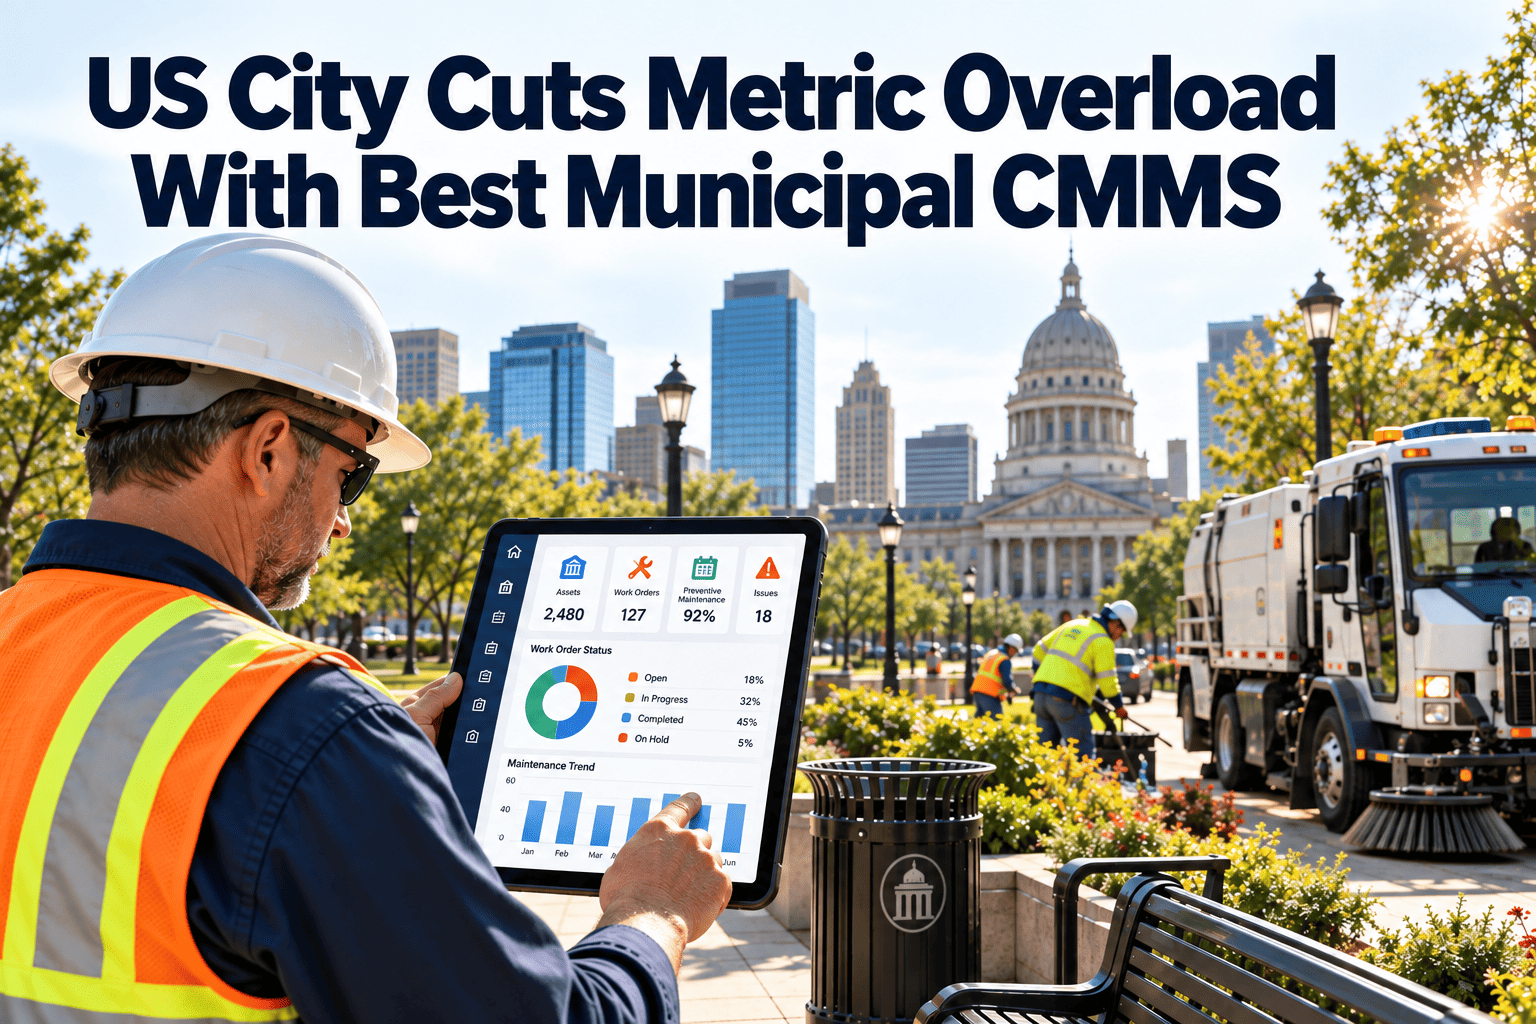
Field crews close out preventive and corrective work orders on mobile devices, with scheduled versus actual completion dates recorded automatically rather than reconstructed later.
Every department uses the same asset and KPI structure
Fleet, facilities, water and streets track PM compliance, response time and backlog in the same format, so the numbers in the budget book are comparable across divisions and years.
Dashboards aggregate to department and citywide views
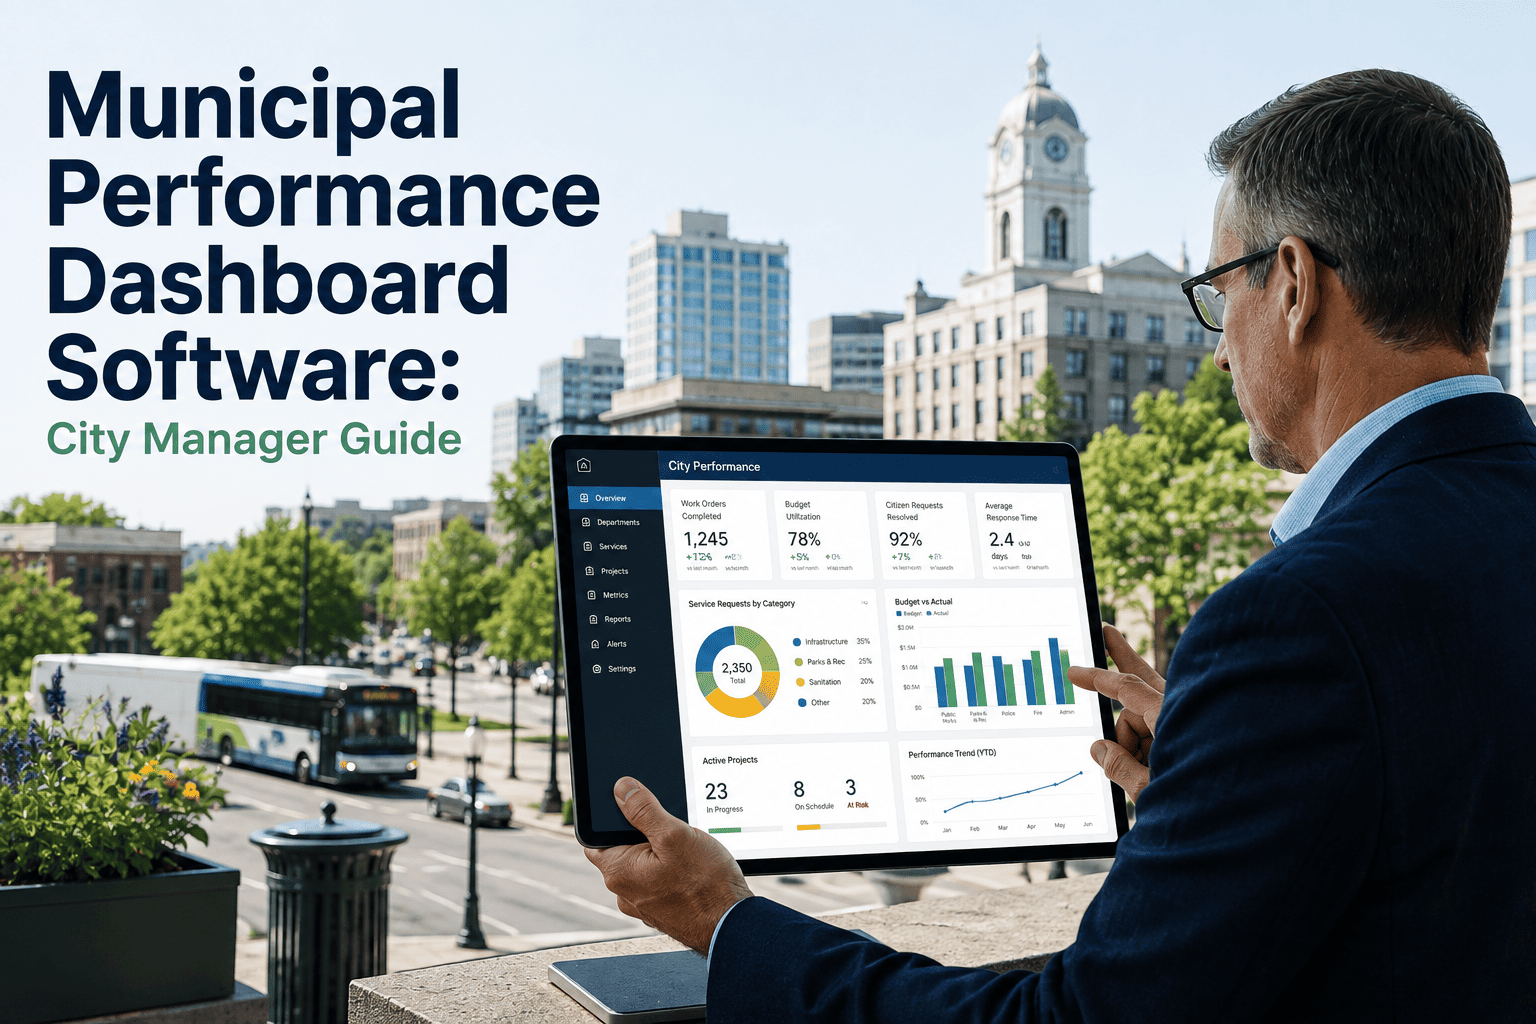
A finance analyst pulling performance-measure content for the budget document draws from a live dashboard instead of emailing five department heads for their best estimate.
KPIs map back to council priorities
Because measures are tracked consistently at the asset and division level, they can be tagged to the strategic goal they support — the connection GFOA's Strategic Goals recognition specifically rewards.
Next year's submission starts from a real trend line
Because the same system generated last year's numbers, this year's budget document can show genuine multi-year trends instead of a fresh baseline every cycle.
Give your budget team performance data worth publishing
Connect public works, fleet and utilities work order data to the KPIs your next GFOA submission needs.
Performance measures GFOA reviewers recognize as outcome-oriented
Reviewers tend to favor measures that describe an outcome for residents, not just an activity count. These six are common anchors for public works and utilities sections of an award-recognized budget.
Preventive maintenance compliance rate
Percent of scheduled PM work completed on time, tracked by asset class and division.
Average work order response time
Time from resident or staff request to first response, by service category.
Planned versus reactive work ratio
Share of labor hours spent on scheduled work versus emergency repairs.
Asset condition index
Weighted condition score for critical infrastructure feeding capital planning narratives.
Work order backlog aging
Open work orders grouped by age, showing whether backlog is shrinking or growing year over year.
Cost per service unit
Maintenance cost per mile, per facility or per asset, supporting the financial-plan criterion directly.
The system feeding the numbers, not another reporting layer to maintain
Oxmaint does not write the budget document — it is the CMMS that gives finance and operations a shared, dependable source for the operational data that document depends on.
Preventive maintenance scheduling, mobile work order completion, asset registers and inspection records generate the same PM compliance, response-time and backlog figures every department needs, in a consistent format across fleet, facilities, water, parks and streets. Dashboards export the rolled-up KPIs a budget analyst needs for the performance-measures section, and historical records mean next year's submission can show a real multi-year trend instead of starting over. Departments preparing a GFOA submission can book a demo to see how existing work order data maps to the performance-measure categories reviewers score.
Municipal GFOA award and performance reporting — FAQs
What is the difference between the base Distinguished Budget Award and special recognition?
The base award is earned by meeting the four core criteria. Special recognition in categories like Performance Measures or Strategic Goals requires all three reviewers to give the highest possible score in that specific category.
Which departments matter most for the performance measures category?
Public works, utilities, fleet and parks typically supply the bulk of service-level and asset-condition data reviewers expect, since these departments generate the most measurable, recurring operational activity.
How many years of trend data should performance measures show?
Reviewers favor multi-year trends over a single-year snapshot, which is why a consistent data source year over year matters more than any one metric's value. Get started tracking KPIs your system can carry forward.
Can a CMMS help connect performance measures to strategic goals?
Yes — when KPIs are tracked consistently at the department and asset level, they can be tagged to the council priority or strategic goal they support, which is the link GFOA's Strategic Goals recognition looks for.
Does every city need new software to win special recognition?
Not necessarily, but cities without a consistent way to capture work order and asset data across departments often find that the data gap, not the writing, is what keeps the top score out of reach.
Build this year's performance measures on next year's trend line
Standardize PM compliance, response time and asset condition data across every department before your next budget cycle.