Ask three city divisions for their maintenance backlog and you may receive three different numbers, each calculated correctly by its own rules. Water counts open work orders, streets counts unscheduled defects, and facilities counts overdue tasks only. Municipal KPI definition software fixes this at the source by storing one governed definition per metric. A CMMS with a shared KPI taxonomy keeps every division measuring the same thing.
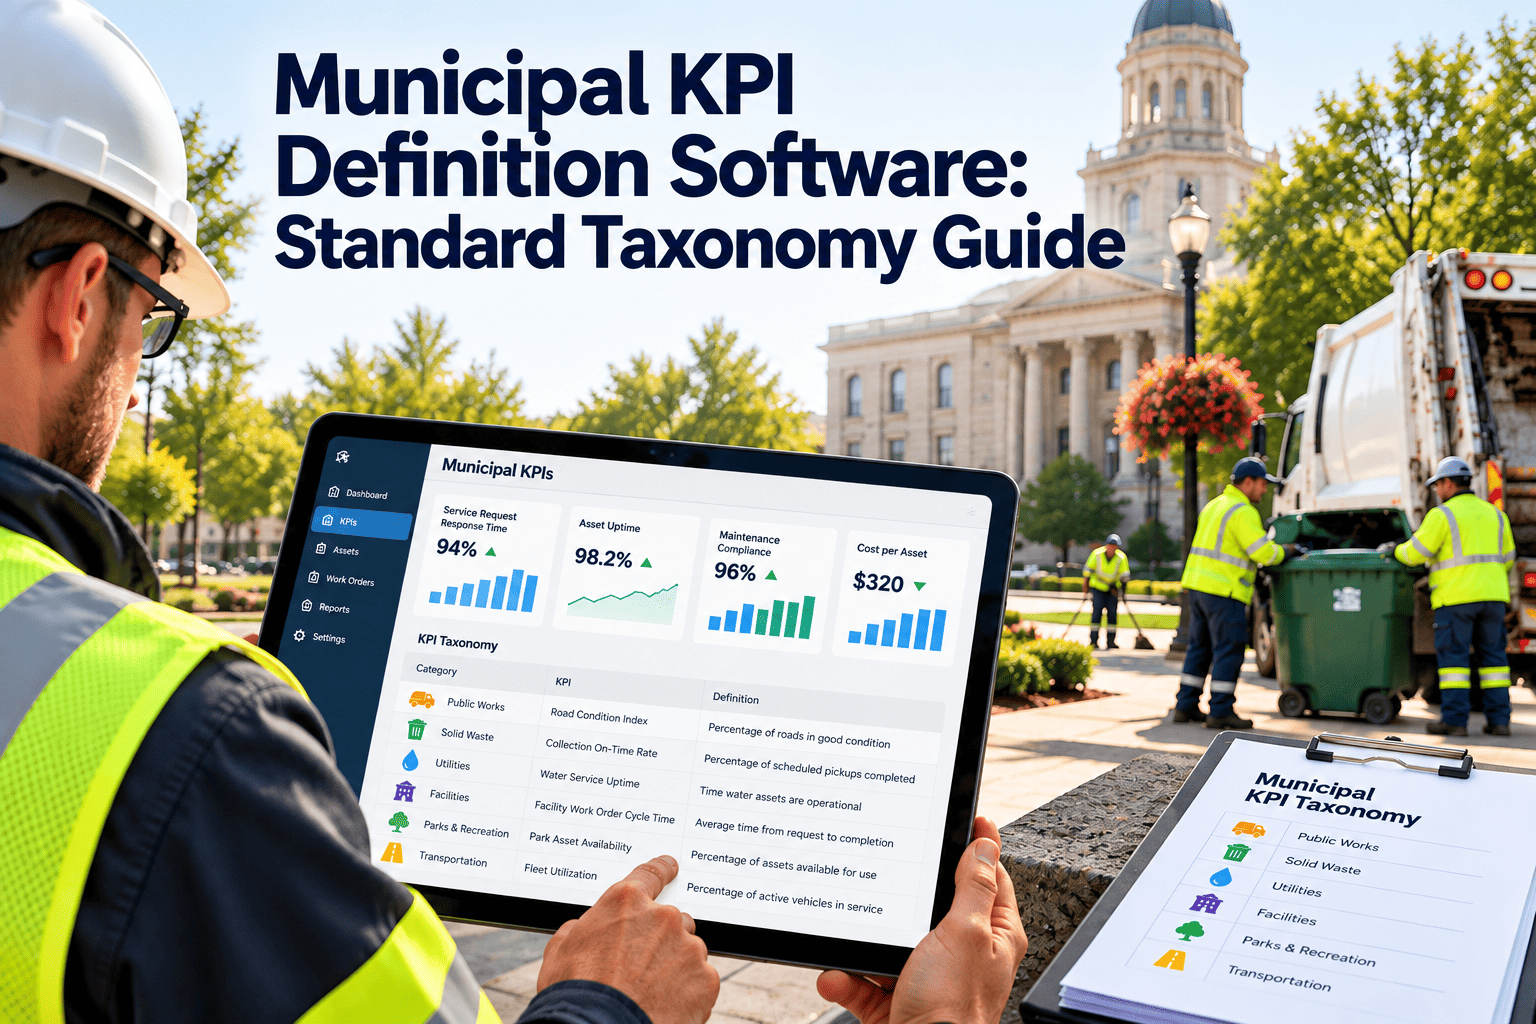
Municipal KPI Taxonomy
One Definition Per KPI. Every Division. Every Report.
Standardise how your city defines, calculates and reports maintenance KPIs, so council reports, budget requests and audits compare like with like.
City KPI Standard
Reliability Metrics
Responsiveness Metrics
Cost and Backlog Metrics
MTBF, MTTR, failure rate
Response time, first-time fix
Backlog, planned vs reactive
Why Municipal KPIs Drift Apart
Definitions rarely fail on purpose. They drift as each division adapts a metric to its own tools, staffing and habits.
01
Local spreadsheets
Each team builds its own formulas. Small edits, such as excluding emergency work, quietly change the result.
02
Undefined clock starts
Response time may start at citizen call, work order creation or dispatch. Each choice gives a different answer.
03
Inconsistent status codes
One division closes a work order when the crew leaves, another when the invoice arrives. Cycle times cannot be compared.
04
Staff turnover
The person who knew why a metric excluded certain assets leaves, and the reasoning leaves with them.
05
Mixed asset hierarchies
Pumps, signals, hydrants and buildings are grouped differently, so roll-ups do not align across departments.
The Operational Cost of Inconsistent Definitions
Without a taxonomy
- Council sees conflicting backlog figures
- Benchmarking between divisions stalls
- Budget requests are challenged on data quality
- Audit preparation means reconstructing formulas
- Improvement targets cannot be verified
With a governed taxonomy
- One backlog definition, applied by system
- Divisions compared on equal terms
- Budget cases backed by traceable data
- Formulas documented and version controlled
- Targets tracked against a stable baseline
The impact is less about accuracy and more about trust. When leaders doubt one number, they doubt the whole maintenance programme.
Anatomy of a Complete KPI Definition Record
A definition is more than a name and formula. Each KPI in the taxonomy should carry the fields below so anyone can reproduce the result.
| Field | What it records | Example |
|---|---|---|
| Name and code | Unique identifier used in every report | KPI-PM-01, PM Compliance |
| Purpose | The decision the metric supports | Show whether preventive work is keeping pace |
| Formula | Numerator, denominator and unit | PM completed on time divided by PM scheduled |
| Data source | Fields and work order types used | Work order status, type, due date |
| Inclusions and exclusions | Assets and work types in or out | Excludes cancelled and emergency orders |
| Time rules | Clock start, clock stop, tolerance window | On time means within the agreed grace period |
| Owner | Role accountable for the definition | Maintenance systems lead |
| Version and review date | Change history and next review | v2.1, reviewed annually |
Building the Taxonomy in Layers
A workable taxonomy separates what the city measures from how each division collects the data.
Layer 1: Strategic outcomes
Service reliability, asset condition, cost control, safety and compliance
Layer 2: Standard KPIs
Corporate metrics with one formula, such as PM compliance and backlog age
Layer 3: Division variants
Approved extensions, such as hydrant flow tests or signal outage minutes
Layer 4: Data capture rules
Required work order fields, status codes, failure codes and asset classes
Layers 1 and 2 stay identical across the city. Layer 3 flexes only through a documented approval.
Core Municipal Maintenance KPIs to Define First
Start with a short list. Industry bodies such as SMRP publish widely used maintenance metric definitions you can adapt to public works.
| KPI | Definition question to settle | Common trap |
|---|---|---|
| PM compliance | What counts as on time? | No grace period stated |
| Maintenance backlog | Measured in count, labour hours or weeks of work? | Mixing ready and waiting-on-parts work |
| Response time | Which event starts the clock? | Starting at dispatch, hiding queue delay |
| Mean time to repair | Does it include waiting for parts? | Excluding wait time flatters results |
| Planned vs reactive ratio | How is emergency work classified? | Reclassifying after completion |
| First-time fix rate | What counts as a repeat visit? | No time window for repeats |
| Asset availability | Which downtime is counted? | Planned outages left in or out inconsistently |
| Cost per asset | Are labour, parts and contractors included? | Overhead allocated differently by division |
One Backlog, Three Answers: A Worked Illustration
The table below is an illustration of how identical work can produce different results, not measured city data. Imagine 100 open work orders across three divisions.
| Division rule | What gets counted | Effect on the reported figure |
|---|---|---|
| Water utilities | All open work orders, including those waiting for parts | Highest figure, because nothing is excluded |
| Streets and roads | Only work orders past their target date | Lower figure, because new work is ignored |
| Facilities | Only work that is fully planned and ready to schedule | Lowest figure, because blocked work is hidden |
Each rule is defensible alone. Together they make a citywide backlog number meaningless until one rule is chosen.
A better approach
Define backlog once, then publish sub-views such as ready backlog, blocked backlog and overdue backlog. Every view uses the same underlying work order data.
Data Foundations a KPI Standard Depends On
A precise definition still fails if the underlying records are incomplete. Fix these inputs before you trust any automated calculation.
A
Complete asset register
KPIs such as availability and cost per asset need every in-scope asset recorded, with class, location and criticality.
B
Reliable timestamps
Created, started, completed and closed times must be captured at the moment they happen, ideally from mobile devices in the field.
C
Controlled status list
A short, agreed list of statuses prevents free-text variations that break filters and formulas.
D
Failure and cause codes
Consistent codes allow repeat-failure analysis and make first-time fix rate meaningful.
E
Labour and parts capture
Hours and material issued to each work order feed cost KPIs and backlog measured in labour hours.
Definition Risk Matrix
Not every KPI deserves the same governance effort. Rank each one by how badly a definition error would mislead decisions and how likely drift is.
| KPI | Likelihood of drift | Impact if wrong | Governance level |
|---|---|---|---|
| Maintenance backlog | High | High, drives staffing and budget | Strict, council-reported |
| Response time | High | High, tied to service commitments | Strict, council-reported |
| PM compliance | Medium | High, links to asset life and safety | Strict |
| Planned vs reactive ratio | Medium | Medium | Standard |
| Cost per asset | High | Medium to high | Standard with finance review |
| Division-specific metrics | Low | Low to medium | Light, approved variant |
Change Control: Keeping the Standard Stable
Definitions must be able to change, because services and technology change. What matters is that changes are visible and deliberate.
Request
Any division proposes a change with the business reason and the KPIs affected.
Impact review
The definition owner compares old and new results on recent data and documents the shift.
Approval
A cross-division group signs off, since one change can alter reports for every department.
Release and restatement
The new version takes effect on a stated date, and prior periods are recalculated for a fair trend line.
Audit and Compliance Benefits of Documented Definitions
Consistent definitions turn maintenance records into evidence. That matters whenever a city must show that assets were maintained as promised.
Regulatory reporting
Water, wastewater and transport programmes often require documented inspection and maintenance history. Standard fields make extraction simple.
Grant applications
Funders ask for asset condition and performance data. Traceable definitions make claims easier to defend.
Internal and external audit
Auditors can follow a figure from the report to the formula to the work order record.
Insurance and liability
Dated, consistent records help demonstrate that preventive work and inspections were completed.
Common Mistakes When Standardising KPIs
Mistakes to avoid
- Defining too many KPIs before the first ones are trusted
- Writing definitions without the people who enter the data
- Choosing formulas the system cannot calculate
- Skipping the side-by-side comparison with old results
- Leaving definitions in a document nobody opens
Better practice
- Start with a short list tied to council and budget reporting
- Involve supervisors, planners and technicians in the workshop
- Test each formula against real work order fields
- Explain every gap between old and new numbers
- Show the definition code and version inside the dashboard
The most durable standards are simple, calculated by the system, and owned by a named role.
Using the Standard for Better Decisions
Once definitions are trusted, the numbers can drive operational choices instead of debates about method.
Where standard KPIs change daily work
- Planners compare PM compliance by asset class to find where preventive schedules are slipping
- Supervisors review backlog age to rebalance crews between areas
- Asset managers use repeat-failure data to justify replacement over another repair
- Finance teams compare cost per asset across divisions to test contractor rates
- Directors track planned versus reactive work to see whether the city is moving toward proactive maintenance
A shared taxonomy also lets a city set targets with confidence, since a number that meant one thing last year still means the same thing today.
Give Every Division the Same Yardstick
See how a shared taxonomy, governed definitions and consistent work order data come together in one maintenance platform.
How a CMMS Enforces the Taxonomy
A definition document helps only if the system applies it. Software makes the standard the default rather than the exception.
Standard work order fields
Required status, priority, type and failure codes give every KPI the same inputs.
Then
Common asset hierarchy
Asset classes and locations roll up the same way for every department.
Then
Calculated from live data
Dashboards read work order records directly, so nobody rebuilds formulas by hand.
Capabilities that support governance
- Preventive maintenance schedules with defined due dates and tolerances
- Work order types that separate planned, reactive and emergency work
- Asset management records with consistent classes and criticality
- Inspection and compliance records attached to the asset history
- Inventory and cost tracking for consistent cost-per-asset figures
- Role-based access, so only owners change standard fields
- Reporting and dashboards that show the same figures to every user
Rollout Timeline: From Workshop to Reporting
Weeks 1 to 2
Inventory current KPIs and formulas from every division. Record where they conflict.
Weeks 3 to 4
Hold a cross-division workshop. Agree formulas, clock rules and exclusions for the core list.
Weeks 5 to 6
Configure status codes, work order types and asset classes to match the agreed definitions.
Weeks 7 to 8
Run old and new calculations side by side. Explain every gap to division leads.
Ongoing
Review definitions annually, log changes and restate history when a formula changes.
Timings vary with city size and the state of existing data. Treat them as a planning starting point.
Governance Checklist for Definition Owners
Every KPI has a named owner and a version number
Formulas name the exact fields and statuses used
Exclusions are written down with a reason
Division variants are approved and labelled as variants
Definition changes trigger a restated baseline
Status and failure codes are locked to approved lists
New staff receive the KPI dictionary at onboarding
Reports show the definition code beside each figure
Standard definitions also support asset management practice under ISO 55001 and condition reporting expectations tied to GASB 34, where they apply to your jurisdiction.
Trends Shaping Municipal KPI Practice
Condition-based triggers
Sensor and inspection data now start work orders, so KPIs must define how condition-driven work is counted.
Open performance dashboards
Cities publish service metrics to residents, which raises the bar on definition clarity.
Cross-department asset programmes
Capital planning increasingly compares water, roads and facilities in one portfolio view.
Sample KPI Dictionary Entry: PM Compliance
This example shows how one definition can be written so any analyst or auditor reproduces the same result. Adapt the wording to your own policy.
Purpose
Show whether scheduled preventive work is being completed when planned, so asset reliability is protected.
Formula
Preventive work orders completed within the tolerance window, divided by preventive work orders that came due in the period, shown as a percentage.
Scope rules
Includes all scheduled preventive and inspection work orders. Excludes cancelled orders approved by a supervisor with a recorded reason.
Reporting rules
Reported monthly by division and asset class. The same definition code appears on every dashboard and council report.
Writing every core KPI to this level takes effort once, and saves repeated arguments about method every reporting cycle.
Municipal KPI Definition FAQs
What is a KPI taxonomy?
It is a structured, governed list of KPIs with fixed formulas, owners and data rules. Start building yours in a CMMS.
Should every division use identical KPIs?
Core KPIs should be identical. Division-specific metrics can sit as approved variants under the standard.
How many KPIs should we define first?
Start with six to ten that support council reporting and budgets. Expand once the first set is trusted.
What happens when a definition changes?
Version the change and restate historical figures so trends stay valid. Record who approved it and why.
Can we see this configured for a city?
Yes. Book a demo to see definitions applied to real work order data.
Make Every Municipal KPI Mean the Same Thing
Replace conflicting spreadsheets with governed definitions, consistent work order data and reports every division can defend.