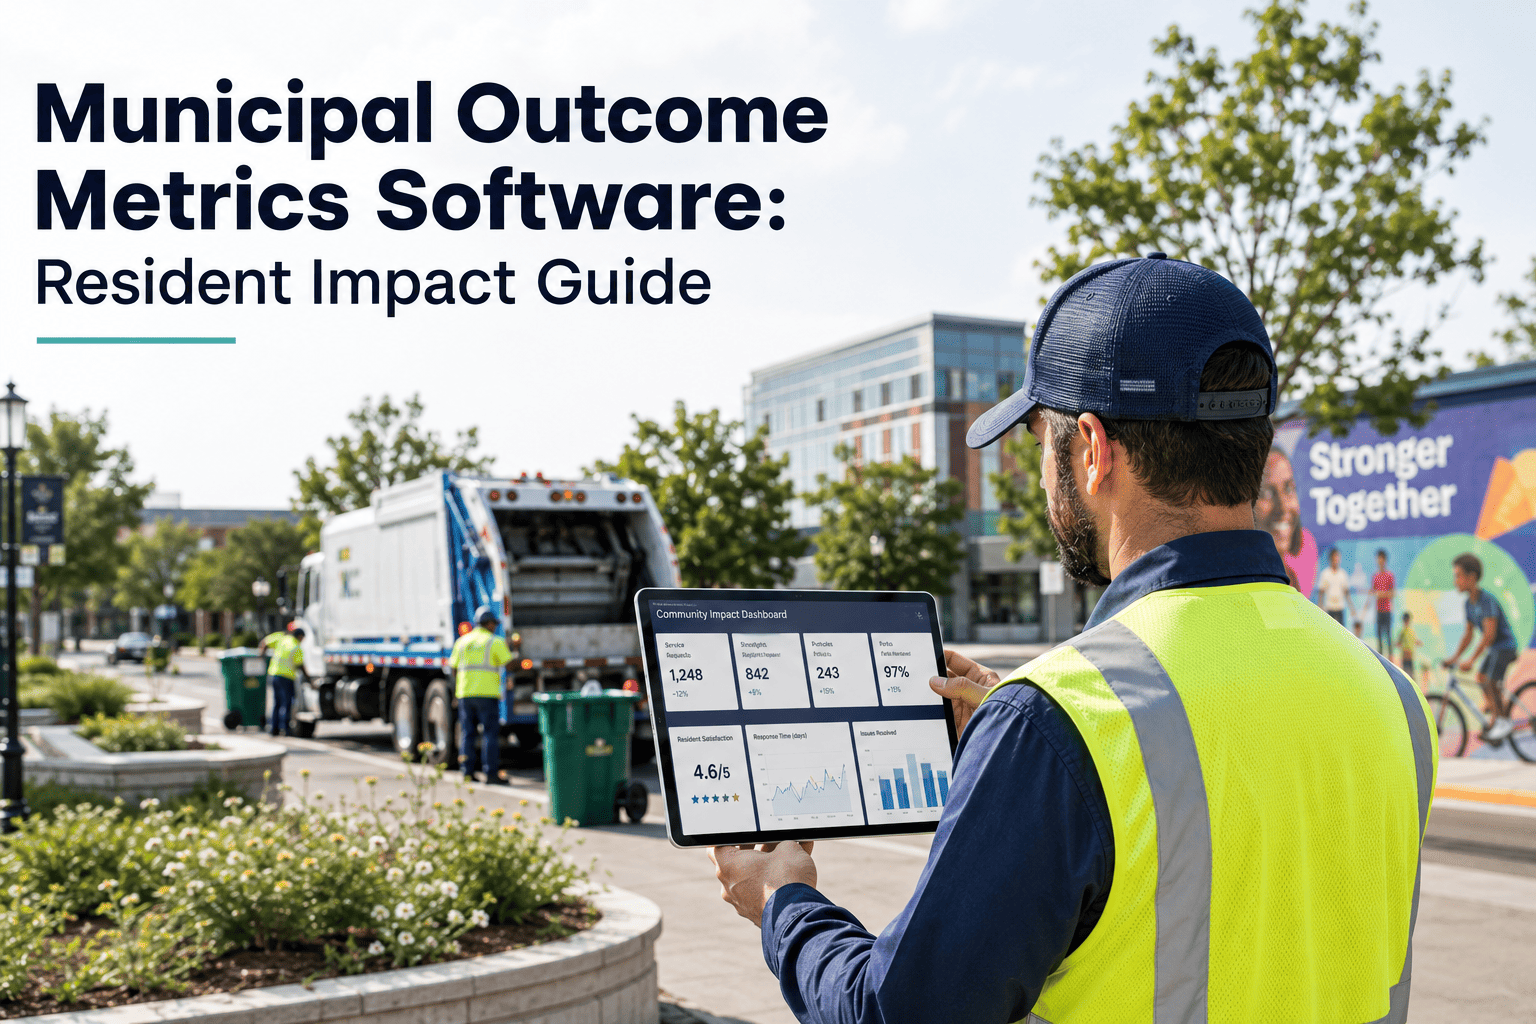
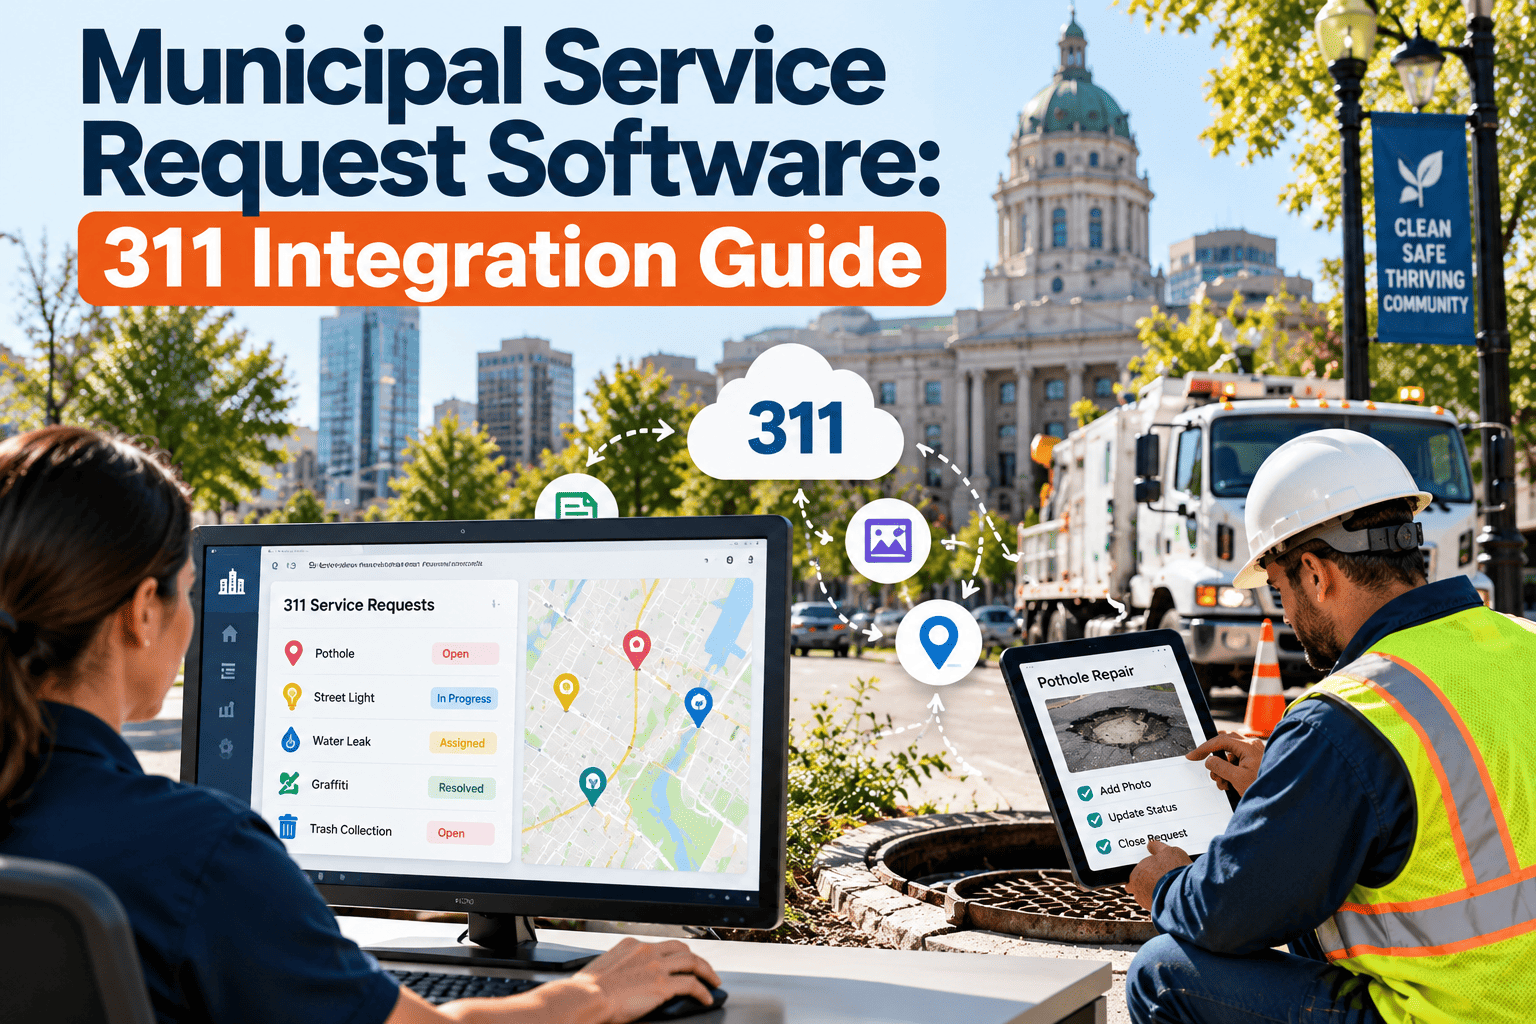
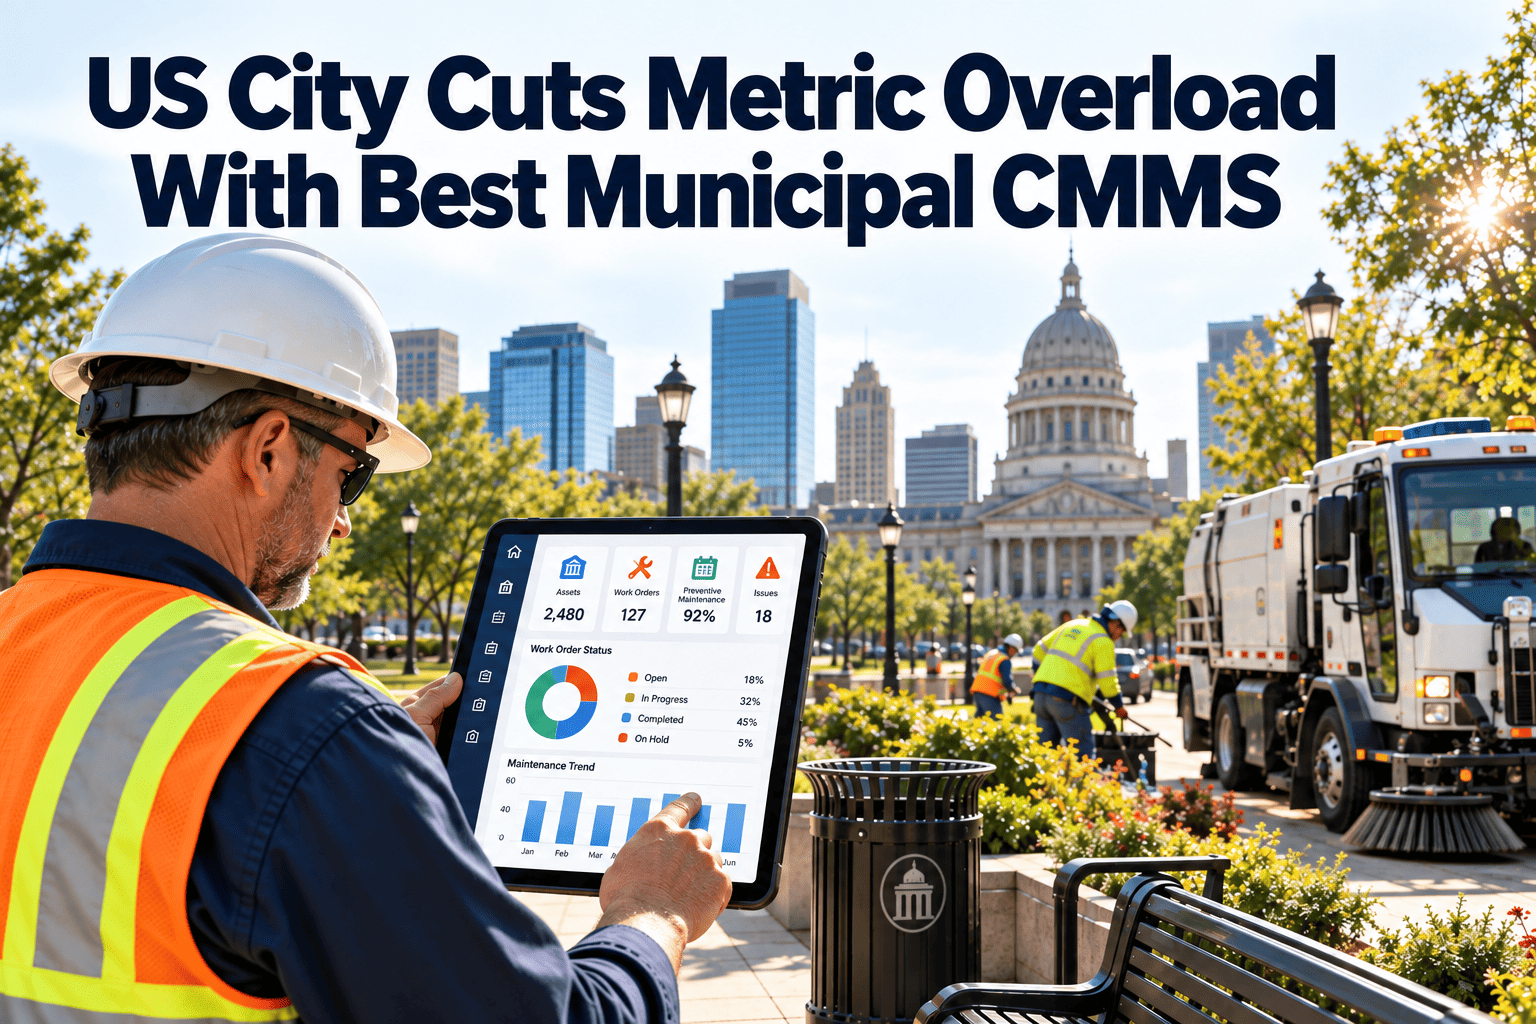
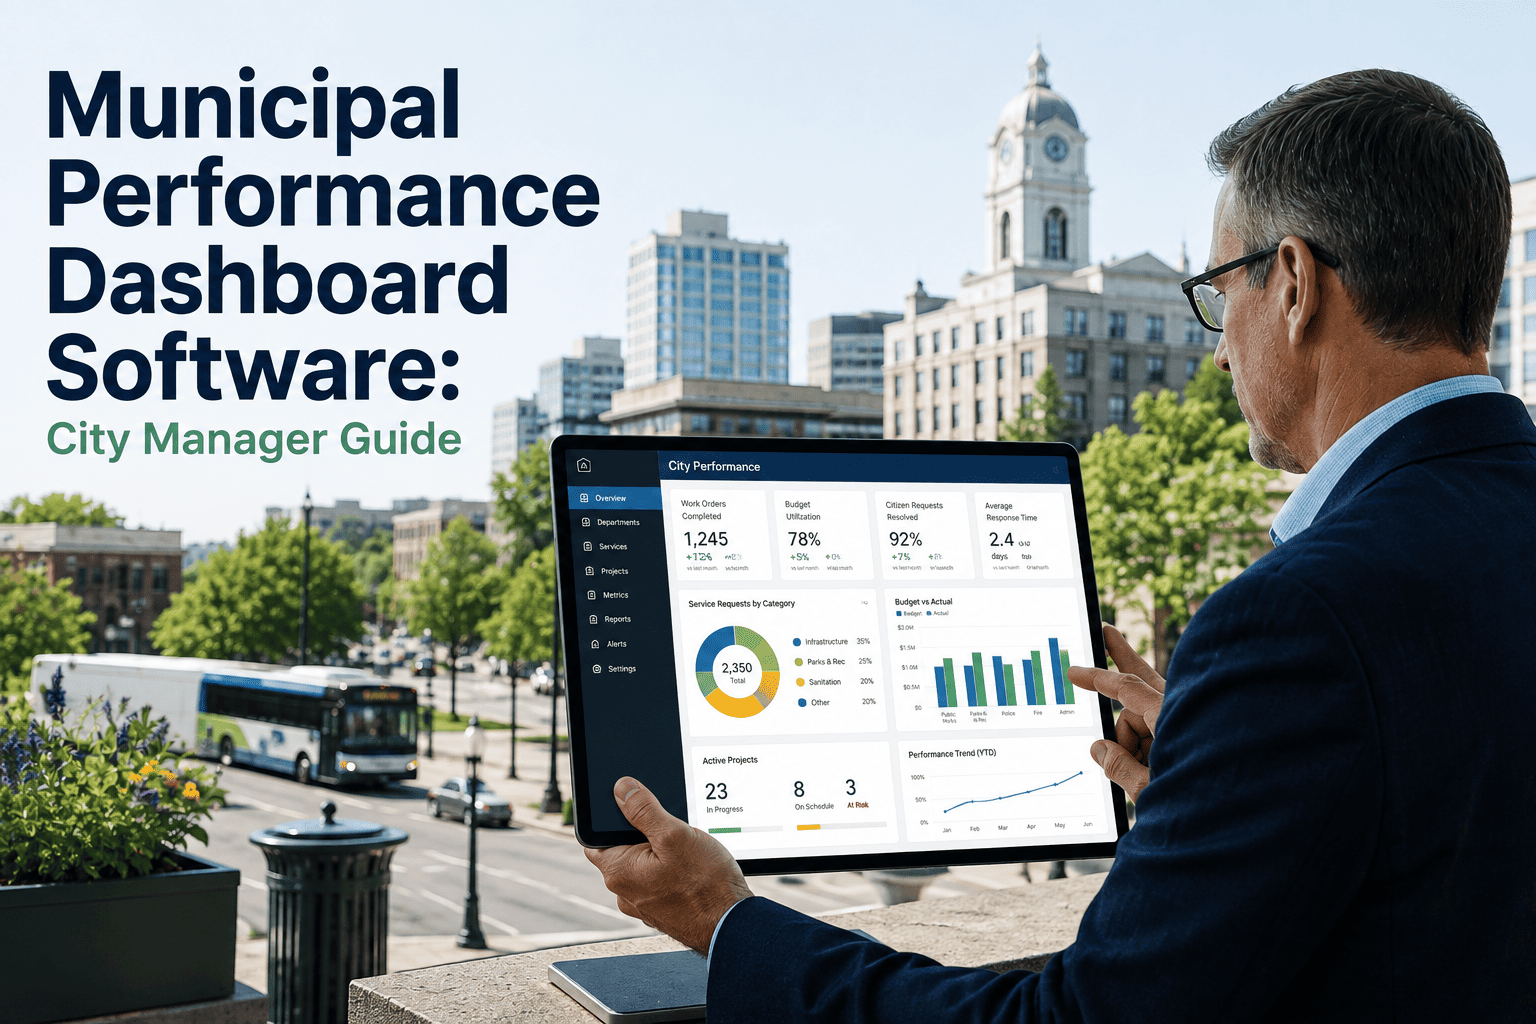
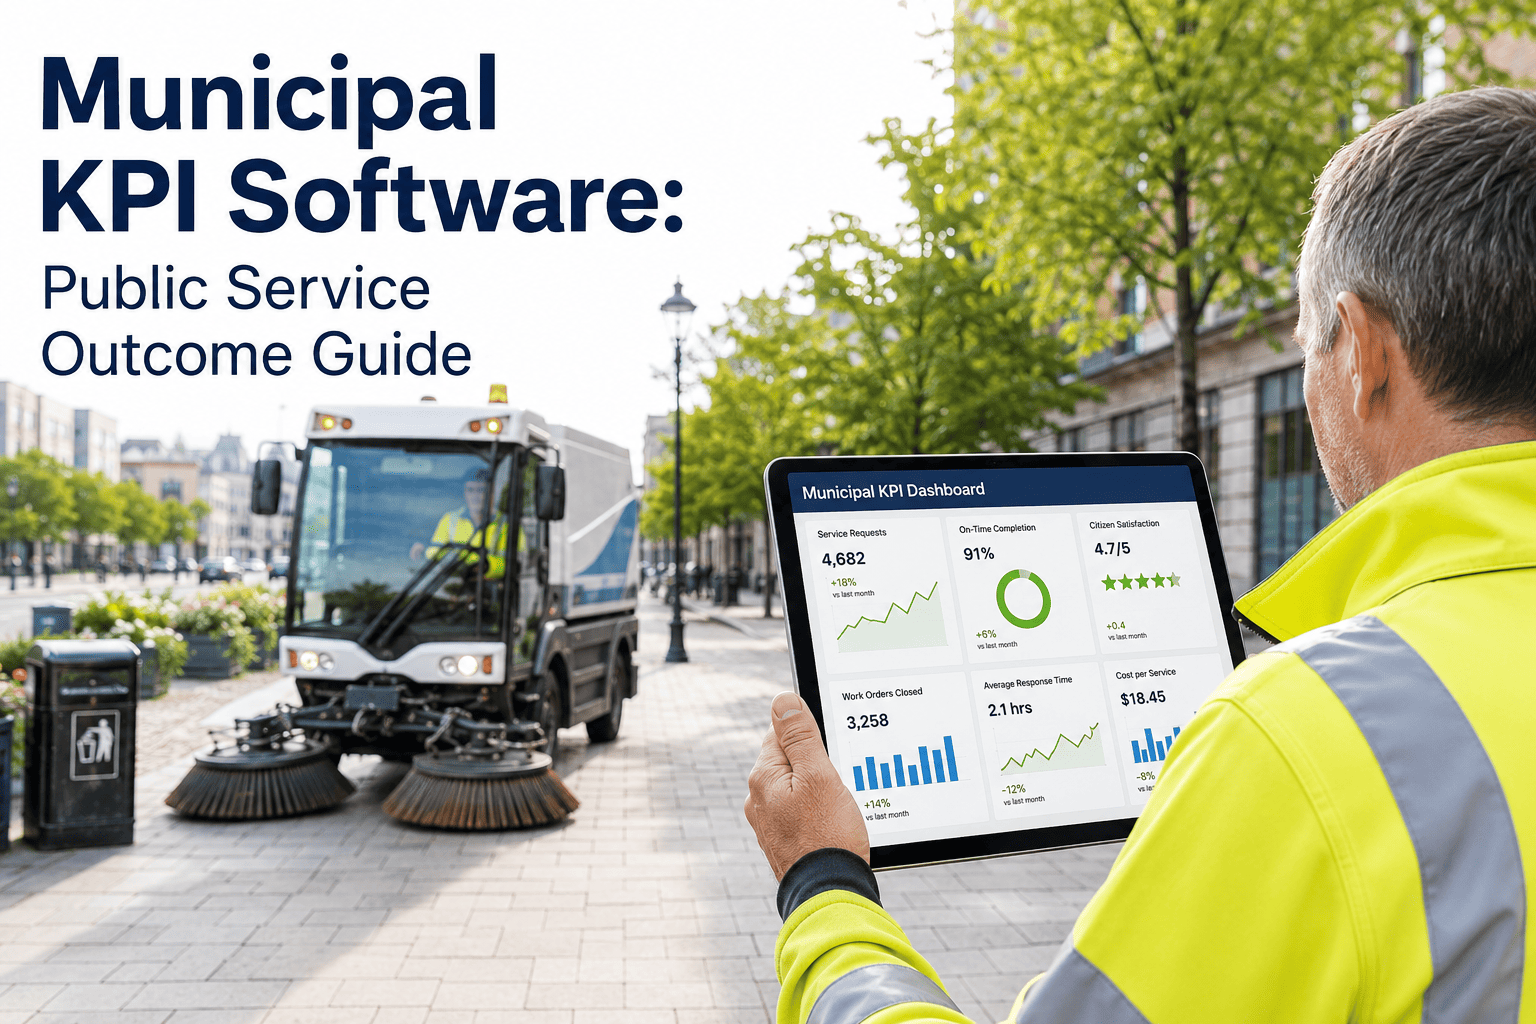
A council member asks how public works is performing, and the director responds with a forty-slide deck of activity counts — miles paved, calls answered, work orders closed. The council member nods politely and walks away no wiser, because none of those numbers say whether anything actually got better for the people living on those streets. Municipalities collect mountains of operational data every year, but most of it measures effort, not effect — and effort without effect is the illusion of accountability that keeps a city council guessing instead of governing. The shift that changes this is simple to describe and hard to build without the right system: pair every activity number with the outcome it was supposed to produce, and score that outcome by how it actually landed on residents. This guide walks through what that resident-impact scoring model looks like inside a CMMS, department by department. If your team is ready to move past output counts, you can book a demo with OxMaint and see outcome scoring built around your own service departments.
Municipal Government · Performance Metrics · CMMS
Stop Reporting Activity Counts. Start Scoring Resident Impact
Municipal programs that launch with forty-plus KPIs typically collapse under their own reporting burden within eighteen months. This guide shows how to build a smaller, sharper set of outcome metrics — connected directly to work order and asset data — that tells a mayor, city manager, or council member what actually changed for residents.
18 mo
is how long most 40+ metric municipal dashboards survive before collapsing under reporting burden
5–8
core metrics per department is the range that consistently drives real behavioral change
0%
of residents feel informed by a work-order count alone, without any outcome attached to it
1 score
is enough to answer "how are we doing" if it's built from outcomes, not activity totals
The Measurement Ladder
Why "Work Orders Completed" Isn't A Performance Number
Every metric a city tracks sits on one of four rungs. Most municipal reporting stops at the second rung — outputs — and calls it performance. Real accountability requires climbing two rungs higher, to the outcome residents actually experience and the broader impact on community life.
Rung 4
Impact
Long-term community change — safer neighborhoods, higher property values, stronger public trust
Rung 3
Outcome
What residents actually experience — road condition score improved, response time dropped
Rung 2
Output
What the department produced — miles paved, work orders closed, inspections completed
Rung 1
Input
Resources spent — staff hours, budget allocated, equipment deployed
The Real Difference
Output Reporting Versus Outcome Reporting, Side By Side
The same underlying work looks completely different depending on which rung of the ladder a report is written from. Here is what that looks like for a typical pothole repair program.
Output-Only Reporting
"We completed 3,247 pothole repair work orders this quarter"
No comparison to how many were reported versus resolved
No indication of whether backlog is growing or shrinking
No connection to whether road condition actually improved
Council cannot tell if this number is good, bad, or average
Outcome-Scored Reporting
"Average pothole response time dropped from 5.2 to 3.1 days this quarter"
Backlog trend shown alongside completion count, not separately
Road condition index tracked as the outcome the repairs were meant to produce
Resident-reported complaint volume tracked as a validation signal
Council sees a trend line against target, with peer city context
OxMaint · Outcome-Connected CMMS
Every Work Order Already Contains The Outcome Data — If Your System Connects It
OxMaint links work order completion directly to the condition and response-time metrics residents actually feel, so your quarterly report tells council what changed, not just what got done.
Resident Impact Score
Rolling Department Outcomes Into One Number Council Can Actually Use
A single composite score does not replace department-level detail — it gives a mayor or council member a starting point before they drill into any one service area. The score below is built from four weighted components, each pulled directly from operational data rather than a survey alone.
Service reliability — 30%
Response time — 25%
Resident satisfaction — 25%
Cost per outcome — 20%
Department Scorecards
What Outcome Metrics Look Like Across Core City Departments
Every department has an output number it already reports. The table below shows the outcome metric that number should be paired with, so activity and effect are never reported separately again.
| Department |
Common Output Metric |
Paired Outcome Metric |
What It Tells Council |
| Public Works |
Work orders completed |
Average response time, road condition index |
Whether infrastructure is actually improving, not just being worked on |
| Parks & Recreation |
Facilities maintained |
Percent of residents within a 5-minute walk of usable green space |
Whether access, not just upkeep, is improving equitably |
| Permitting & Inspections |
Permits processed |
Average time from application to approval |
Whether the process is getting faster for residents and businesses |
| Public Safety Facilities |
Inspections completed |
Percent of critical assets meeting uptime target |
Whether emergency-critical infrastructure is actually reliable |
| Utilities |
Meter reads or repairs done |
Service interruption minutes per resident per year |
Whether reliability is trending better or worse over time |
Common Pitfalls
Where Municipal Outcome Programs Go Wrong
Cities that attempt outcome measurement and abandon it within two years usually hit one of the same three walls, all of which are avoidable with the right structure from the start.
A
Too Many Metrics, Too Little Follow-Through
A dashboard with forty KPIs gets built once and reviewed never. Five to eight metrics per department, reviewed monthly, drive far more actual change than a comprehensive library nobody revisits.
B
Outcomes Reported Without Context
A response time of 5.2 days means nothing on its own. Every outcome metric needs a target, a trend line, and ideally a peer city comparison to be useful to a decision maker.
C
Manually Compiled Once A Quarter
If outcome data has to be manually pulled from three systems before a council meeting, the program dies the first time someone is too busy to build the slide deck.
OxMaint · Government Performance CMMS
Outcome Scoring That Updates Itself, Not A Deck Someone Rebuilds Every Quarter
OxMaint calculates outcome metrics automatically from live work order, asset, and response-time data, so your resident impact score is current the moment council asks for it.
Building The Program
Four Steps To Move A Department From Output To Outcome Reporting
1
Identify The Outcome Behind Each Output
For every activity number already tracked, ask what it was supposed to change for a resident, and name that change as the paired outcome metric.
2
Set A Target And Pull A Peer Comparison
A number without a target is a data point, not a performance measure. Comparable cities or prior-year trends give council something to judge the number against.
3
Automate The Calculation From Work Order Data
Response time, backlog trend, and condition scores calculate directly from CMMS work order timestamps and asset records, without a manual export.
4
Publish The Score Where Residents Can See It
A public-facing dashboard turns internal accountability into public trust, and gives residents a reason to believe the numbers are real.
Field Perspective
What City Leaders Say Once Outcome Scoring Replaces Activity Counts
Our old quarterly report was a wall of numbers nobody on council could act on. Now every metric has a target and a trend line next to it, and for the first time meetings turn into actual decisions instead of a data dump.
City Manager, Mid-Size Municipality
We used to report pothole counts and feel good about the number. Once we paired it with response time and resident complaint trends, we found out our backlog was quietly growing behind a completion count that looked fine on its own.
Director of Public Works, County Seat City
Frequently Asked Questions
Municipal Outcome Metrics — Common Questions
How many outcome metrics should a department track?
Five to eight core metrics per department is the range that consistently gets reviewed and acted on. Programs that launch with dozens of metrics typically collapse under their own reporting burden within a couple of years.
Do we need resident surveys to build an outcome score?
Surveys add a valuable satisfaction signal, but most outcome metrics — response time, backlog trend, condition scores — come directly from operational data already captured in a CMMS.
Book a demo to see which metrics your existing data already supports.
Can outcome metrics be compared against peer cities?
Yes, for standardized metrics like response time and service interruption minutes. Peer comparison gives council the context a raw number cannot provide on its own.
How does an outcome score connect to work order data?
Work order timestamps, asset condition records, and backlog counts calculate response time and reliability metrics automatically, without a manual quarterly export.
Should outcome scores be published publicly?
Many cities publish a resident-facing dashboard once internal reporting is reliable, since a transparent public score builds trust that an internal-only report cannot.
Start a free trial to build your first department scorecard.
OxMaint · Outcome Metrics For Municipal Government
Give Council A Number That Actually Answers "How Are We Doing"
OxMaint connects work order, asset, and response-time data into a resident impact score that updates automatically — so every department reports what changed, not just what got done.