Every dollar spent on preventive pavement maintenance today saves between four and ten dollars in future reconstruction costs — yet most municipal public works departments still allocate budgets reactively, patching failures after they occur rather than preserving pavements before they deteriorate. In 2026, cities running a structured CMMS-tracked pavement management program are stretching their asphalt budgets 30–40% further than those without one, while simultaneously improving PCI scores and reducing resident complaints about road conditions.
Government · Public Works · Infrastructure
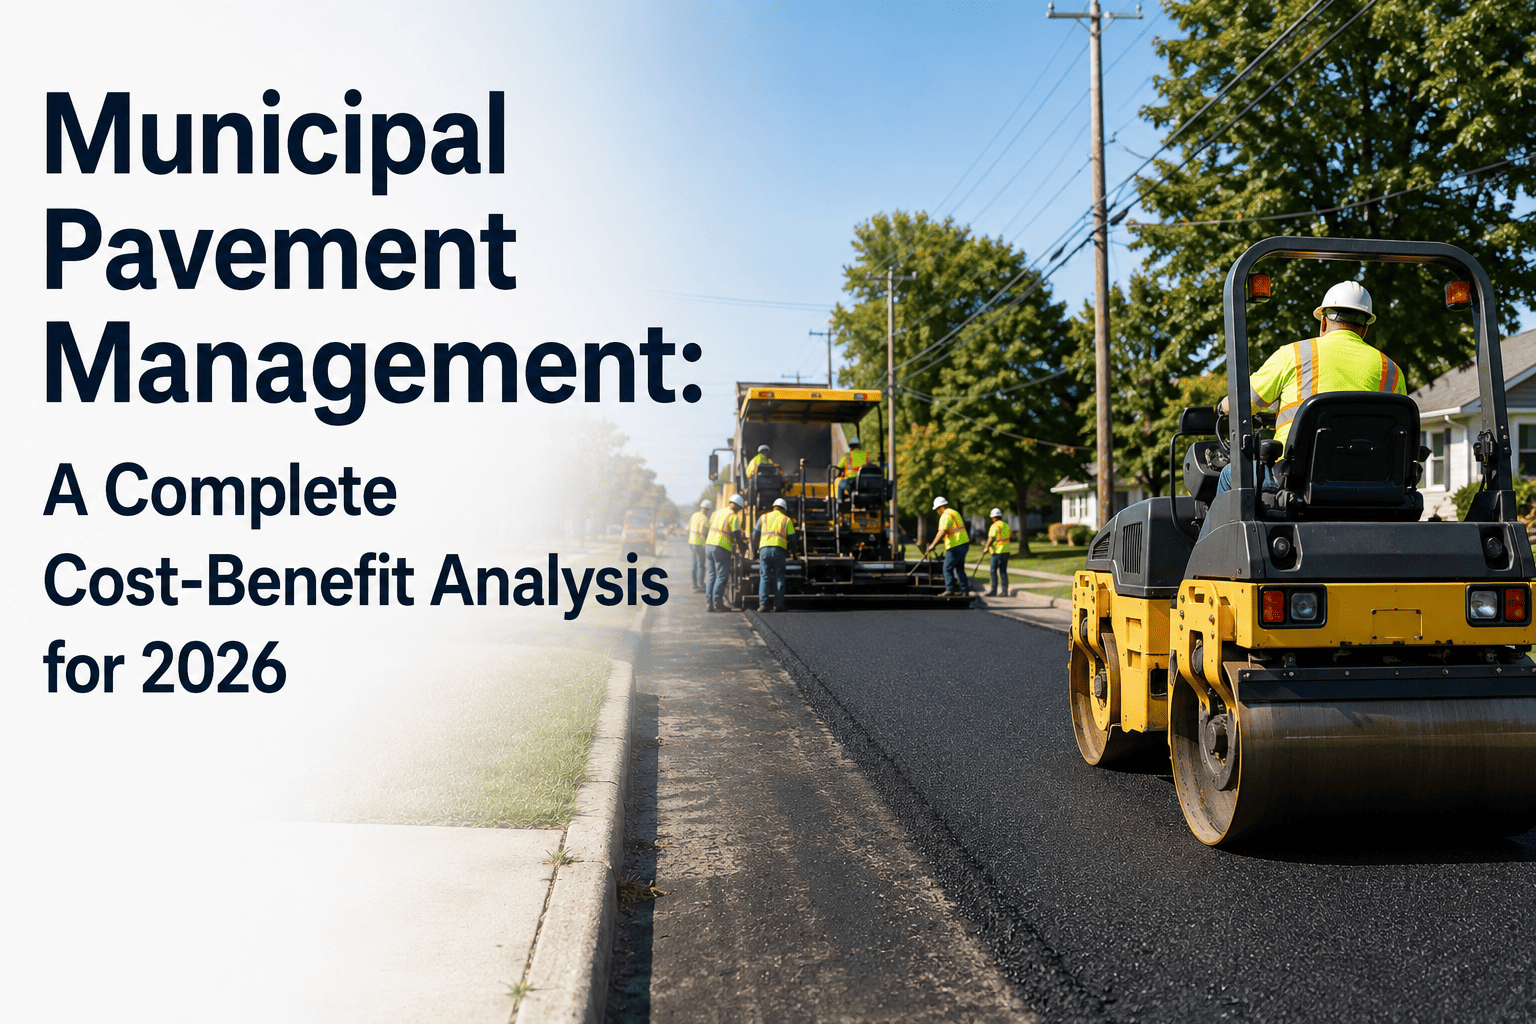
Municipal Pavement Management: A Complete Cost-Benefit Analysis for 2026
From crack sealing to full reconstruction — the financial framework every public works director needs to optimize pavement budgets, maximize PCI scores, and defend every dollar spent to council.
$1 : $7
Preservation investment vs reconstruction cost ratio
40%
Budget savings with proactive PCI-driven maintenance
PCI 55
The critical threshold — below this, rehab costs triple
The PCI Framework
Understanding Pavement Condition Index — The Foundation of Every Budget Decision
PCI scores range from 0 (failed) to 100 (perfect). The relationship between PCI and treatment cost is not linear — it is exponential. Acting at PCI 70 costs a fraction of waiting until PCI 40.
85–100
Excellent
Crack seal
$0.50–$1.50/sq yd
70–84
Good
Slurry seal / chip seal
$2–$5/sq yd
55–69
Fair
Thin overlay
$8–$18/sq yd
40–54
Poor
Mill and overlay
$25–$45/sq yd
0–39
Failed
Full reconstruction
$80–$150/sq yd
Strategy Comparison
Four Treatment Strategies — Cost, Lifespan, and ROI Compared
Not every road needs the same treatment. The goal is to match the right intervention to the right PCI window before the pavement degrades into the next cost tier.
| Treatment |
PCI Window |
Typical Cost |
Life Extension |
Cost per Extended Year |
CMMS Trigger |
| Crack Sealing |
75–100 |
$0.50–$1.50 / sq yd |
3–5 years |
~$0.30 / sq yd / yr |
Annual PM cycle + inspection |
| Slurry / Chip Seal |
65–80 |
$2–$5 / sq yd |
5–8 years |
~$0.55 / sq yd / yr |
PCI drop below 75 threshold |
| Thin Mill and Overlay |
50–68 |
$15–$28 / sq yd |
8–12 years |
~$2.00 / sq yd / yr |
PCI drop below 60 + traffic volume |
| Full Mill and Overlay |
40–55 |
$30–$50 / sq yd |
12–18 years |
~$2.75 / sq yd / yr |
PCI below 50 or structural failure |
| Full Reconstruction |
0–40 |
$80–$150 / sq yd |
20–30 years |
~$5.50 / sq yd / yr |
Structural failure, base failure |
OxMaint — Municipal Pavement CMMS
Stop losing budget to reactive paving. Start managing by PCI score.
OxMaint tracks PCI history, schedules preventive maintenance by road segment, generates council-ready budget reports, and helps public works directors prove ROI on every pavement dollar. See it live with your network data.
Budget Optimization
How CMMS-Driven Pavement Programs Stretch Municipal Budgets
Three proven budget optimization strategies that high-performing public works departments use when their pavement data lives in a CMMS rather than a spreadsheet.
01
Network-Level Prioritization
Rank every road segment by PCI score, traffic volume, and treatment urgency. Spend your limited budget on segments approaching the next cost tier — not the loudest complaint call this week.
Typical result: 25–35% more lane-miles treated per budget cycle
02
Treatment Bundling
Group adjacent road segments with similar PCI scores into single contractor mobilization zones. Contractor mobilization fees often represent 15–25% of total project cost — eliminating duplicate mobilizations compounds savings across the network.
Typical result: 12–18% cost reduction through bundled contracts
03
Multi-Year PCI Modeling
Project PCI deterioration curves 5–10 years forward to forecast when segments will cross cost-tier thresholds. Bring capital projects to council with defensible 10-year cost projections, not single-year snapshots.
Typical result: 20–30% better capital planning accuracy
Real Data
Municipal Pavement Program Benchmarks — 2026
Sourced from APWA, FHWA Local Roads program reports, and ASCE Infrastructure Report Cards. Use these benchmarks to evaluate your own program's performance.
Average US Municipal PCI
59
Just above the critical 55 threshold where rehab costs jump sharply
Cities with Formal PCI Program
38%
Only 38% of US municipalities track PCI systematically — the rest budget by complaint volume
Annual Budget per Lane-Mile
$4,200
Median for cities 50K–250K population; high performers achieve better PCI at lower cost through preservation
Deferred Maintenance Backlog
$420B
Total US municipal road deferred maintenance per ASCE 2025 Infrastructure Report Card
Expert Review
What Public Works Directors Are Saying
We went from budgeting by gut feel and resident calls to actually prioritizing by PCI score and cost-per-extended-year. In two budget cycles we treated 40% more lane-miles with the same appropriation, just by catching roads earlier in the deterioration curve before they needed mill-and-overlay instead of chip seal.
Director of Public Works
City of 85,000 residents — Mountain West region
Council kept cutting our pavement budget because we couldn't show them a 5-year projection with confidence. Once we had PCI trending data in a CMMS and could model what deferred maintenance would cost in years 3 through 7, the conversation completely changed. We got a 15% budget increase the following year.
City Engineer
Mid-size municipality, 60,000 population — Great Lakes region
FAQs
Frequently Asked Questions — Municipal Pavement Management
What PCI score triggers a mill-and-overlay versus full reconstruction decision?
The general industry threshold is PCI 40–55 for mill-and-overlay consideration, and below PCI 40 for full reconstruction evaluation. However, the decision also depends on base condition — a road with PCI 48 but severe base failure may require reconstruction, while a road at PCI 38 with intact base may respond to deep mill-and-overlay. A
CMMS that tracks both surface PCI and base condition notes gives engineers the complete picture to make the right call every time rather than relying on surface score alone.
How do cities justify pavement maintenance budgets to city council?
The most effective approach is presenting cost-per-extended-year data alongside PCI trend projections, showing council what deferred maintenance will cost in years 3–7 compared to acting now. FHWA's $1 preservation equals $7 reconstruction ratio is widely accepted as a defensible benchmark. Cities using a pavement CMMS can generate automated reports showing network-wide PCI trends, budget efficiency metrics, and treatment ROI — making council presentations data-driven rather than anecdotal.
Book a demo to see OxMaint's council-ready reporting tools.
How often should municipalities inspect and score pavement conditions?
FHWA recommends PCI inspections every 2 years for arterials and collectors, and every 3–4 years for residential streets. High-traffic arterials in northern climates with heavy freeze-thaw cycling may warrant annual inspection given their faster deterioration rate. The inspection schedule should be stored and tracked in a CMMS so no segment falls out of the inspection cycle — a common failure point in cities that rely on spreadsheets without automated scheduling reminders for field crews.
What is the ROI of implementing pavement management software for a mid-size city?
Cities with 200–800 centerline miles typically see full ROI on pavement CMMS implementation within 12–18 months through better treatment timing, reduced contractor mobilization costs via bundling, and avoided reactive emergency repairs. The larger the deferred backlog, the faster the ROI — because even modest improvements in preservation timing compound across hundreds of lane-miles.
OxMaint's pavement management module includes built-in ROI modeling tools so public works directors can calculate their specific return before the first project is let.
Get Started Today
Your pavement network loses value every day without a PCI-driven plan.
OxMaint helps public works departments track PCI scores, schedule the right treatment at the right time, and generate the budget justification data that wins council approval. Schedule a demo tailored to your network size and budget constraints.