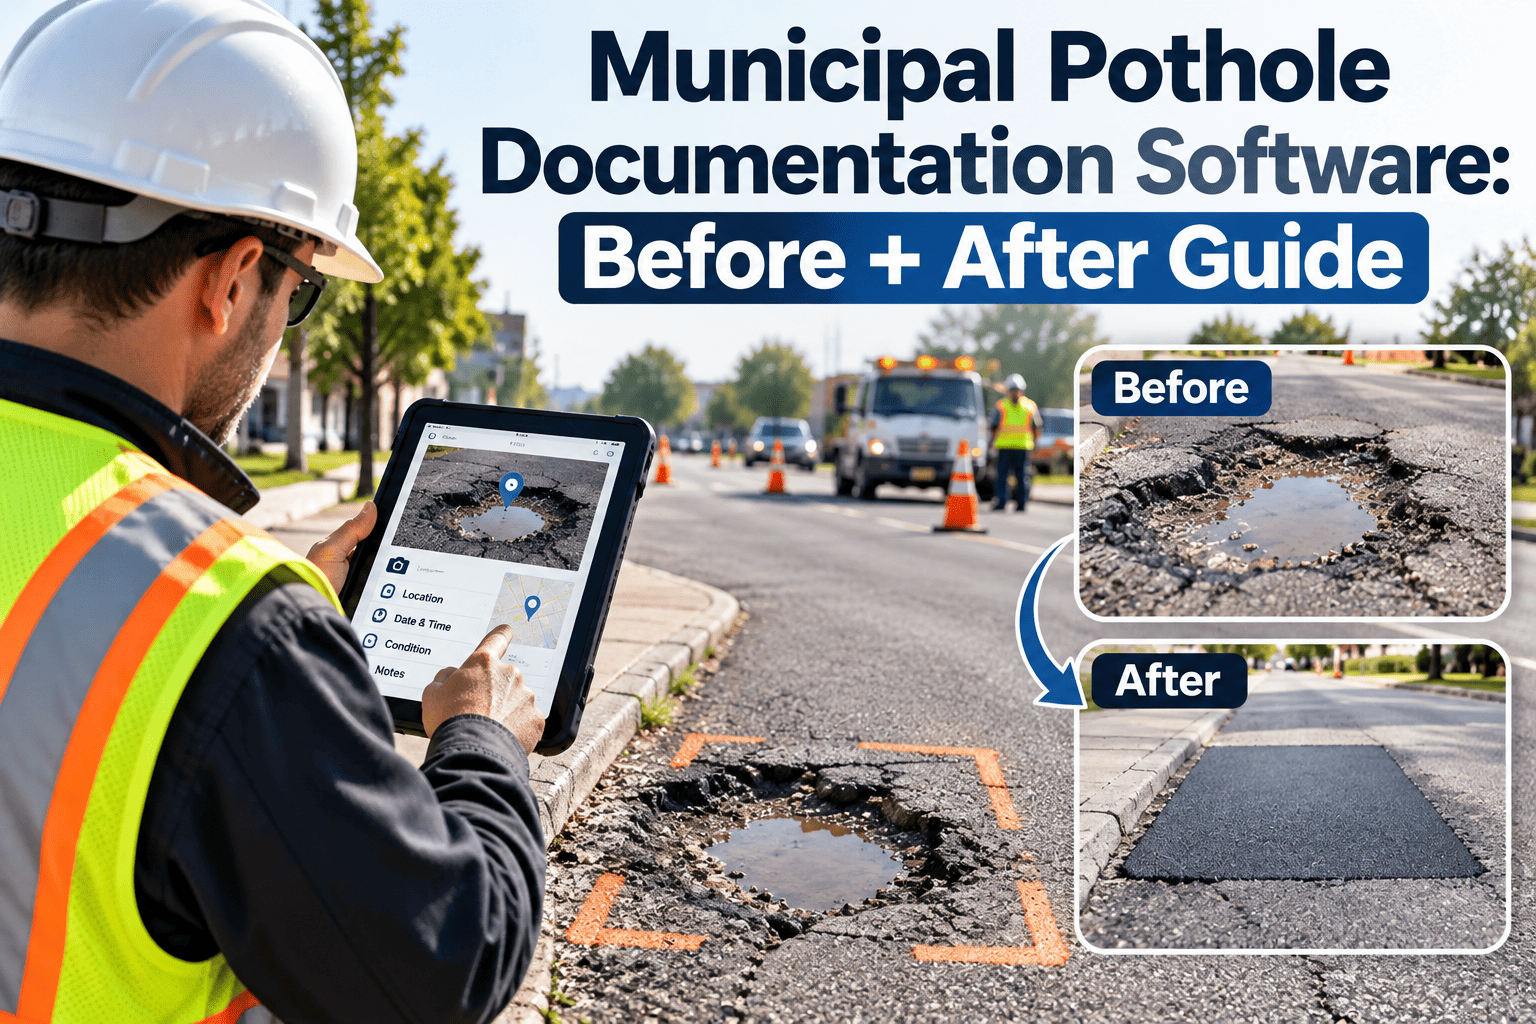
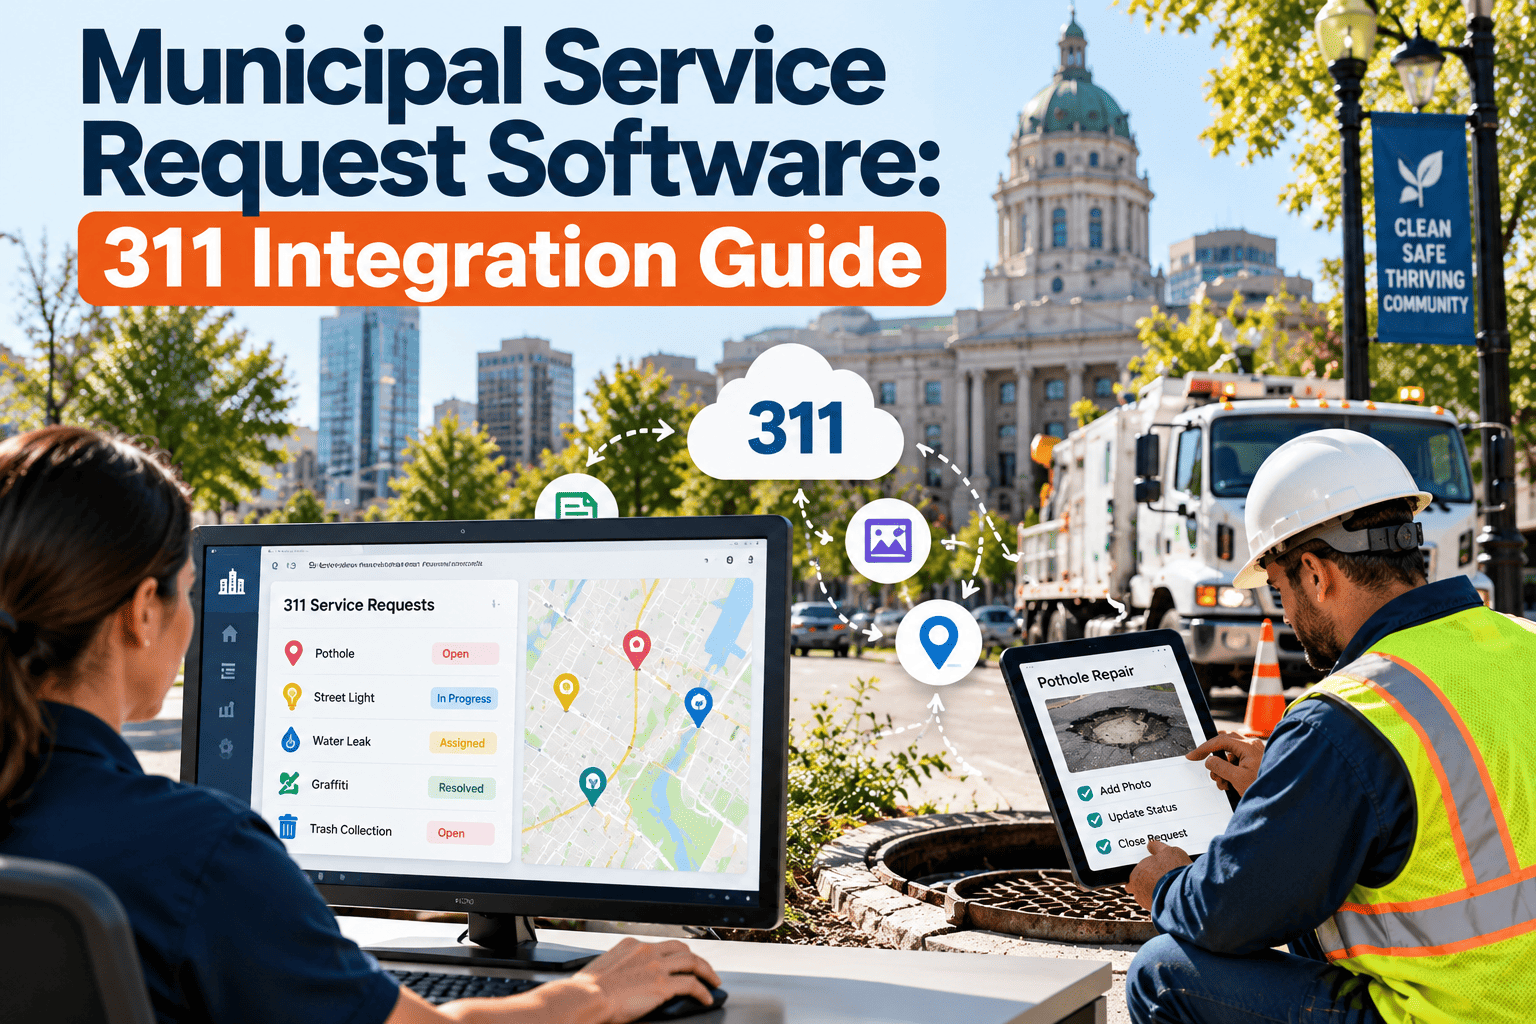
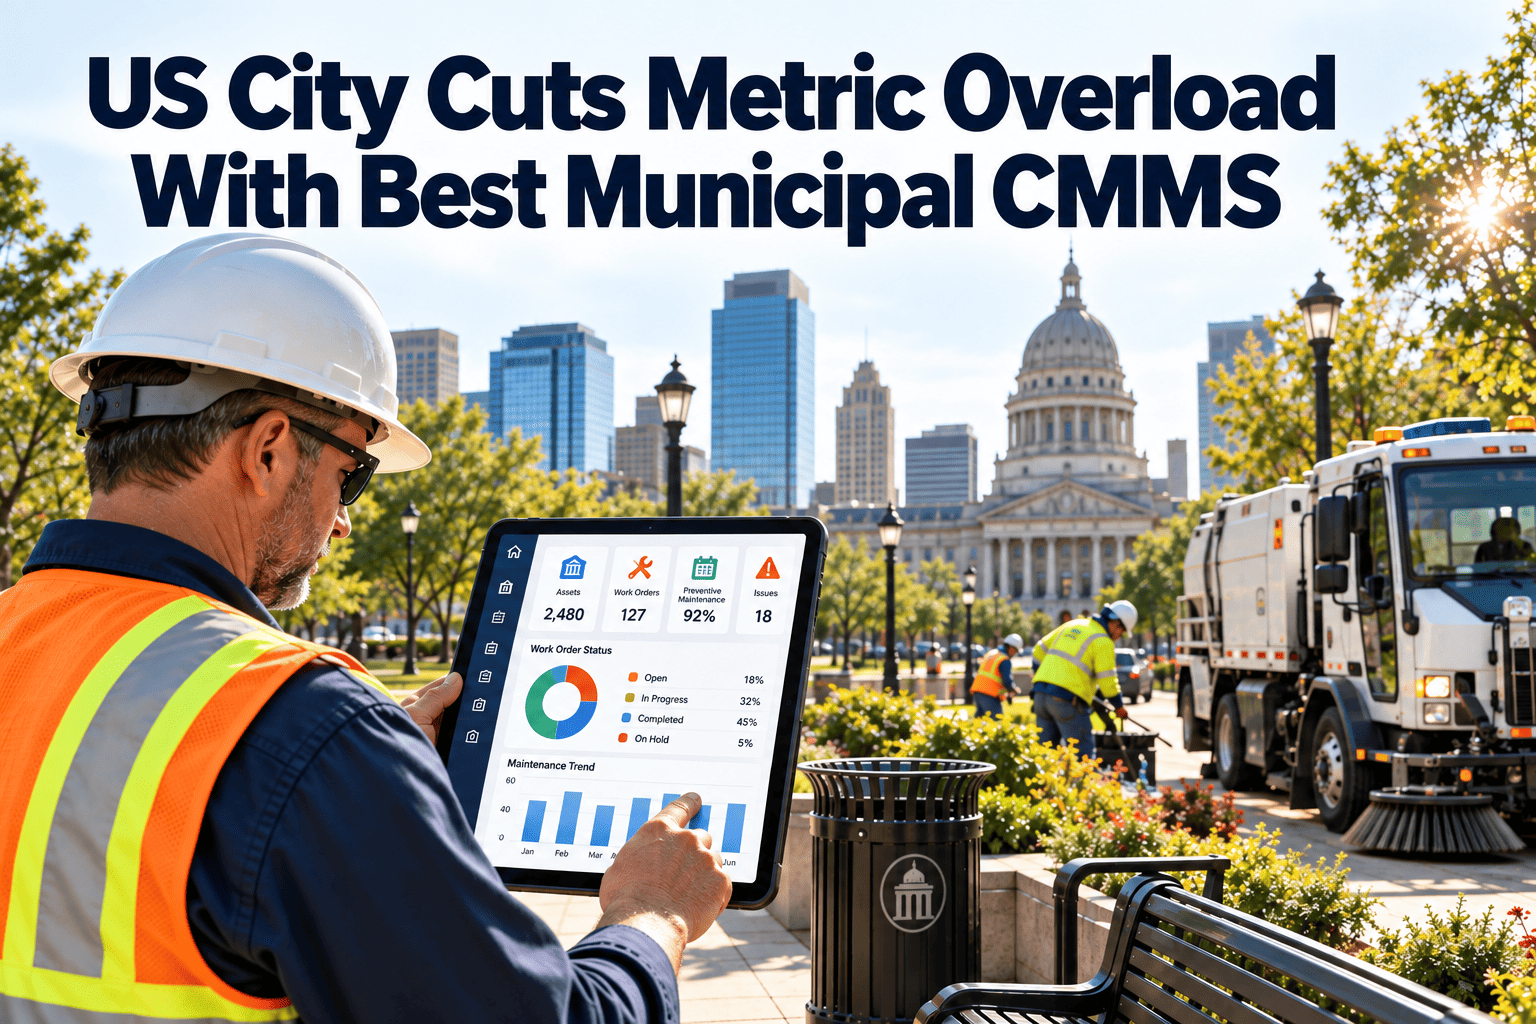
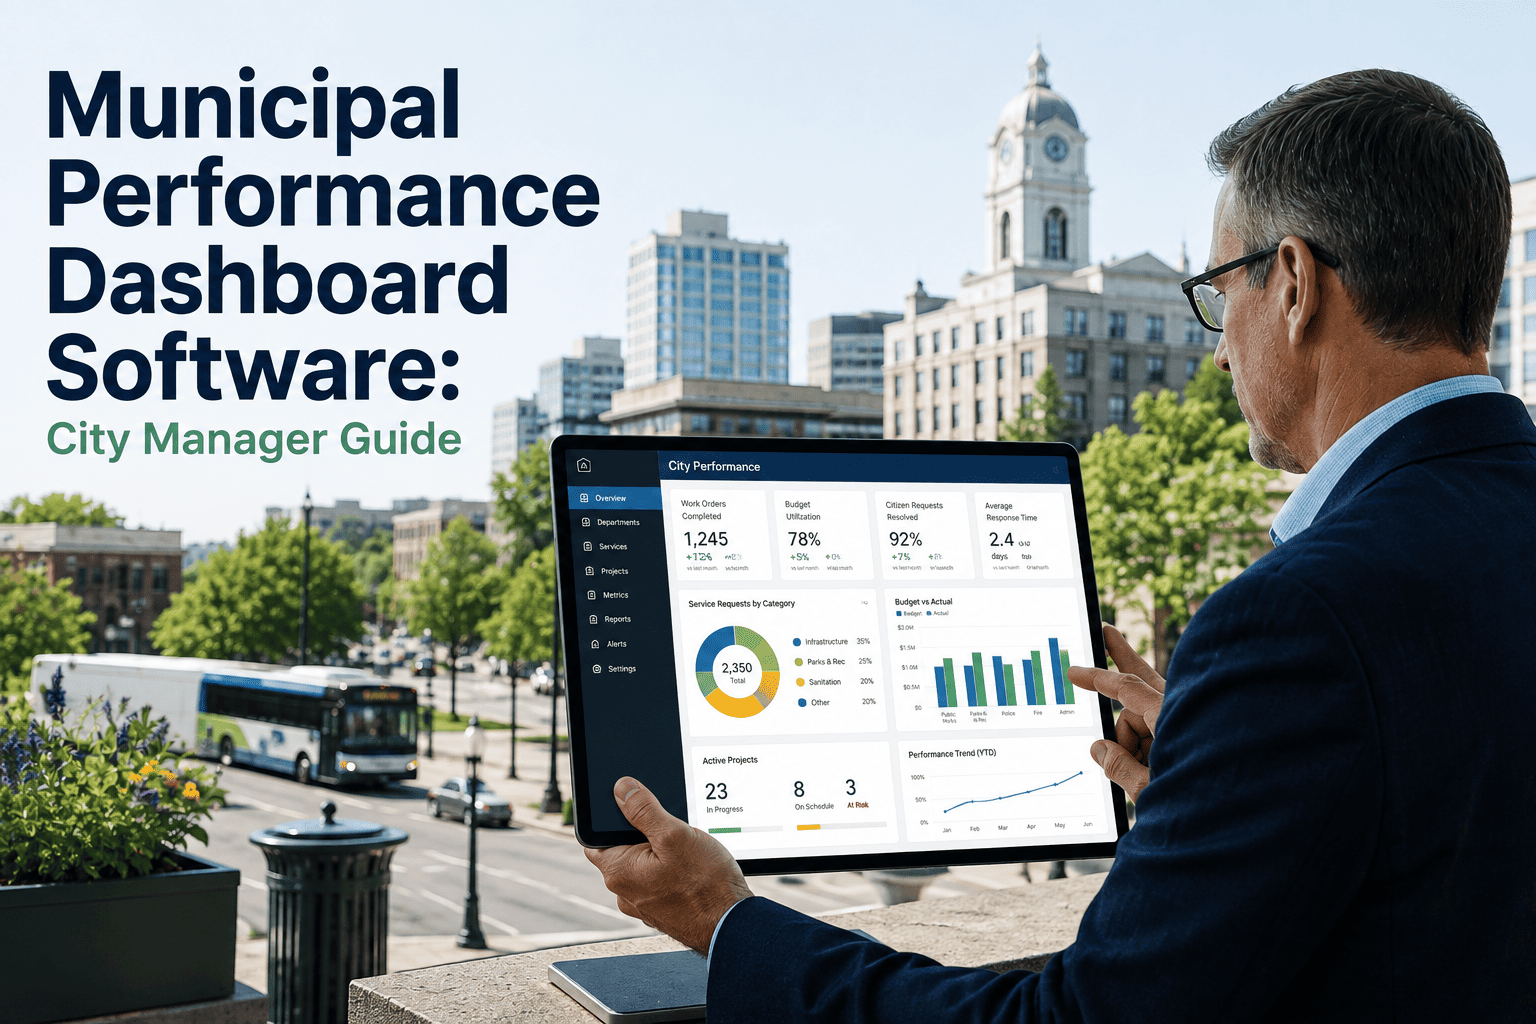
A city council member holds up a stack of pothole complaints at a public meeting and asks why the road crew keeps patching the same three blocks while a nearby arterial street, rated as failing in last year's pavement survey, sits untouched. The uncomfortable answer is usually that the pavement condition survey and the pothole work order system have never actually talked to each other — one lives in a consultant's spreadsheet updated every few years, the other lives in whatever tracking tool public works uses day to day, and nobody has connected the two. Cities that link PCI, IRI, and pothole density data inside a single CMMS stop reacting to the loudest complaint and start repairing the streets that are actually failing fastest. Book a demo to see what that integration looks like for a public works department.
Municipal Infrastructure — 2026 Edition
Connect PCI, IRI, and Pothole Data Into One Pavement Record
Pavement Condition Index surveys, International Roughness Index readings, and daily pothole reports each tell part of the story, but only when they live in the same system can a public works department prioritise repairs by actual road failure rather than by complaint volume.
Pavement Condition Index (PCI) Scale
Failed
Poor
Fair
Good
Excellent
040557085100
3Core data sets linked into one pavement record
FHWAReporting format ready for federal compliance
Network-WideEvery street segment scored and ranked consistently
AutoPothole reports mapped back to survey segments
Why Pavement Data Lives in Silos Across City Departments
Most municipalities already collect the data needed to manage pavement well — they simply collect it in three separate places that were never designed to talk to each other. A pavement condition survey, whether done by a contracted inspection vehicle or a manual windshield survey, produces a PCI score for each street segment every one to three years. Ride quality data from an IRI sensor, when a city has it at all, usually comes from a separate capital planning study. Meanwhile, day-to-day pothole reports flow in through a citizen hotline or app, landing in whatever work order system public works happens to use, disconnected from either of the other two data sets.
The practical result is that a city can have a segment scored as structurally failing in its PCI survey, generating a steady stream of pothole complaints that never get cross-referenced back to that survey, while a nearby street with a handful of vocal residents gets prioritised instead simply because its complaints are louder and more recent. Over a multi-year capital planning cycle, this mismatch compounds, and streets that should have been reconstructed years earlier are still being patched one pothole at a time.
Three Data Sets Every City Already Has
PCI — Pavement Condition Index
Typical Source: Periodic pavement condition survey
A 0-100 score reflecting visible surface distress — cracking, rutting, and patching — collected on a multi-year cycle for each street segment.
IRI — International Roughness Index
Typical Source: Vehicle-mounted roughness sensor
A ride quality measurement that captures how rough a road feels to drive, independent of visible surface distress captured by PCI alone.
Pothole Density
Typical Source: Citizen reports and daily work orders
The frequency of reported and repaired potholes per segment, often the earliest real-time signal that a segment's condition is worsening.
Stop Prioritising Repairs By Complaint Volume Alone
Oxmaint AI links PCI surveys, IRI readings, and pothole work orders into one segment-level pavement record for your entire network.
Disconnected Data vs. an Integrated Pavement Record
The difference between a city working from three disconnected data sources and one working from a single integrated record shows up clearly once the two are compared side by side.
Disconnected Data
PCI survey results sit in a spreadsheet updated once every few years by an outside consultant.
Pothole reports are logged by address with no link back to a specific surveyed segment.
Capital planning decisions rely on staff memory of which streets "seem bad" this year.
FHWA and state reporting requires manually reassembling data from multiple sources each cycle.
Integrated Pavement Record
PCI and IRI scores are stored against each segment inside the same CMMS used for daily work orders.
Every pothole report is automatically mapped to its surveyed segment, updating a live density count.
Capital planning is based on a ranked list combining condition score, ride quality, and complaint trend.
Compliance reports export directly in the format needed for federal and state pavement reviews.
What FHWA-Aligned Pavement Reporting Requires
Federal and state pavement management guidance generally expects a consistent, network-wide condition score paired with a clear methodology for how that score was derived and how repair priorities were set. Meeting that expectation is far easier when the underlying data is already connected rather than assembled freshly for each reporting cycle.
| Reporting Requirement | Data Needed | Where It Typically Lives |
| Network condition summary |
PCI score per segment, network-wide |
Pavement survey dataset, ideally in the CMMS |
| Ride quality trend |
IRI readings over time by segment |
Vehicle sensor data, often a separate study |
| Repair prioritisation logic |
Combined PCI, IRI, and complaint trend ranking |
Rarely combined without manual spreadsheet work |
| Maintenance history per segment |
Work order records tied to a specific location |
Public works CMMS or ticketing system |
The Pavement Data Integration Maturity Model
Most cities sit somewhere on a four-level path between fully disconnected pavement data and a fully integrated, reporting-ready record. Recognising which level a department is currently at makes it easier to plan the next practical step rather than attempting to jump straight to full integration.
Level 1
Disconnected — PCI survey, IRI data, and pothole reports each live in separate, unrelated files.
Level 2
Manually Linked — Staff periodically cross-reference data sets by hand for capital planning.
Level 3
Systematically Integrated — Pothole reports auto-map to surveyed segments inside one CMMS.
Level 4
Reporting-Ready — Ranked repair priorities and compliance exports generate automatically.
Find Out Where Your Pavement Data Stands Today
Most departments move up one maturity level within a single budget cycle once PCI, IRI, and pothole data share a system.
What Changes Once Pavement Data Is Connected
Linking these three data sets does more than tidy up a spreadsheet — it changes which streets get funded first and how confidently a department can defend that choice to a city council or a federal auditor.
Defensible Prioritisation
Repair rankings are backed by combined condition, ride quality, and complaint data rather than which resident called most recently.
Faster Compliance Reporting
Network condition summaries export directly from the CMMS instead of being rebuilt from scratch each reporting cycle.
Earlier Failure Detection
A rising pothole density on a segment flags a possible condition decline well before the next scheduled PCI survey.
Rolling Out Pavement Data Integration
Moving from disconnected data to a reporting-ready record works best as a phased effort tied to an existing budget or survey cycle rather than a single system overhaul.
Integration Rollout Plan
From separate spreadsheets to one reporting-ready pavement record
01
Data Inventory
Locate the current PCI survey, IRI data if it exists, and the pothole work order system in use today.
02
Segment Mapping
Match each data source to a consistent set of street segment identifiers so records can be joined reliably.
03
CMMS Integration
Load PCI and IRI scores into the CMMS and connect the pothole reporting workflow to the same segment records.
04
Prioritisation Rules
Set a ranking formula combining condition score, ride quality, and complaint trend for capital planning.
05
Automated Reporting
Generate network condition summaries and compliance exports directly from the integrated record each cycle.
Build a Pavement Record That Survives Budget Season
See how PCI, IRI, and pothole data come together into one ranked repair list your council and your auditors can both trust.
Expert Perspective: Public Works Directors on Pavement Integration
For years our pavement condition survey and our pothole tracking system were two completely separate worlds, and every budget season we rebuilt the connection between them by hand from three different spreadsheets. Once we brought PCI, IRI, and pothole density into the same system, our capital plan finally reflected which streets were actually failing rather than which ones generated the most calls that quarter. It also cut our federal reporting prep time from weeks to a couple of days.
— Director of Public Works, Mid-Size City Department
3
Data sets unified into one pavement record
Days
Compliance report prep time, down from weeks
Ranked
Repair list backed by condition and complaint data
Defensible
Capital plan council members can actually question
Frequently Asked Questions
What is the difference between PCI and IRI?
PCI measures visible surface distress like cracking and patching on a 0-100 scale, while IRI measures ride roughness. A segment can score reasonably on one and poorly on the other.
Do small cities without IRI data need to wait to integrate?
No. PCI and pothole density alone already improve prioritisation significantly.
Try it free to see how a two-data-set integration works before adding IRI later.
How does pothole density feed back into PCI scoring?
Pothole density does not replace a formal PCI survey, but a rising trend on a segment is a strong early signal that its next survey score is likely to have dropped.
Can this integration help with FHWA reporting specifically?
Yes. Having condition, roughness, and maintenance history together in one system makes it far easier to produce the network-wide summaries most federal and state reviews expect.
How long does a typical integration take for a mid-size city?
Most departments complete segment mapping and initial CMMS integration within a few weeks.
Book a demo to scope a timeline for your network size.
Pavement management does not fail because cities lack data — it fails because the data they already collect never gets to sit in the same place at the same time. Bringing PCI, IRI, and pothole density together does not require a new survey program, only a system built to hold all three and use them together when it is time to decide which street gets fixed next.
Give Every Street Segment One Complete Record
Oxmaint AI connects PCI, IRI, and pothole density into a single, FHWA-aligned pavement record your whole department can plan around.