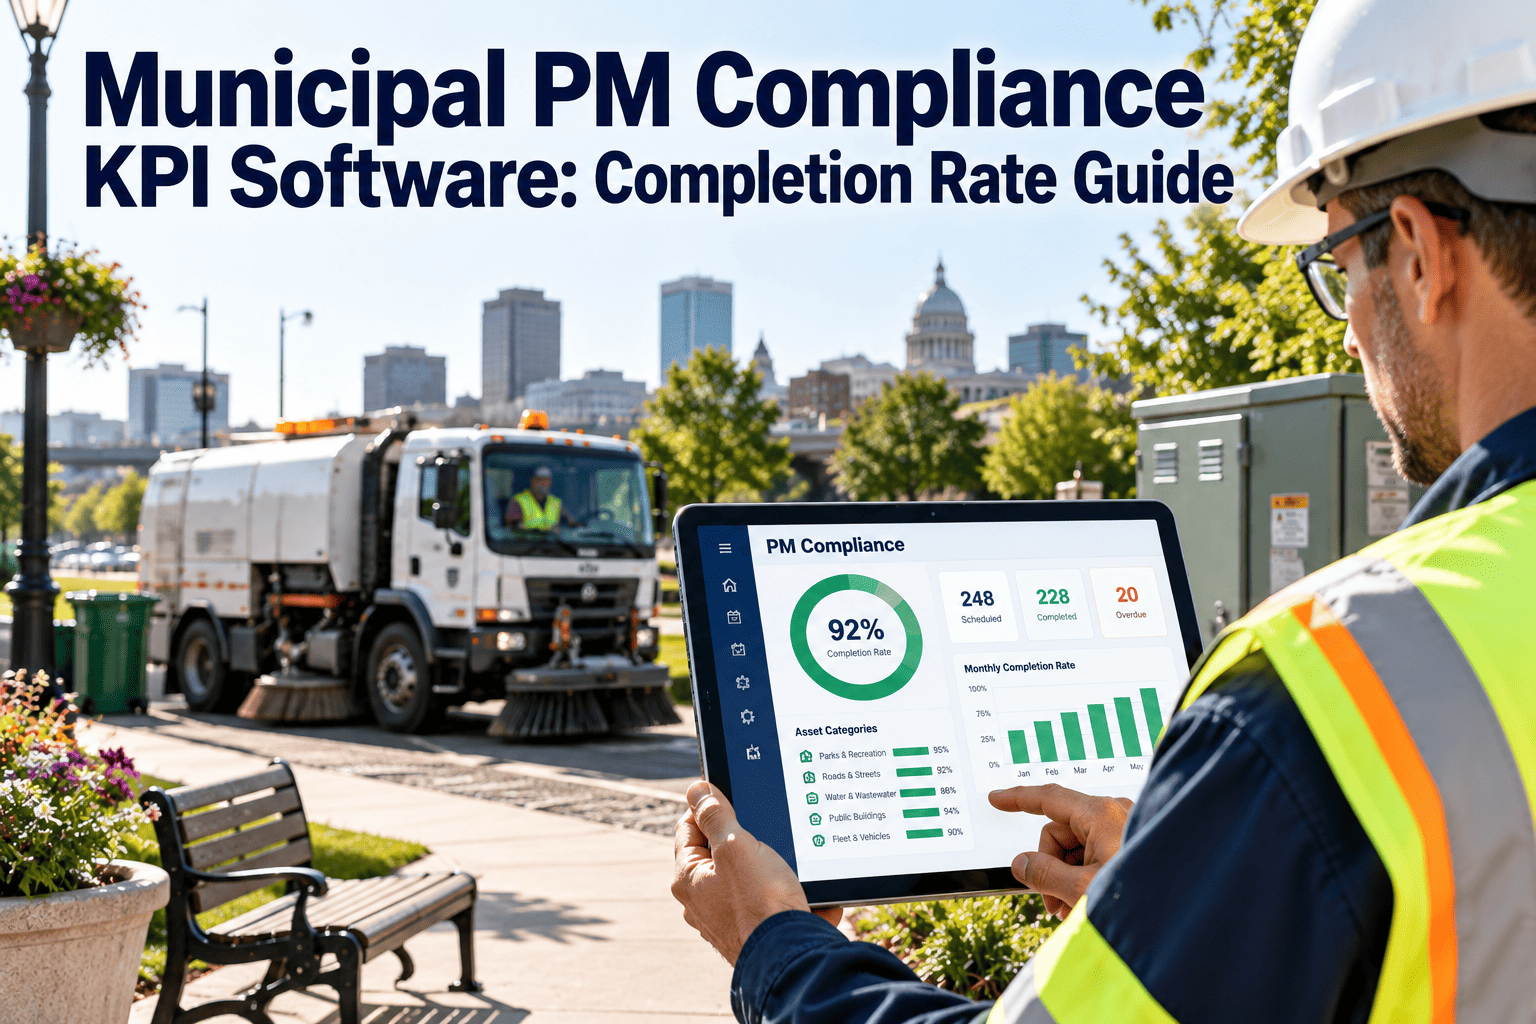
A city that tracks one reliability number above all others usually tracks PM compliance rate — the share of scheduled preventive maintenance completed on time across fleet, facilities, water, streets and parks. It sounds like a simple percentage, but for most municipalities it is the single clearest signal of whether maintenance is actually running the program or the program is running on hope. Getting that number right, and improving it, is where a CMMS built for public works earns its keep long before any bigger reliability initiative gets off the ground.
Turn PM compliance from a guess into a tracked, defensible completion rate
See scheduled-versus-completed preventive maintenance by asset class, division and technician — and fix the gaps before they become breakdowns.
What PM compliance rate actually measures
PM compliance rate is the percentage of preventive maintenance tasks completed within their scheduled window, out of all PM tasks scheduled for that period.
A division scheduled 420 PM tasks in a quarter and completed 357 within their due window: 357 ÷ 420 = 85% compliance for that period.
Reliability-focused organizations generally treat 85–90% and above as a solid target, with best-in-class programs running higher on their most critical assets. What counts as "on time" varies by policy — some cities allow a grace window of a few days past the due date, others count anything past the scheduled date as non-compliant.
Why municipal PM compliance runs lower than public works wants it to
Cities rarely miss PM targets because crews do not care. The compliance gap almost always traces back to how work gets scheduled, assigned and tracked in the first place.
Paper-based or spreadsheet PM calendars
When PM due dates live in a spreadsheet no one updates in real time, overdue tasks quietly accumulate until someone notices a breakdown that should have been prevented.
Reactive work crowds out scheduled work
A crew pulled to handle an emergency repair rarely gets the PM backlog rescheduled properly, so the missed task disappears rather than getting rebooked.
No single owner for the number
When PM compliance is not reported by division or technician, no one is individually accountable for it, and it drifts without anyone deciding to let it drift.
Staffing shortages across departments
Fleet, facilities and water divisions competing for the same limited technician pool often push PM tasks to "whenever there's time" — which frequently means never.
PM compliance targets vary by what is actually at risk
Not every asset class carries the same consequence for a missed PM, so a single citywide target usually undersells the risk on critical infrastructure and oversells it on low-priority equipment.
| Asset class | Typical PM interval | Consequence of a missed PM | Reasonable compliance target |
|---|---|---|---|
| Fire and EMS fleet | Monthly / mileage-based | Vehicle out of service during an emergency response | 95%+ |
| Water/wastewater pump stations | Weekly to monthly | Service interruption, regulatory exposure | 90–95% |
| General fleet (public works, parks) | Mileage or hours-based | Unplanned downtime, higher repair cost | 85–90% |
| HVAC and building systems | Quarterly / seasonal | Occupant complaints, energy waste | 85–90% |
| Traffic signals and streetlights | Semi-annual | Public safety risk at intersections | 90%+ |
| Parks and recreation equipment | Seasonal | Reduced facility availability | 80–85% |
What changes when PM compliance is tracked in a CMMS instead of a spreadsheet
Spreadsheet-driven PM tracking
- Due dates calculated manually and easy to miscalculate
- Overdue PMs discovered by accident, not by alert
- Compliance rate is a quarterly guess, not a live number
- No visibility into which technician or division is behind
- Reactive repairs and PM backlog compete with no clear priority
CMMS-driven PM tracking
- PM schedules auto-generate from meter, calendar or usage triggers
- Overdue tasks surface automatically on a dashboard, not by accident
- Compliance rate updates in real time as work orders close
- Reporting breaks down by asset class, division and technician
- Reactive work is logged separately so PM backlog stays visible
Stop estimating PM compliance and start measuring it
Automate PM scheduling and get a live completion-rate dashboard across every division running on Oxmaint.
Five steps to raise PM compliance without adding headcount
Most compliance gains come from fixing how work is scheduled and surfaced, not from hiring more technicians.
Measure the current rate by division
Pull the last two quarters of scheduled-versus-completed PM data by asset class so the starting point is a real number, not an impression.
Set targets by criticality, not one flat number
Give emergency fleet and life-safety systems a higher target than low-consequence equipment so effort goes where the risk actually is.
Move PM triggers into the CMMS
Calendar, meter and usage-based triggers generate work orders automatically, removing the manual step where PMs most often get forgotten.
Put overdue PMs on a dashboard everyone sees
A visible, shared overdue list creates natural accountability that a private spreadsheet never does.
Report compliance by technician monthly
Regular review at the technician and division level turns the metric into a habit rather than a once-a-year budget-season exercise.
The KPIs that give PM compliance context
PM compliance rate on its own can mislead if it is not read alongside a few companion metrics.
Planned vs. reactive work ratio
A high PM compliance rate alongside a high reactive-work share suggests PMs are being completed but not preventing failures.
Mean time between failures
Rising MTBF alongside improved PM compliance is the clearest sign the program is actually working.
PM backlog age
Tracks how long overdue PMs sit unaddressed, separate from the compliance percentage itself.
Wrench time
Share of a technician's shift spent on actual maintenance work versus travel, paperwork or waiting on parts.
Cost of unplanned downtime
Connects PM compliance to a dollar figure department heads and council members recognize immediately.
Technician PM completion rate
Individual-level compliance data that supports coaching conversations, not just departmental reporting.
Scheduling, mobile completion and reporting in one place
Oxmaint generates PM work orders automatically from calendar, meter or usage triggers across fleet, facilities, water and parks assets, so scheduling never depends on someone remembering to look at a calendar.
Field technicians complete PM checklists from a mobile device, so completion timestamps are captured the moment the work is done rather than back-entered days later. Dashboards break PM compliance down by asset class, division and individual technician, with overdue tasks flagged automatically instead of discovered during an audit. Departments looking to raise their compliance rate without adding staff can book a demo to see how automated scheduling and mobile completion work together on a real asset list.
Municipal PM compliance KPI — frequently asked questions
What is considered a good PM compliance rate for a municipality?
Most reliability programs target 85–90% or higher, with critical assets like emergency fleet and life-safety systems held to a stricter standard, often 95% or above.
Should PM compliance be measured citywide or by department?
Both, but department and asset-class breakdowns matter more operationally since a strong citywide average can hide a struggling division. Get started tracking it at that level.
What counts as "on time" for a preventive maintenance task?
Policies vary — some cities allow a short grace period past the due date, while others count anything completed after the scheduled date as non-compliant. The definition should be fixed and consistent so trend data stays comparable.
Does a high PM compliance rate guarantee fewer breakdowns?
Not on its own — it needs to be read alongside MTBF and the planned-versus-reactive work ratio to confirm the PMs being completed are the ones actually preventing failures.
How quickly can a city improve a low PM compliance rate?
Automating scheduling and adding a visible overdue-task dashboard typically shows measurable improvement within one to two reporting quarters, since most of the gap comes from missed or forgotten tasks rather than capacity limits.
Get a PM compliance number your next budget review can rely on
Automate scheduling, track completion by technician, and see the compliance rate update in real time.