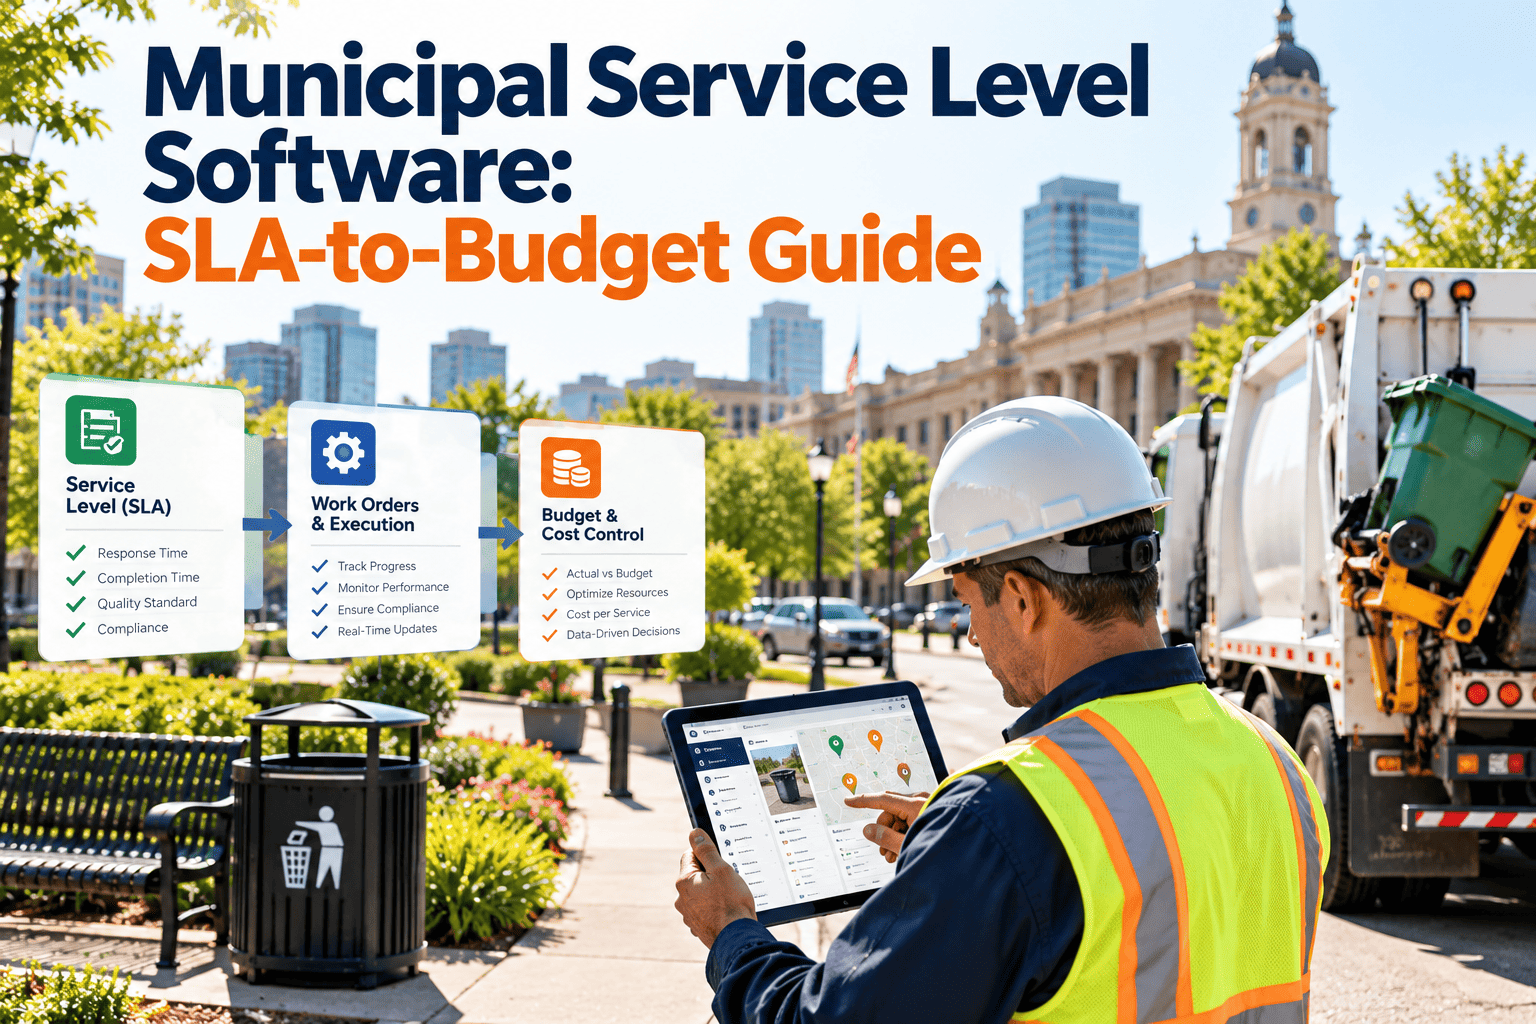
Councils adopt service levels in policy documents, while finance builds budgets from last year's totals, and the two rarely meet. Potholes are supposed to be filled within a set time, streets are supposed to be swept on a cycle, and pavement is supposed to hold a target condition, yet the budget line seldom shows what those promises cost. Maintenance software closes that gap by recording the real labor, equipment, and material behind every service. This guide shows how to define measurable service levels, cost them from work order data, and present the trade-offs clearly using a municipal CMMS.
Municipal Service Level Software: Linking SLAs to Budget Line Items
A service level only means something once someone has costed it. Connect PM cycles, response times, and street condition targets to the dollars that fund them.
Three Views of the Same Service
Ask council, finance, and public works about street sweeping and you will hear three different answers. That gap is where service levels lose their meaning.
| Service | What policy promises | What the budget shows | What crews experience |
|---|---|---|---|
| Pothole repair | Reported potholes are fixed promptly | One repair line sized on last year's spend | Requests spike after winter, but crew hours do not |
| Street sweeping | Streets are swept on a regular cycle | A contract or crew allocation with no tie to route length | Cycles stretch when equipment is down or staff are reassigned |
| Pavement condition | Streets are kept in good condition | A resurfacing amount with no condition target attached | Preservation is deferred until major rehabilitation is needed |
| Storm inlet cleaning | Drainage is kept clear | A general maintenance allocation | Cleaning follows complaints and storm events |
| Signs and markings | Regulatory signs stay visible | Small supply and labor lines | Replacement follows crashes and complaints, not inspection |
Anatomy of a Measurable Service Level
A service level that cannot be measured cannot be budgeted. Every one needs four parts.
Activity
The work itself, such as filling a pothole or sweeping a street
Quantity or condition
How much, how often, or what standard results
Timing
How fast to respond or how long between cycles
Scope
Which streets, classes, or assets are covered
Service tiers make the cost of ambition visible
| Element | Basic | Standard | Enhanced |
|---|---|---|---|
| Pothole response | Repairs as crews are available | Defined window for arterial and collector streets | Defined windows for all street classes plus proactive inspection |
| Street sweeping | Seasonal or complaint-based | Regular cycle on main routes | Regular cycles on all routes with added seasonal passes |
| Crack sealing | Only on failing streets | Scheduled program on selected streets | Network-wide preservation program |
| Condition goal | Slow decline accepted | Network condition held steady | Network condition improved over time |
| Budget effect | Lower spend now, larger backlog later | Predictable annual workload | Higher spend, lower long-term rehabilitation demand |
Tier descriptions are examples. Use the wording and targets your council has adopted.
Turn Service Promises Into Numbers You Can Defend
Record labor, equipment, and materials on every work order so each service has a real cost per unit.
Street Quality: From a PCI Target to Dollars
The Pavement Condition Index, defined in ASTM D6433, rates pavement from 0 to 100 based on observed distress. It gives councils one number to target and lets staff convert that target into treatment quantities.
Converting a condition target into a funding gap
- Record the current condition of each street class from inspection data
- Set the target condition for each class with council
- Choose the treatments needed to reach it, from preservation to reconstruction
- Multiply quantities by unit cost from completed work orders
- Compare the total with current funding to expose the gap
Condition generally declines slowly at first and then faster, which is why timely preservation usually costs less per square yard than later rehabilitation.
Reporting Rules That Reinforce Budget Discipline
Governments that report infrastructure under the modified approach of GASB Statement No. 34 must show assets are kept at an established condition level, supported by an asset management system and periodic assessments.
Building the Line Item: The Cost Layers
A defensible line item is built from layers, each traceable to recorded work.
| Cost element | Recorded in the CMMS as | Common blind spot |
|---|---|---|
| Labor | Hours logged on each work order by crew member | Travel and standby time never recorded |
| Equipment | Equipment hours or usage per job | Fleet costs tracked outside maintenance |
| Materials | Inventory issues against the work order | Bulk material charged to a general account |
| Contractors | Vendor cost and scope on the work order | Invoices not linked to the service delivered |
| Backlog | Open and deferred work by age and asset class | Deferred work hidden by reclassifying it |
PM Cycles and Response Times as Budget Drivers
Two calculations do most of the work. One prices scheduled tasks, and the other sizes crews to meet a response target.
PM workload
Assets in scope, times visits per year, times hours per visit, times loaded labor rate.
Response capacity
Expected requests times hours per repair, divided by productive hours per crew-day, gives crew-days needed.
Cost per unit
Labor plus equipment plus materials plus contractors, divided by units completed.
Size response targets on historical demand, including seasonal peaks, and add realistic travel time.
The SLA Catalog: Every Service Mapped to Data and Dollars
A catalog ties each service level to the data that proves it and the budget line that pays for it.
| Service | Measurable level | Data from the CMMS | Budget line fed |
|---|---|---|---|
| Pothole repair | Repair within a set window by street class | Report time, completion time, materials, crew hours | Street maintenance labor and asphalt materials |
| Street sweeping | Cycle length per route | Route completion dates, equipment hours | Sweeping labor, equipment, and disposal |
| Pavement preservation | Lane-miles treated per year and target PCI | Treatment records and inspection results | Preservation program and contracts |
| Storm inlet cleaning | Percentage of inlets cleaned per cycle | Inlet inventory and cleaning records | Drainage maintenance |
| Sign maintenance | Regulatory sign replacement within a set window | Inspection findings and repair orders | Traffic operations supplies and labor |
What Each Budget Decision Really Buys
Every reduction has a consequence that shows up in the data. Put it on the table before the vote, not after the complaints.
Illustrative cause and effect. Use your own work order history to size each one.
A Budget Cycle That Uses Real Data
Timing depends on your fiscal year, but the sequence stays the same.
Look back
Pull actual labor, materials, and contractor costs by service and compare them with attainment.
Model
Price each service tier using cost per unit and expected volumes, including backlog.
Present
Show council the cost of each tier and what changes if funding moves up or down.
Track
Report attainment and spend on a set schedule so mid-year adjustments rest on facts.
A Council Report Page Worth Reading
Keep it to one page. Show attainment and cost side by side so decisions connect the two.
Sample layout only. No data is shown.
Readiness Checklist Before Adopting SLAs
- Each service has one owner and one written definition
- Targets can be measured from work order data
- Streets and assets are inventoried with location and class
- Labor, equipment, and materials are recorded on every work order
- Cost per unit is calculated for each core service
- Backlog is tracked and reported openly
- Budget lines map to services, not only to cost types
- Council reports show attainment and cost together
How Oxmaint Supports the Chain
Asset management
Street segments, inlets, signs, and equipment held in one register with class and location.
Preventive maintenance
Scheduled cycles that show planned workload before the budget is set.
Work orders and mobile
Crews record time, materials, and photos in the field so cost data is captured at the source.
Inventory and reporting
Material usage and dashboards that support cost per unit and service reporting.
Frequently Asked Questions
What is a municipal SLA in maintenance?
It is a measurable commitment for a service, such as a response time, cycle length, or condition target, that staff report against.
How does a CMMS connect SLAs to budget?
Work orders capture labor, equipment, and materials by service, so a CMMS can price each service level.
What data do we need first?
An inventory of streets and assets, plus a few months of consistent work order records.
Do we need PCI to set street targets?
Not strictly, but a condition index gives councils one common number for setting and defending targets.
Can I see this using my own services?
Yes. Schedule a walkthrough and bring your service list.
Show Council What Every Service Level Costs
Link PM cycles, response times, and street condition targets to the budget lines that fund them.