Municipal governments lose an estimated 23% of their annual maintenance budgets to reactive repairs, unplanned emergency work orders, and deferred preventive maintenance that compounds into capital replacement costs. Finance directors and public works leaders are under increasing pressure from city councils and state auditors to justify every dollar — yet most municipalities still build their maintenance budgets on last year's actuals plus an inflation multiplier, with no visibility into asset condition, failure risk, or true cost-per-asset. OxMaint's government CMMS platform gives public works teams real-time budget tracking, multi-year forecast models, and work order cost data that turns maintenance budgeting from a guessing exercise into a defensible, data-backed plan. Cities using structured maintenance budget forecasting software reduce budget variance by up to 31% and recover an average of $180,000 annually in avoidable reactive repair costs.
Municipal Maintenance Budget Forecasting Software
How public works directors and finance teams use OxMaint to build defensible maintenance budgets, track spend in real time, and forecast capital needs before they become emergencies.
Why Municipal Budget Forecasting Fails Without a CMMS
Most public works departments rely on spreadsheets, paper work orders, and institutional memory to build annual maintenance budgets. These methods share four critical failure modes that cause budget overruns year after year.
When work orders exist only on paper or in disconnected systems, there is no way to know which assets consume the most labor and materials. Fleet vehicles, HVAC systems, and water infrastructure drain budgets invisibly until failure.
Emergency repairs are frequently coded as routine maintenance in legacy systems, masking the true reactive-to-planned ratio. A department that believes it is 70% proactive may actually be 40% reactive — a difference that compounds annually.
Without structured asset tracking, departments cannot reliably distinguish repair spending from capital replacement triggers. Assets that have exceeded economic repair thresholds continue receiving operating budget instead of being flagged for capital planning.
Traditional spreadsheet budgets are static. When an unexpected infrastructure failure consumes $90,000 in April, there is no systematic way to rebalance remaining budget against outstanding PM obligations — departments simply overspend.
How OxMaint Structures Municipal Budget Forecasting
OxMaint gives public works finance teams four interconnected tools that turn fragmented cost data into a coherent, auditable budget forecast.
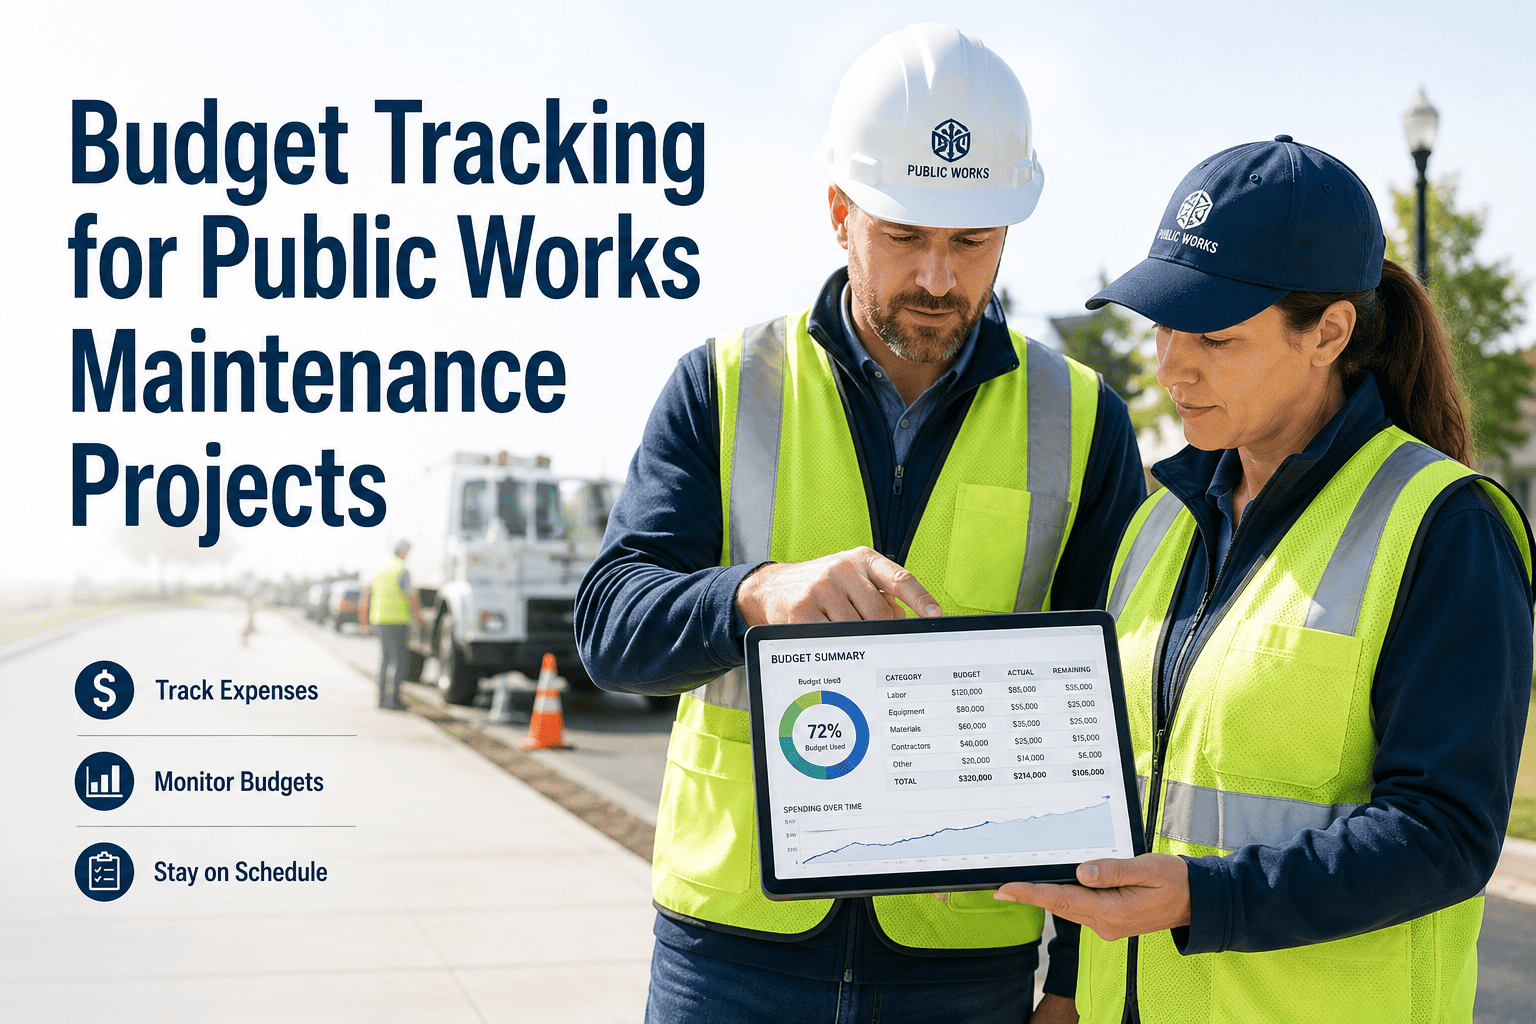
Every work order in OxMaint carries a full cost record — labor hours by technician rate, parts consumed from inventory, contractor invoices attached. Finance directors see maintenance spend by department, asset class, and cost center updated in real time, not at month-end close.
OxMaint projects future preventive maintenance costs by rolling forward asset PM schedules across a 1-, 3-, and 5-year horizon. Finance teams see what the current asset portfolio will require in labor and materials each fiscal year — before the budget cycle begins.
When cumulative repair costs on an asset cross a configurable percentage of replacement value — typically 60–75% for public works assets — OxMaint flags the asset for capital planning review. This converts reactive replacement decisions into planned capital budget line items.
Every maintenance cost in OxMaint traces to a work order with technician sign-off, parts receipts, and inspection records attached. Budget justification packages for council presentations or state audits are generated in minutes, not assembled manually over days.
OxMaint gives finance directors and public works supervisors a single dashboard for real-time spend tracking, multi-year PM forecasting, and capital threshold alerts. See how your municipality's budget structure maps to OxMaint in 30 minutes.
Budget Performance: Industry Benchmarks vs. OxMaint Results
Data drawn from municipal CMMS deployments across cities with populations of 10,000 to 500,000. All figures represent rolling 12-month averages post-deployment.
| Budget KPI | Municipal Average | With OxMaint | Improvement |
|---|---|---|---|
| Budget Variance (planned vs. actual) | ±27% | ±9% | 3x tighter |
| Reactive vs. Planned Spend Ratio | 55% reactive | 24% reactive | -31 points |
| Cost-per-Work-Order Visibility | 38% of WOs costed | 98% of WOs costed | +60 points |
| Capital Replacement Surprise Events | 6.4 per year avg. | 1.2 per year avg. | 81% fewer |
| Time to Produce Budget Justification | 3–5 days | Under 2 hours | 90% faster |
| PM Compliance Rate | 61% | 93% | +32 points |
The Municipal Budget Forecasting Cycle in OxMaint
OxMaint structures budget forecasting across four phases that align with typical government fiscal year cycles — from data collection through council presentation.
- Import or build asset register with replacement values
- Tag all work orders to specific assets and cost centers
- Establish trailing 12-month cost-per-asset baseline
- Map all preventive maintenance schedules in OxMaint
- Assign labor rates and average materials cost per PM type
- Generate 3-year PM spend projection by asset class
- Review assets flagged above repair cost threshold
- Build capital replacement line items for budget submission
- Separate capital and operating costs in forecast view
- Export budget justification report with full cost trail
- Show reactive vs. planned ratio improvement over time
- Present cost-per-asset data to support budget requests
Municipal maintenance budgeting has historically been a backward-looking exercise — you look at what you spent last year and add a percentage. The shift to forward-looking asset-based forecasting, where you project PM obligations and capital thresholds from actual condition data, typically recovers 20–30% of operating budget within two budget cycles. The key is connecting work order cost data directly to the budget planning process, which is exactly what purpose-built CMMS platforms enable for government facilities teams.
Frequently Asked Questions
Your Next Budget Justification Starts with Better Data
Finance directors and public works supervisors who implement OxMaint before their next budget cycle enter council presentations with real cost-per-asset data, documented PM compliance records, and defensible capital replacement forecasts. Book a 30-minute demo and see the municipal budget forecasting dashboard built for government teams.