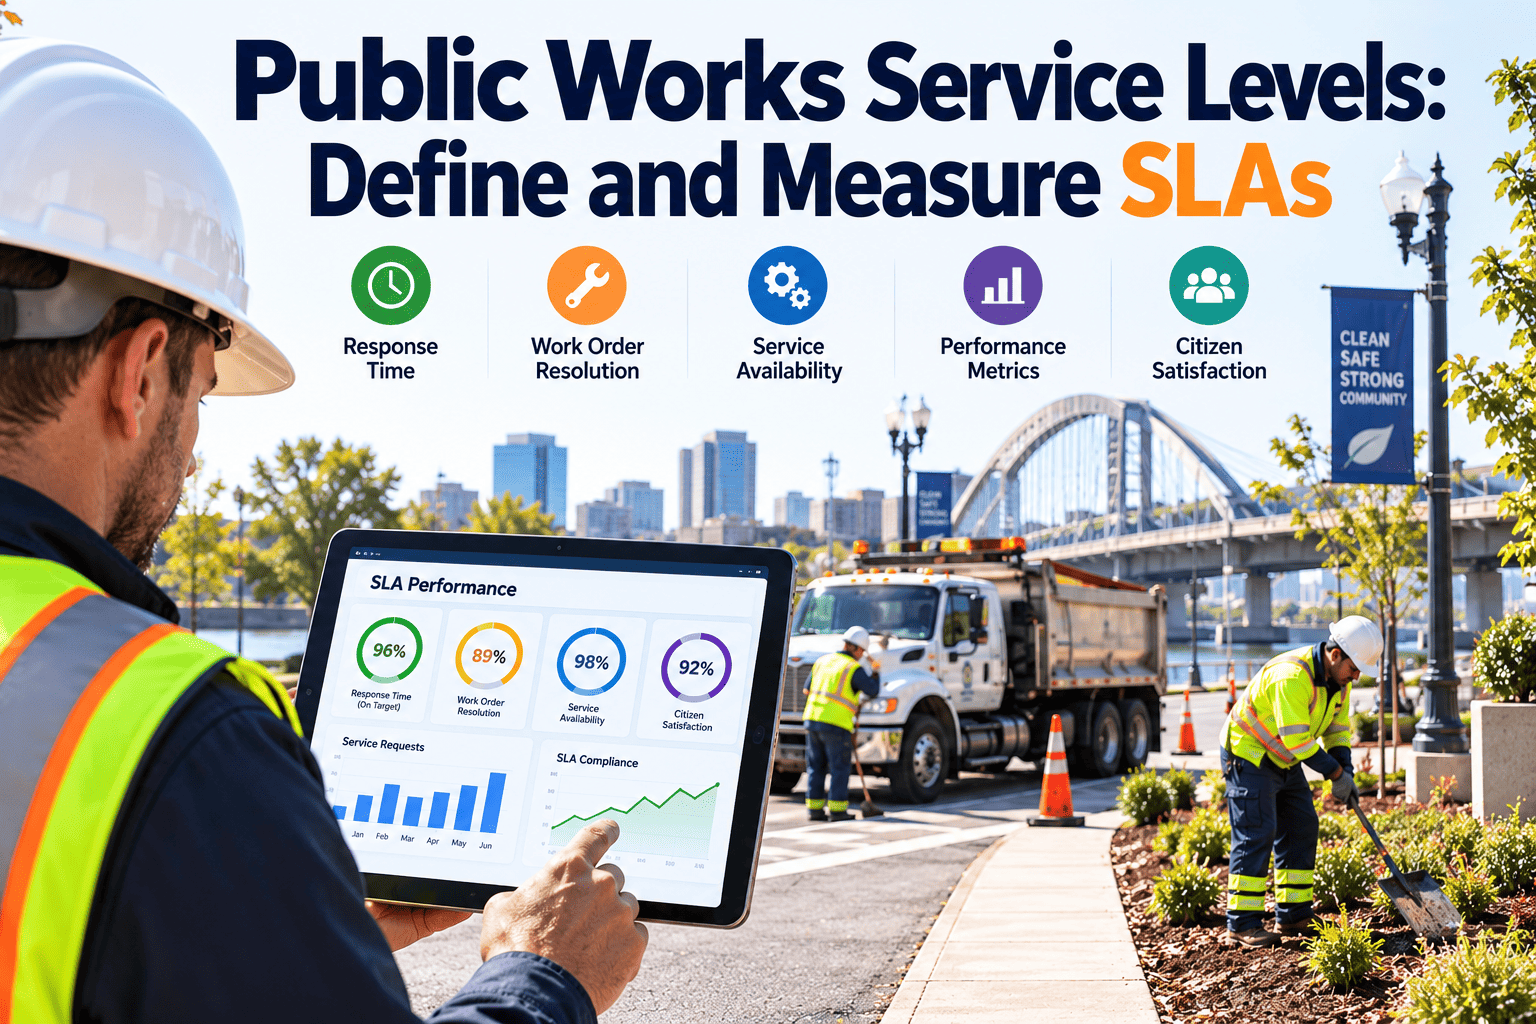
Residents rarely ask how a public works department is organized. They ask how long a pothole, a dark streetlight or a water main break will take to fix. Service levels turn that question into a measurable promise that crews, supervisors and elected officials can all see. Without them, hard work goes unrecorded and every complaint feels equally urgent. This guide shows how to set realistic targets, measure them honestly and run the process in maintenance management software that keeps every clock.
Public Works Service Levels: Define and Measure SLAs
Potholes, streetlights, water breaks and facility repairs all compete for the same crews. Clear service-level targets, tracked from the first report to the closed work order, show what the department can promise and where it needs help.
Why Public Works Needs Defined Service Levels
- Without a target, every request is judged by whoever calls loudest, not by risk.
- Budget requests are stronger when they show the gap between current and promised performance.
- Crews get clear priorities instead of reshuffling the day after each phone call.
- Residents hear the same answer no matter which office they reach.
Levels of service as a management tool
- Asset management frameworks such as ISO 55000 treat levels of service as the link between what an asset must deliver and what it costs to deliver it.
- A service level is therefore a decision about money and risk, not just a speed goal.
- If the council wants a 48-hour pothole repair, the budget has to support the crews, material and traffic control behind it.
Anatomy of a Service-Level Agreement
An internal SLA is a short written commitment between the department and the people it serves. Each one answers the same five questions.
- What is covered. Name the asset class and the type of request, such as a pavement defect on a collector street or a failed luminaire on a residential block.
- When the clock starts. Usually the moment the report is logged, whether by phone, app, crew observation or inspection finding.
- What response means. Acknowledgement, site inspection or crew dispatch. Pick one and use it everywhere.
- What resolution means. A temporary make-safe action and a permanent repair are different milestones and deserve different targets.
- What stops or pauses the clock. Utility locates, permit waits, weather holds and parts on order should be defined in advance, not argued later.
Setting Realistic Targets by Service Area
The figures below are illustrative starting points for discussion. Adjust them to your climate, staffing, contracts and local policy before publishing anything.
| Service area | Priority trigger | Example response | Example resolution |
|---|---|---|---|
| Potholes and pavement defects | Hazard to vehicles or cyclists on arterials | Inspect within 1 working day | Temporary fill in 2 to 3 days, permanent patch scheduled |
| Streetlights | Outage at crossing or intersection | Inspect within 2 working days | Repair within 5 working days, longer if utility work is needed |
| Water main breaks | Loss of service or flooding | Crew on site within hours | Isolate and restore service first, restore surface later |
| Facility repairs | Life safety, heat, security or water intrusion | Same day for safety items | Routine items batched within 10 to 15 working days |
| Signs and signals | Missing stop sign or dark signal | Immediate dispatch | Interim control same day, permanent fix soon after |
Three rules for choosing a number
- Start from the last twelve months of actual performance, then decide how much to tighten.
- Tie faster targets to a named budget or staffing change.
- Set fewer, clearer targets. Five well-measured commitments beat thirty ignored ones.
Priority Tiers That Crews Can Apply Without a Meeting
Tier 1: Emergency
Immediate danger to people, property or public water supply. Dispatch is continuous until the hazard is controlled.
Tier 2: Urgent
High likelihood of injury or service loss within days. Inspection and interim action within one or two working days.
Tier 3: Routine
Defects that affect comfort or appearance but not safety. Scheduled into planned routes and work packages.
Tier 4: Planned
Lifecycle work and requests that need design, procurement or capital funding. Tracked against a promised date, not a response clock.
How to Measure Service Levels Honestly
A target means little if the measurement can be bent. Use a few simple rules and apply them to every request type.
Measure the percentage met
Report how many requests met the target out of all requests in the period. An average hides a long tail of ignored jobs.
Track the oldest open item
Backlog age shows the work nobody is closing. The oldest open request is often more revealing than the median.
Separate interim from final
A cone over a hole is not a repair. Record both milestones so a quick fix cannot stop the clock on the permanent work.
Log pauses with a reason
Every hold needs a coded reason and a name. Unexplained pauses are where targets quietly fail.
Where Service-Level Programs Go Wrong
Common failure patterns
- Closing tickets to stop the clock before work is verified
- Counting duplicate reports as separate jobs
- Promising targets the budget cannot support
- Collecting data in separate spreadsheets by department
- Reporting averages with no breakdown by neighborhood or asset
What works instead
- Closing only after a supervisor or inspector confirms the fix
- Merging duplicates into one parent request
- Pairing each target with resources and a review date
- Using one system for requests, work orders and assets
- Reporting by area, priority and asset class
The Request-to-Close Workflow
What to Define for Each Asset Class
A good service level is specific to the asset. The questions below help each division write targets that crews can recognize in their daily work.
Potholes and pavement defects
- Define the defect size and location that triggers each priority, such as depth, width and whether it sits in a wheel path or bike lane.
- Separate cold-patch temporary repairs from hot-mix permanent repairs, since asphalt plants and weather limit the second.
- Record the coordinates and a photo at inspection so the same defect is not counted twice.
- Set a target for acknowledging the resident, because a quick reply reduces repeat calls.
Streetlights
- Separate single-lamp outages from circuit failures, since the second often depends on the electric utility.
- Give higher priority to lights at crossings, intersections, transit stops and school routes.
- Record luminaire type and age so repeat failures can be linked to a batch or a fixture model.
- Plan group relamping or LED replacement instead of waiting for each lamp to fail.
Water and sewer breaks
- Measure time to isolate the break, time to restore service and time to restore the surface as three separate milestones.
- Include notification steps for affected customers and critical users such as hospitals and schools.
- Track pipe material, age and break history so recurring failures support a replacement case.
- Keep valve exercising and hydrant flushing on a preventive schedule, since stuck valves slow every emergency response.
Facility repairs
- Define which failures are life-safety or health items, such as fire alarms, heating loss in winter or water intrusion.
- Group routine repairs into scheduled visits by building so technicians are not driving across town for single tasks.
- Set expectations for what the requesting department must provide, including access and a contact on site.
- Track recurring complaints by building to support capital planning.
Fairness, Weather and Real-World Limits
Check for geographic fairness
Compare response times across districts. A citywide average can hide neighborhoods that wait longer for the same type of repair.
Plan for surge conditions
Freeze-thaw cycles, storms and heat waves create spikes. Define a surge rule that reprioritizes work and explains temporary target changes.
Respect crew capacity
Compare target volume with available labor hours. If demand exceeds capacity, say so with data rather than quietly missing targets.
Account for contractors
When outside vendors do part of the work, write response expectations into the contract and track them in the same system.
A 90-Day Rollout Plan
Communicating results to the public
- Publish a short summary with the target, the percentage met and a plain explanation of any shortfall.
- Tell residents what happens after they report an issue and when they can expect updates.
- Use the same terms internally and publicly so there is no gap between what staff mean and what residents hear.
Put Your Service Levels on a Live Dashboard
See which requests are on track, which are about to breach and which neighborhoods wait longest, all from live work order data.
The Scorecard: Metrics Worth Reporting
Reporting to different audiences
- Crew leads need a daily list of jobs nearing breach.
- Directors need weekly trends by service area.
- Councils and the public need a short quarterly summary with plain-language explanations of misses.
Reduce Reactive Work to Hit Targets Sustainably
- Many emergency calls start as small defects found too late. Regular inspections and route patrols move them into planned work.
- Preventive maintenance on lights, pumps, valves and building systems reduces the volume of urgent requests competing for crews.
- Repeat-repair reports point to root causes such as drainage, base failure or aging pipe that patching will never solve.
- Stock the common parts so a repair is not delayed waiting for a purchase.
How Oxmaint Supports Public Works SLAs
- Work order management: every request becomes a work order with priority, due date, assignee and history, so the clock is built into the job.
- Asset management: link requests to the street segment, light pole, valve or building so repeat problems are visible.
- Preventive maintenance and scheduling: plan inspections and routine work so fewer issues arrive as emergencies.
- Mobile workflows: crews update status, add photos and record parts and time from the field.
- Inventory: track common parts and materials to avoid delays at the yard.
- Dashboards and reporting: view SLA performance, backlog and cost by area and priority without rebuilding spreadsheets.
A Monthly Review Routine That Keeps Targets Alive
- Start with breaches. List every request that missed its target and group them by cause, such as staffing, parts, access, weather or a vendor delay.
- Look at the oldest items. Ask who owns each one and what is blocking it. Anything older than twice its target needs a decision, not a status note.
- Compare districts. Check whether certain areas consistently wait longer and whether routes or crew assignments need adjusting.
- Review repeat work. Identify assets that appear again and again, then decide whether a permanent fix belongs in the capital plan.
- Adjust resources or targets. If a target cannot be met with current resources, document the gap and either fund it or revise the promise.
Questions leadership should ask each quarter
- Which service levels are we meeting, and which are we only claiming to meet?
- Where is reactive work crowding out planned work?
- What would it cost to improve the weakest target by one tier?
- Which complaints do residents repeat, and what does the data say about them?
Frequently Asked Questions
What is a public works service level?
It is a defined standard for how quickly and how well the department responds to and resolves a type of request, such as a pothole or streetlight outage.
How many SLAs should we start with?
Begin with four or five high-volume service areas, measure them for a quarter, then expand. You can set them up in Oxmaint.
Should the target be an average or a percentage?
Use the percentage of requests met, plus the oldest open item. Averages hide the slowest jobs, which residents notice most.
What if we miss targets because of weather or utilities?
Define coded pause reasons in advance and report them separately so the data stays honest and defensible.
Can a CMMS track SLAs automatically?
Yes. Priority-based due dates and status history let the system flag breaches. Book a demo to see it on your request types.
Turn Service Promises Into Measured Results
Give crews clear priorities, give leaders trustworthy numbers and give residents a straight answer. Start measuring public works service levels with Oxmaint today.