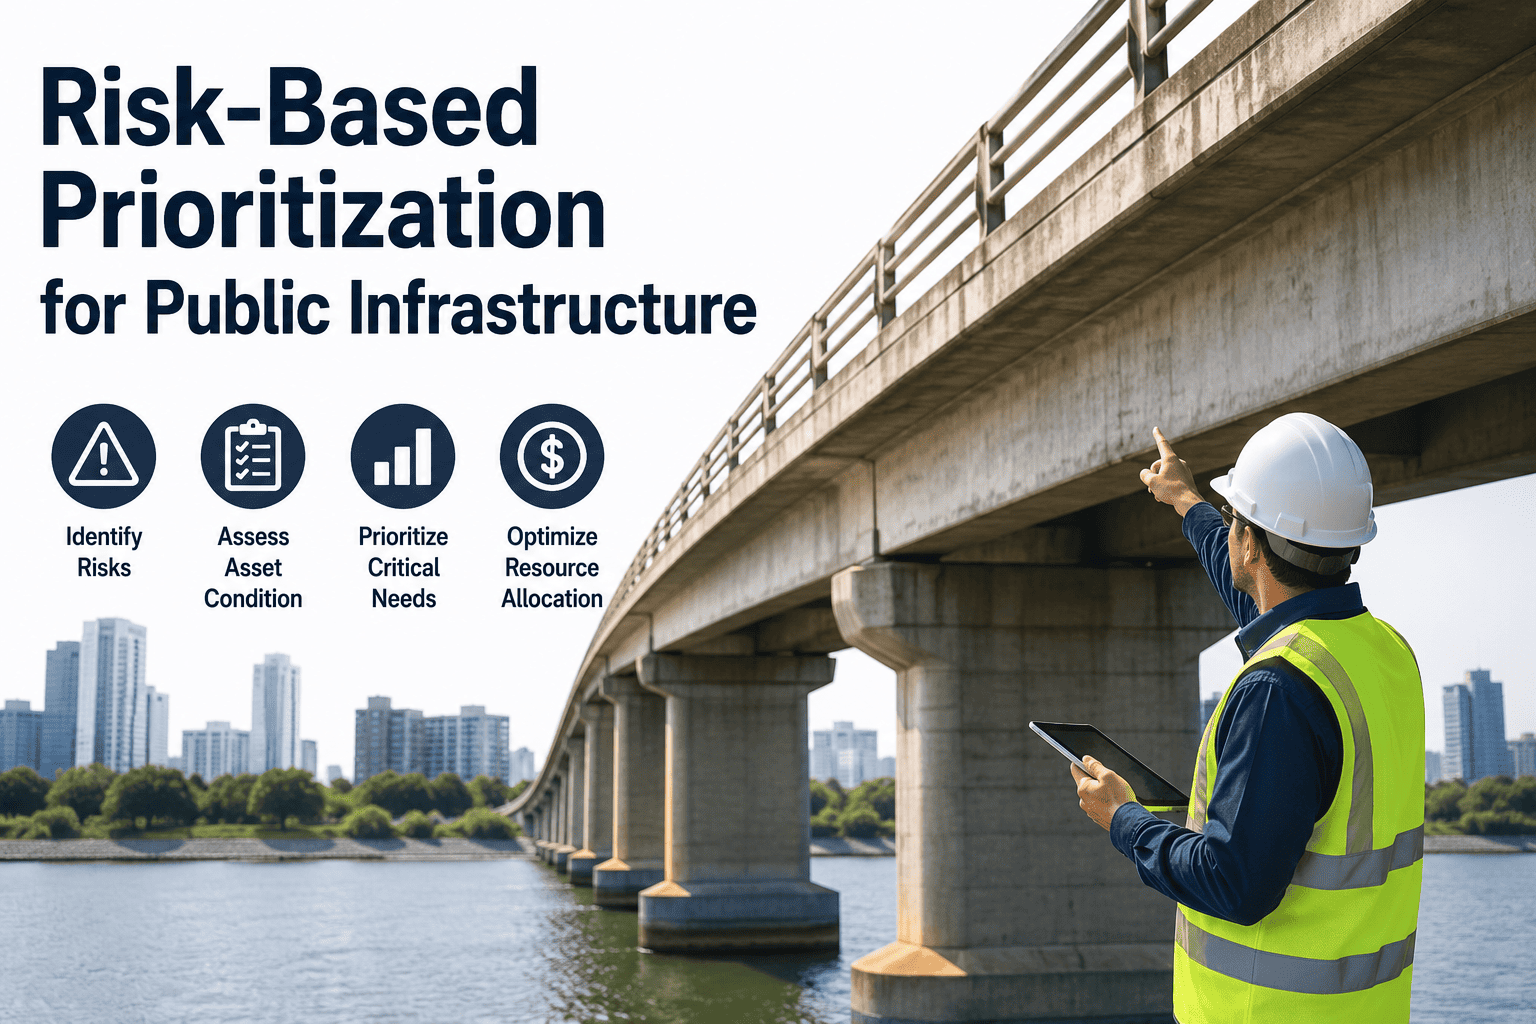
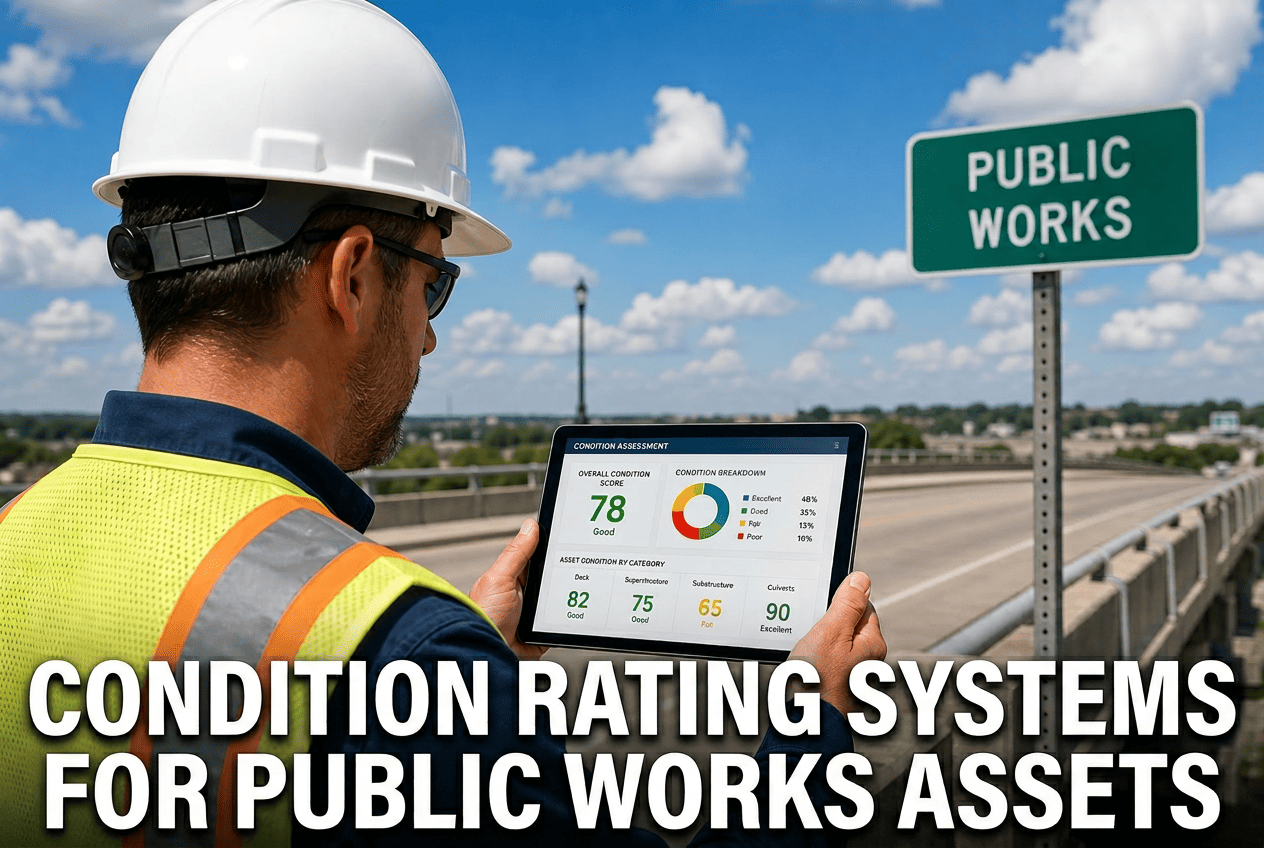
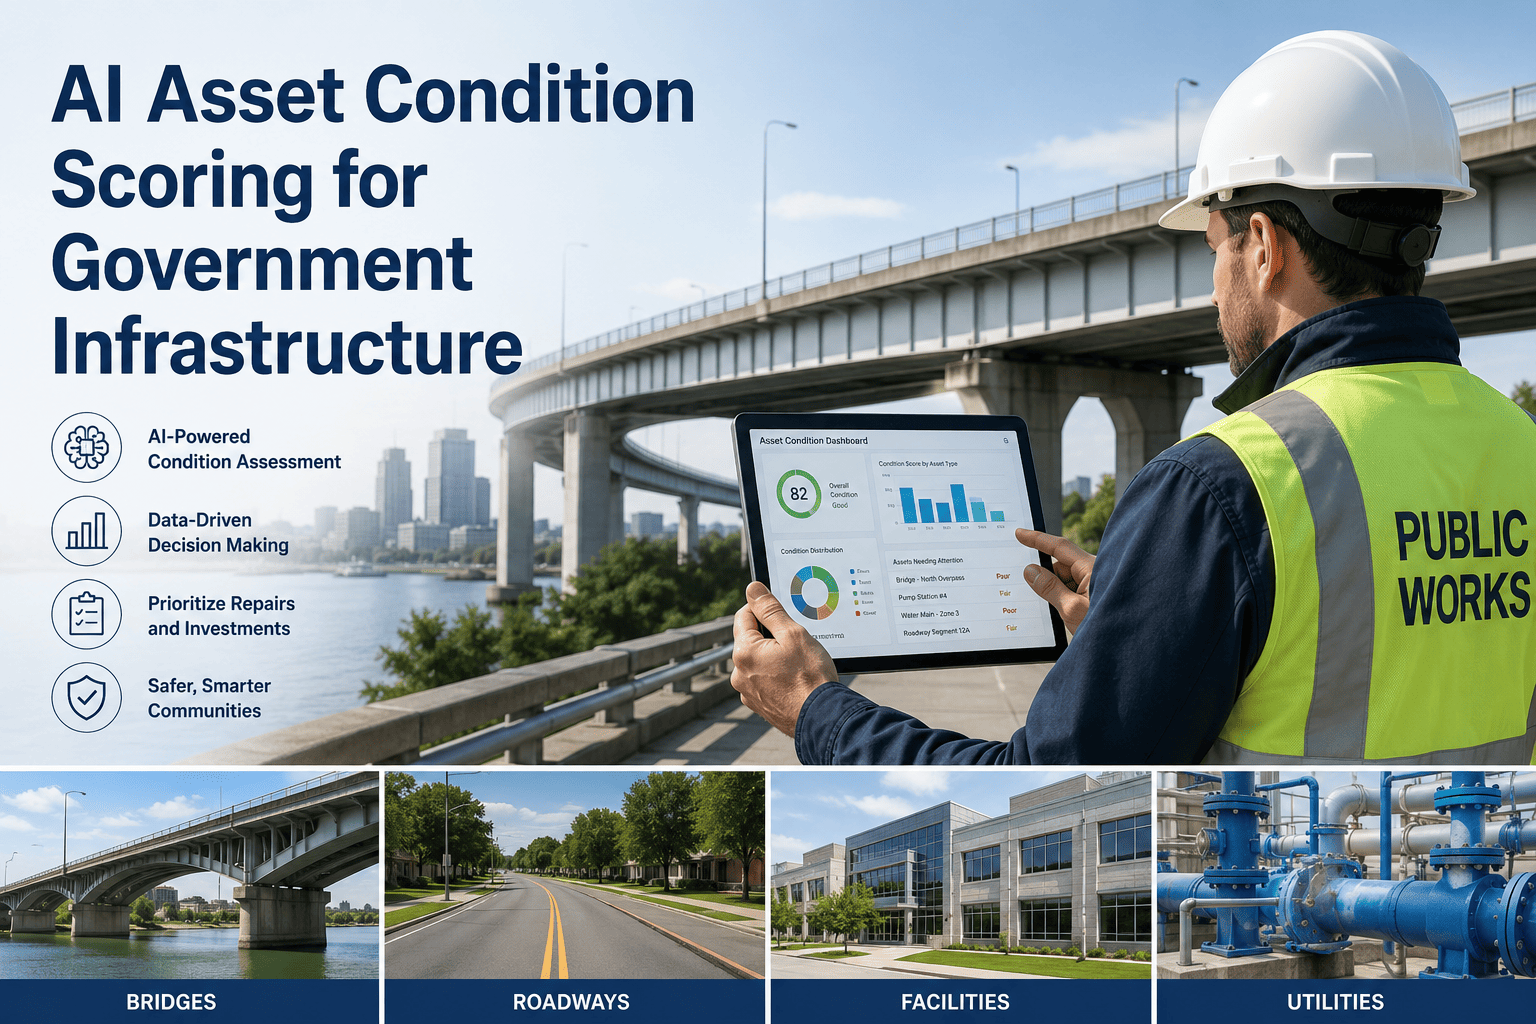
Two air handlers sit in the same building. One is 30 years old, one is 25. Both maintained by the book. Which do you replace first? On age alone, the answer is obvious: the older one. But the 25-year-old unit serves the operating room suite, and the older one serves an admin office. Suddenly "worst-first" is the wrong call. This is the trap most public works budgets fall into — ranking assets by condition or age and quietly deferring the work that would actually hurt most if it failed. Risk-based prioritization fixes that by scoring every asset on two axes at once: how likely it is to fail, and what happens if it does. Start a free trial with Oxmaint to score and rank your infrastructure by real risk.
The Core Fallacy
Why "Worst-First" Quietly Wastes Budgets
Worst-First
Rank by condition or age alone
Fixes whatever looks worst on paper. A crumbling rural culvert jumps ahead of a fair-condition water main under a hospital. Spends real money on low-consequence assets while critical ones inch toward failure. Defensible to no one when the hospital main bursts.
Risk-Based
Rank by likelihood × consequence
Scores every asset on probability of failure and consequence of failure, then ranks by the product. The hospital main rises to the top even at fair condition, because failure there is catastrophic. Every dollar goes where risk is highest, and every decision has an audit trail.
The Formula
Risk = Probability of Failure × Consequence of Failure
The power of multiplying the two axes: a low-probability asset with catastrophic consequences still scores high, and a near-failure asset with trivial consequences correctly drops down the list. An oil pipeline outranks a potable water line even at equal condition, because a rupture does far more damage. That is exactly the judgment worst-first cannot make.
The 5×5 Matrix
Where Every Asset Lands on the Risk Grid
Consequence ↓ / Probability →
Rare
Unlikely
Possible
Likely
Almost Certain
Catastrophic
5
10
15
20
25
Major
4
8
12
16
20
Moderate
3
6
9
12
15
Minor
2
4
6
8
10
Negligible
1
2
3
4
5
20–25 Critical — act now
10–16 High — plan this cycle
5–9 Medium — monitor and schedule
1–4 Low — routine only
Put Every Asset on the Matrix Automatically
Oxmaint scores each asset on probability and consequence using your condition data, then plots it on a live risk matrix and ranks your entire portfolio. Your capital list writes itself, and every ranking comes with the data behind it.
Build the Score
Four Steps From Asset List to Ranked Plan
1
Score Probability
Rate each asset 1–5 on likelihood of failure using condition, age against useful life, and failure history. Poor condition and past-life assets score high.
2
Score Consequence
Rate each asset 1–5 on failure impact: safety, population served, service disruption, cost, and regulatory exposure. A hospital feeder outscores a park path.
3
Multiply and Rank
Multiply the two scores for a 1–25 risk number. Sort the whole portfolio high to low. Critical assets rise regardless of which department they sit in.
4
Fund and Defend
Align the capital budget to the ranked list. Every funded project carries a cost-of-doing-nothing case; every deferral is a documented, conscious risk decision.
Why It Wins
What Risk-Based Prioritization Delivers
Defensible Budgets
Council, auditors, and bond agencies trust a ranked list backed by scores far more than a wish list backed by opinion. Credibility drives funding approvals.
Right Work First
Spending flows to the assets whose failure hurts most, not just the ones that look worst. High-consequence assets stop hiding behind fair condition ratings.
Fewer Surprises
High-risk assets get watched and maintained more often, so failures that would have blindsided you become scheduled, planned interventions instead.
One Comparable List
Roads, pipes, bridges, fleet, and buildings all rank on the same scale, ending the silo fights where every department claims its assets come first.
Frequently Asked Questions
Risk-Based Prioritization: Common Questions
Is a 5×5 matrix better than a 3×3?
A 3×3 gives simple low, medium, high buckets for basic use. A 5×5 gives finer scoring and cleaner separation between assets, which matters when you are ranking thousands of them for a capital budget.
Set up your risk scale in Oxmaint.
How is this different from condition-based ranking?
Condition ranking uses one axis: how bad the asset is. Risk-based adds the second axis, consequence of failure, so a fair-condition asset serving a hospital can correctly outrank a poor-condition asset serving nobody critical.
How often should risk scores be updated?
Refresh scores whenever condition changes: after inspections, work orders, or failures. High-risk assets should be reviewed at least annually, since a single event can move an asset several rows up the matrix.
What data do we need to start?
A clean asset inventory with condition ratings and enough context to judge consequence: location, population served, and service role. The model is only as good as the data feeding it, so start with your critical assets.
Book a session to map your scoring inputs.
Does this replace engineering judgment?
No. It structures it. Scoring makes decisions consistent and defensible, but field engineers still set the criteria and review edge cases. The matrix gives judgment a repeatable, auditable framework rather than replacing it.
Stop Fixing What Looks Worst. Start Fixing What Matters Most.
Oxmaint scores your entire portfolio on probability and consequence, ranks it on a live risk matrix, and turns every capital decision into a defensible, data-backed case. Spend where risk is highest, and prove it to anyone who asks.