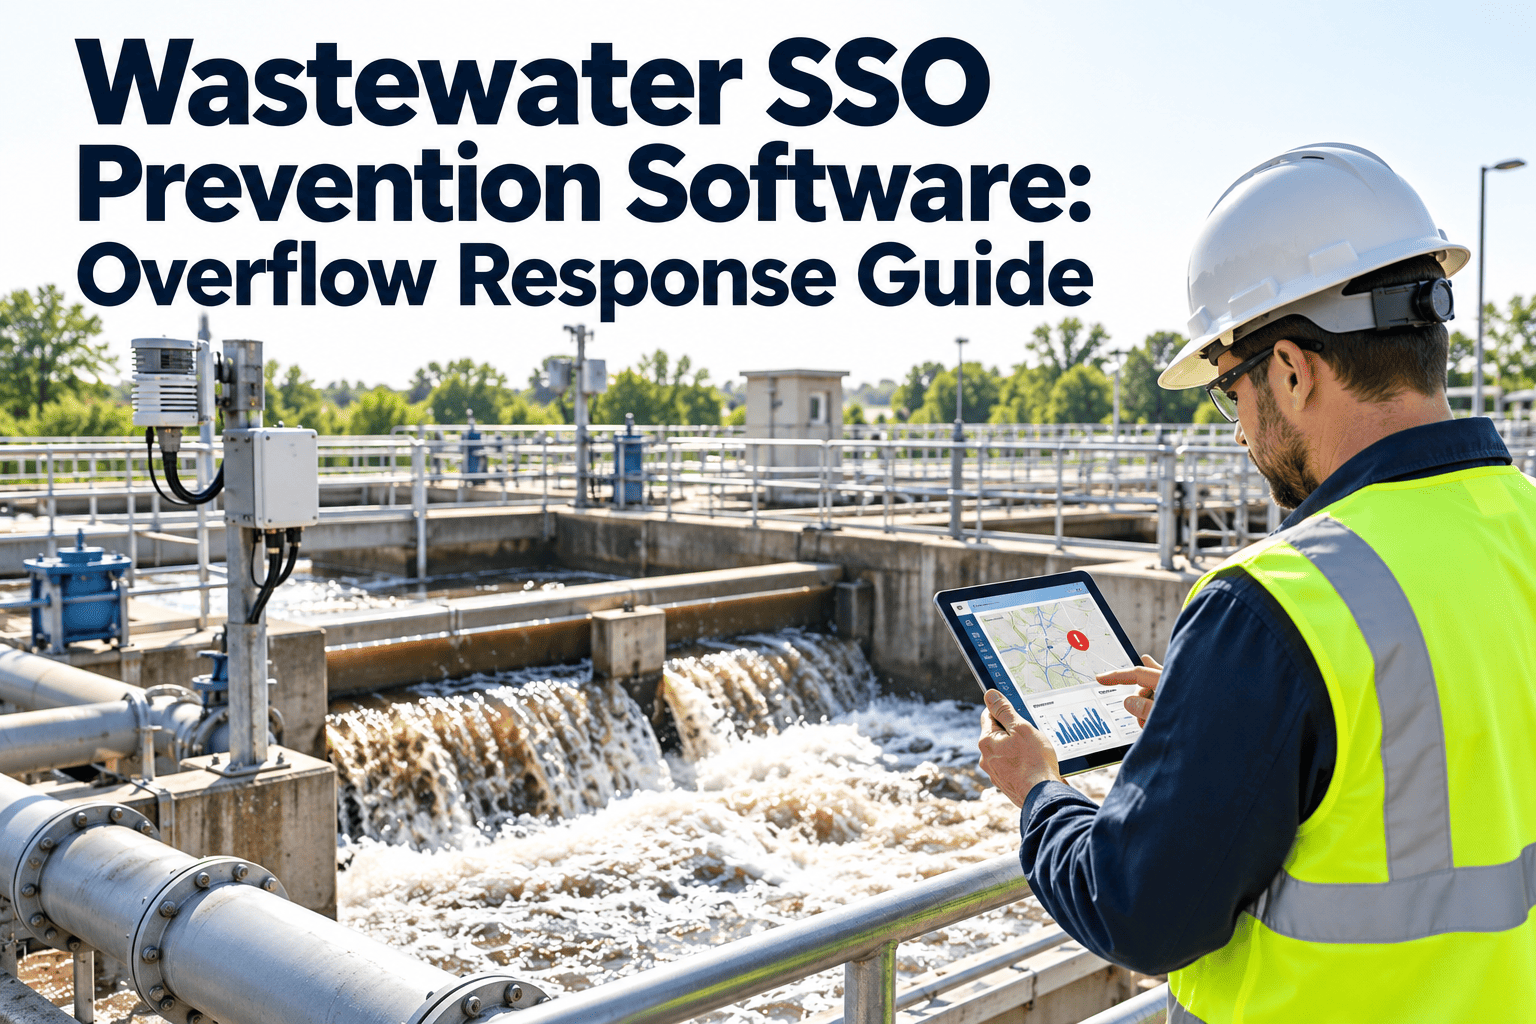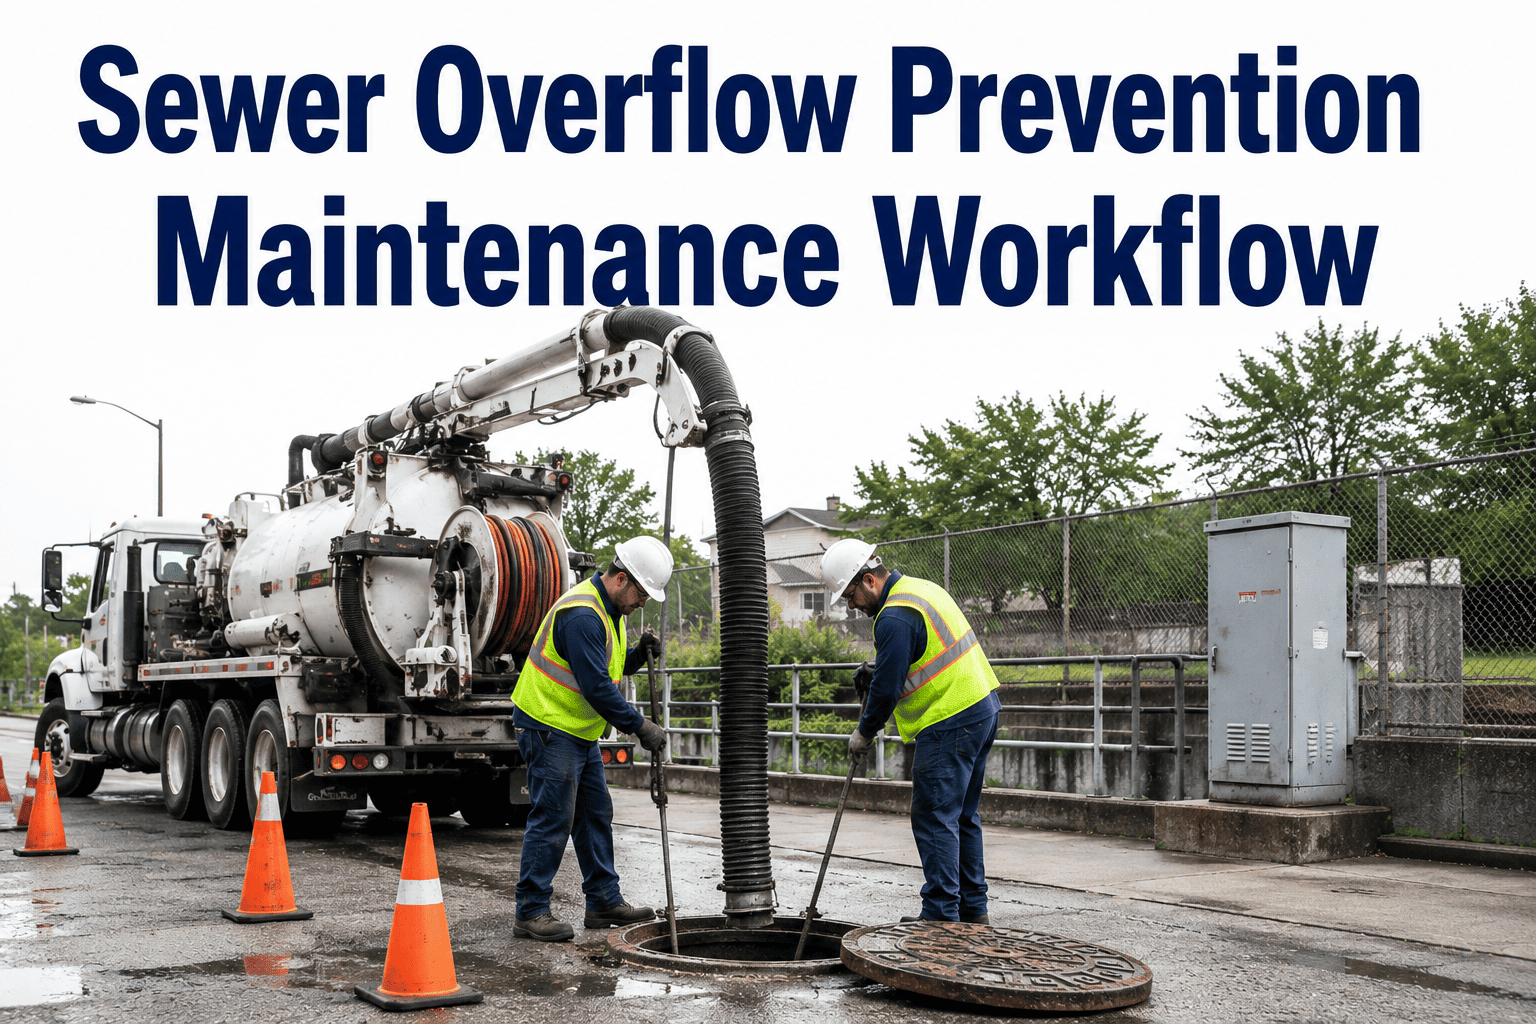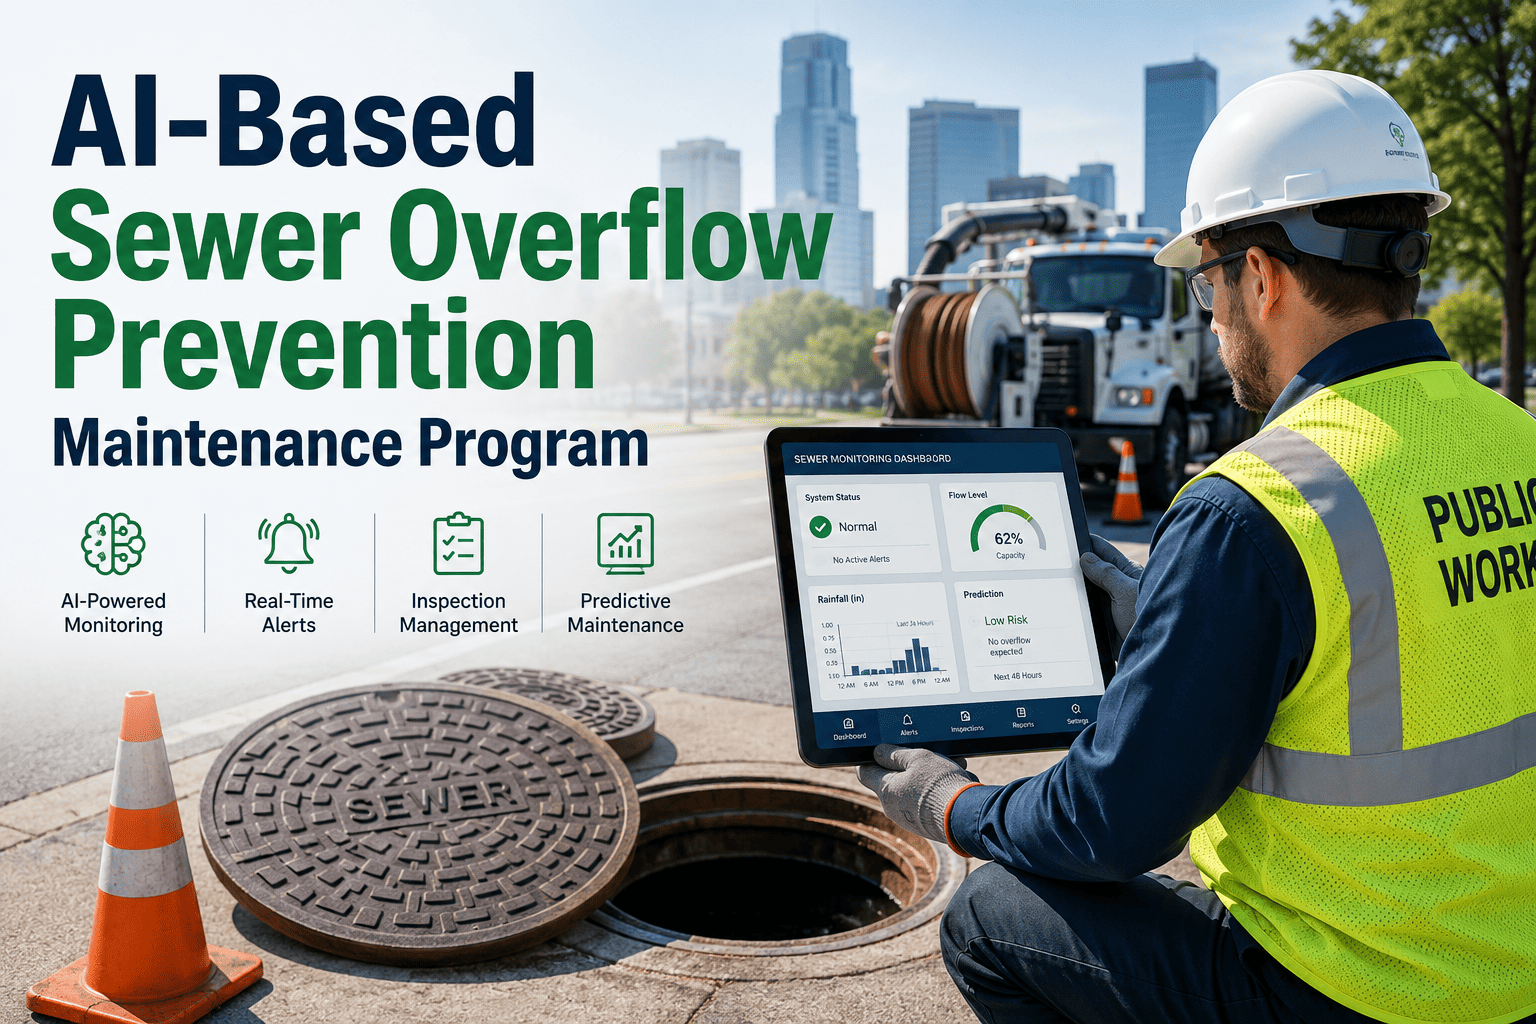
Every sanitary sewer overflow is a reportable event under the Clean Water Act, and a string of them is the fastest way for a utility to land in federal consent decree enforcement — where settlements routinely exceed $100 million and force 10-to-20-year capital programs. Prevention is not glamorous, but it is mathematically cheaper: targeted infiltration and inflow (I&I) reduction, capacity management under EPA's Capacity, Management, Operation, and Maintenance (CMOM) framework, and pump-station reliability together cut SSO frequency by 60–80% at a fraction of consent-decree cost. The utilities that stay out of trouble run a CMMS-driven SSO reduction program with closed-loop work orders, asset histories, and defensible audit trails. You can stand one up quickly — Start Free Trial and configure your sewer overflow prevention workflows today.
One overflow. One EPA report. One step from a consent decree.
Sanitary sewer overflows are the number-one Clean Water Act enforcement trigger for municipalities. A disciplined CMOM program — capacity, I&I, pump stations, and a CMMS audit trail — is what separates compliant utilities from those writing nine-figure settlement checks.
Why SSOs are the most expensive thing your sewer system does
The EPA logs between 23,000 and 75,000 sanitary sewer overflow events every year, discharging an estimated 3 to 10 billion gallons of untreated wastewater into U.S. waterways. Each one is a Clean Water Act Section 301 violation.
Worked example. A 180-mile collection system averaging 14 SSOs per year entered a consent decree in year three. Settlement: $4.1M civil penalty, $185M in mandated sewer rehab over 12 years, and a full-time EPA compliance monitor. A CMMS-driven I&I and capacity program costing roughly $1.2M per year would likely have prevented enforcement entirely.
The four pillars of an SSO reduction program
EPA's Capacity, Management, Operation, and Maintenance framework is the de facto standard for SSO compliance. Every defensible program addresses these four pillars with documented, auditable workflows.
Capacity Management
Hydraulic modeling, peak-flow analysis, and level-of-service targets. Identify surcharged segments before the next 25-year storm turns them into a basement backup or a manhole eruption.
EPA CMOM §1I&I Reduction
Flow isolation, smoke testing, and manhole inspection to find infiltration and inflow sources. A 30% I&I cut can defer a $20M treatment-plant expansion by a decade.
EPA CMOM §2Pump Station Reliability
Redundant force mains, SCADA alarms, generator backups, and preventive maintenance on every pump. Most station-driven SSOs trace back to a single failed seal, bearing, or float switch.
EPA CMOM §3CMMS Documentation
Closed-loop work orders, asset histories, and timestamped inspections. When EPA auditors arrive, your CMMS records are the evidence that your program actually exists — not just a binder on a shelf.
EPA CMOM §4The SSO prevention checklist utilities run before wet weather season
Field crews and utility managers work this 12-point checklist each quarter. Every item maps to a CMOM pillar and generates a timestamped CMMS work order — the documentation EPA expects during an audit.
Capacity & Hydraulics
- Update hydraulic model with prior-year flow-monitoring data
- Identify the top 5% of surcharged pipe segments from SCADA level trends
- Verify wet-weather pump station firm capacity against design inflow
Infiltration & Inflow
- Run nighttime flow isolation on the three highest-I&I basins
- Schedule smoke testing for suspect laterals flagged by the model
- Inspect 100% of priority manholes for frame, cover, and chimney defects
Pump Stations & Force Mains
- Test every standby generator under full load for 60 minutes
- Inspect seal-and-bearing assemblies on critical-service pumps
- Confirm SCADA high-level and power-failure alarms dial out correctly
CMMS & Compliance
- Confirm every PM is closed with an asset-linked work order
- Generate the quarterly SSO summary and route to the compliance manager
- Validate the 72-hour EPA notification contact list is current
What an overflow actually costs — and what prevention saves
Utilities that model SSO cost per event make smarter capital decisions. The formula below captures the full burden — emergency response, regulatory penalty, environmental damage, and reputational impact — that gets buried in end-of-year budgets.
A single wet-weather SSO typically costs $25,000–$90,000 in direct response, cleanup, and reporting. The consent-decree risk premium — the actuarial cost of federal enforcement — adds another $50,000 to $200,000 per event for a repeat violator.
| SSO Reduction Program Element | Annual Cost (Mid-Size Utility) | Avg SSOs Prevented / yr | Estimated Savings |
|---|---|---|---|
| Quarterly CMMS-driven preventive maintenance | $180K | 4–6 | $180K–$540K |
| Targeted I&I rehab (top 5% basins) | $750K | 3–5 | $150K–$450K |
| Pump station reliability upgrades | $420K | 2–4 | $100K–$360K |
| SCADA + flow-monitoring analytics | $140K | 2–3 | $100K–$270K |
| Combined proactive program | $1.49M | 11–18 | $530K–$1.62M |
| Cost of one consent decree (amortized) | $12M–$18M | — | Catastrophic |
A 6-month roadmap to a defensible SSO reduction program
Standing up a CMOM-aligned program takes roughly two quarters for a utility that already has a CMMS. Here is the phased timeline, with the audit-ready deliverables produced each month.
Inventory & Data Migration
Load every sewer asset — mains, manholes, pumps, force mains — into the CMMS with GIS coordinates, install dates, and material data. Establish the EPA 72-hour reporting contact list inside the system.
I&I & Capacity Hotspot Mapping
Pull two years of SCADA and flow-monitoring data. Rank basins by I&I gallons per inch-mile per day. Identify the top 5% of pipes at chronic surcharge risk.
Risk-Ranked PM Schedule
Build preventive-maintenance templates in the CMMS — CCTV inspection cadence, manhole inspection frequency, pump-bearing intervals — ranked by consequence-of-failure and SSO history.
Field Deployment & Mobile Work Orders
Roll out mobile CMMS to field crews. Every inspection, defect, and repair closes a work order with a photo, timestamp, and asset ID — building the audit trail EPA expects.
Pump Station Reliability Audit
Load-test every standby generator, validate every high-level alarm, and confirm force-main pressure readings. Close gaps before the next wet-weather season.
CMOM Audit Package
Generate the quarterly SSO summary, closed-PM report, and asset-condition dashboard. If EPA knocks, this is the package you hand over — proof of a real, running program.
What utilities see after the first year of a CMMS-driven program
Numbers from utilities that stood up a disciplined SSO reduction program. The pattern is consistent — the biggest drop in overflows comes in the first 12 months as deferred PMs catch up and I&I hotspots get rehabbed.
"We dropped from 19 SSOs a year to 6 in the first full year on the platform. When EPA auditors showed up, we handed them a CMMS report instead of a binder. That changed the entire tone of the conversation."
— Collection System Manager, Southeastern U.S. regional utility (240 miles of sewer)
Ready to stop overflows before they start?
Deploy a CMMS-driven SSO reduction program in weeks — not the 18 months a consultant would bill you for.
Sanitary sewer overflow compliance — the questions utility directors ask
How fast must an SSO be reported to the EPA?
Federal policy and most state programs require oral notification to the National Response Center within 24 hours of discovery, with a written follow-up within 5 days. Some states compress this to 72 hours for verbal notice. A CMMS with a built-in SSO incident template ensures the right contacts, time stamps, and discharge-volume estimates are captured at the moment crews are on site — not reconstructed days later from memory.
What is a consent decree and how does a utility end up in one?
A consent decree is a federally enforced settlement, usually entered after repeated or significant SSO violations. It binds the utility to a court-supervised capital program — often $50M to $250M over 10 to 20 years — with quarterly EPA reporting and an independent monitor. Most decrees originate from a pattern of unaddressed overflows, not a single catastrophic event. You can see how a CMMS helps build the defensible audit trail that prevents enforcement — Book a Demo and we'll walk you through it.
How much infiltration and inflow is "too much"?
Industry benchmark: when wet-weather flow exceeds 2 to 4 times average dry-weather flow, a basin is considered I&I-impacted. Above 6×, the basin is a priority rehab candidate. A 30% I&I reduction in the worst basins can defer or eliminate the need for treatment-plant capacity expansion — a capital saving that alone justifies the cost of an SSO reduction program.
What records does EPA actually ask for during a CMOM audit?
Auditors want to see documented capacity assessments, the maintenance schedule and its completion rate, SSO incident logs with root-cause analysis, and evidence of staff training. A CMMS generates all of these automatically — closed work orders with timestamps, asset histories, and dashboards that prove the program is running, not just written down. Utilities that hand over a binder usually face a deeper audit; those that hand over a live system report often close the audit faster.
Can a CMMS really prevent overflows, or does it just document them?
Both — and the prevention side is where the value sits. A CMMS with condition-based PM triggers catches a failing pump seal or a recurring surcharge pattern before it becomes an SSO. Utilities typically see a 50–70% drop in overflow events in the first year as deferred maintenance catches up and I&I hotspots get flagged. The documentation is what protects you in an audit; the prevention is what keeps you out of one. Start your free trial at https://app.oxmaint.ai to see both sides in action.
Stay out of the consent-decree column.
Build a defensible SSO reduction program with CMMS-driven PMs, I&I tracking, and audit-ready records.
Free 14-day trial · No credit card