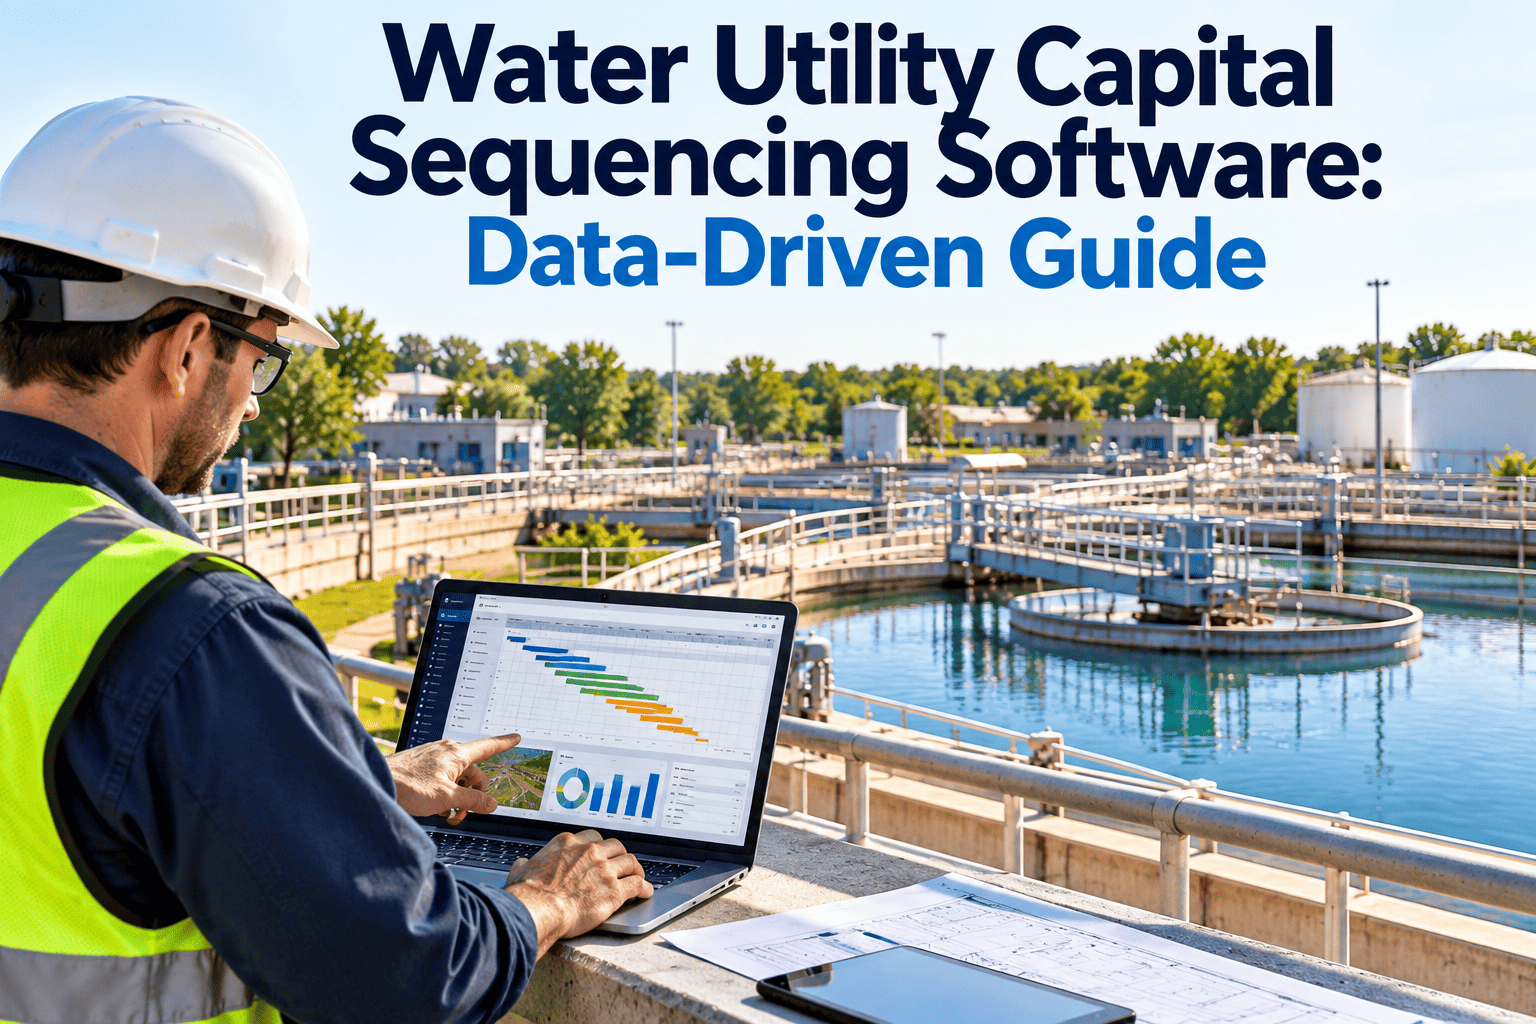
Water and wastewater utilities rarely lack capital needs. They lack a defensible order for meeting them. Pipe age, failure history, treatment plant condition, regulatory deadlines and rate affordability all compete for the same limited dollars. Sequencing that competition with data, rather than with the loudest request, is what separates a capital plan that survives board and rate-case scrutiny from one that gets reshuffled every year. This guide explains how utilities can sequence investment from condition, criticality and financial data, and how a CMMS that holds asset and work order history supplies the evidence.
Water Utility Capital Sequencing Software: A Data-Driven Guide
Rank projects by condition, consequence of failure and cost so each capital dollar goes where it reduces the most risk.
Age-Based Plans Versus Data-Driven Sequences
- Replaces assets when they reach an assumed service life
- Treats all pipes of one material as equal
- Spends evenly across the system
- Struggles to explain why one project outranks another
- Uses observed condition and failure history
- Weighs consequence of failure for each asset
- Concentrates spend where risk is highest
- Shows the scoring behind every ranking
The Three Data Inputs
A good sequence starts with three kinds of evidence, each held to a consistent standard across the system.
Asset condition
- Inspection and condition assessment scores
- Break, leak, overflow and repair history by asset
- Remaining useful life estimates, reviewed against actual performance
- Operational signals such as pump run hours and energy use
Criticality
- Customers or population served
- Service to hospitals, schools and industry
- Environmental and public health consequence
- Redundancy and repair access
Financial data
- Replacement and rehabilitation cost
- Lifecycle cost of repair versus renewal
- Funding sources, grants and loan terms
- Rate affordability and revenue constraints
Scoring Risk: Likelihood and Consequence
Most asset management frameworks, including those promoted by EPA and AWWA, express risk as the likelihood of failure combined with its consequence. The grid below shows how scores translate into action.
Two cautions
- Risk is not the only filter. Regulatory deadlines and consent decrees can override a pure risk ranking.
- Scores are only as good as the records behind them, so unreliable work order data produces unreliable priorities.
From Scores to a Sequence
Score every asset
Apply the same condition and criticality scales to pipes, pumps, tanks and plant equipment.
Group into projects
Bundle assets that share a street, facility or contractor to cut disruption and unit cost.
Test alternatives
Compare repair, rehabilitation and replacement on lifecycle cost.
Apply constraints
Layer in regulatory dates, coordination with road work and annual budget limits.
Publish and revisit
Release a multi-year sequence and update it as new condition data arrives.
Build Your Capital Sequence on Evidence You Can Show
Bring asset condition, work order history and cost data into one place so ranking decisions are easy to explain.
Water and Wastewater: Where Sequencing Differs
| Area | Water systems | Wastewater systems |
|---|---|---|
| Linear assets | Mains, valves and service lines, with break history as a key signal | Gravity mains, force mains and manholes, with inspection and blockage history |
| Consequence driver | Service interruption, water quality and fire flow | Overflows, backups and discharge permit exposure |
| Plant assets | Treatment processes, pumps, storage and electrical | Headworks, blowers, clarifiers, digesters and lift stations |
| Regulatory pull | Lead service line inventory and replacement, drinking water rules | Discharge permits, overflow control and consent requirements |
Why Maintenance Data Is the Missing Input
Many capital plans lean on age and material because that is the data available. Maintenance records can add observed performance.
The Financial Side: Sequencing Within Rates and Funding
Illustrative funnel: needs narrow as risk ranking, constraints and funding are applied.
Questions boards and rate reviewers ask
- What happens if we defer this project one year, or five?
- How does this spend reduce service risk?
- Could grants or low-interest loans change the order?
- What is the effect on customer rates, and is it phased fairly?
How a CMMS Supports Capital Sequencing
Asset registry as the foundation
A complete asset hierarchy with location, material, install year and criticality is the base for scoring. Every later input attaches to it.
Work orders and inspections as evidence
- Failure and repair history by asset, with cost
- Mobile inspections that update condition scores
- Preventive maintenance compliance on critical equipment
- Corrective work orders that flag repeat problems
Reporting for planners and finance
Exportable reports can list high-risk assets, repair cost by asset class and backlog by facility. Planners can then use them in the capital model, with finance review of the cost assumptions.
Trends Influencing Utility Capital Plans
Aging networks
Utilities face growing renewal needs, which makes prioritization unavoidable.
Regulatory change
Lead service line work and new contaminant rules add fixed-date projects to the sequence.
Resilience planning
Flood, drought and power outage exposure are increasingly part of consequence scoring.
Workforce turnover
Documented scoring rules preserve knowledge when experienced staff retire.
Frequently Asked Questions
Put Every Capital Dollar Where It Reduces the Most Risk
Connect maintenance history to capital planning and give your board a sequence backed by data.