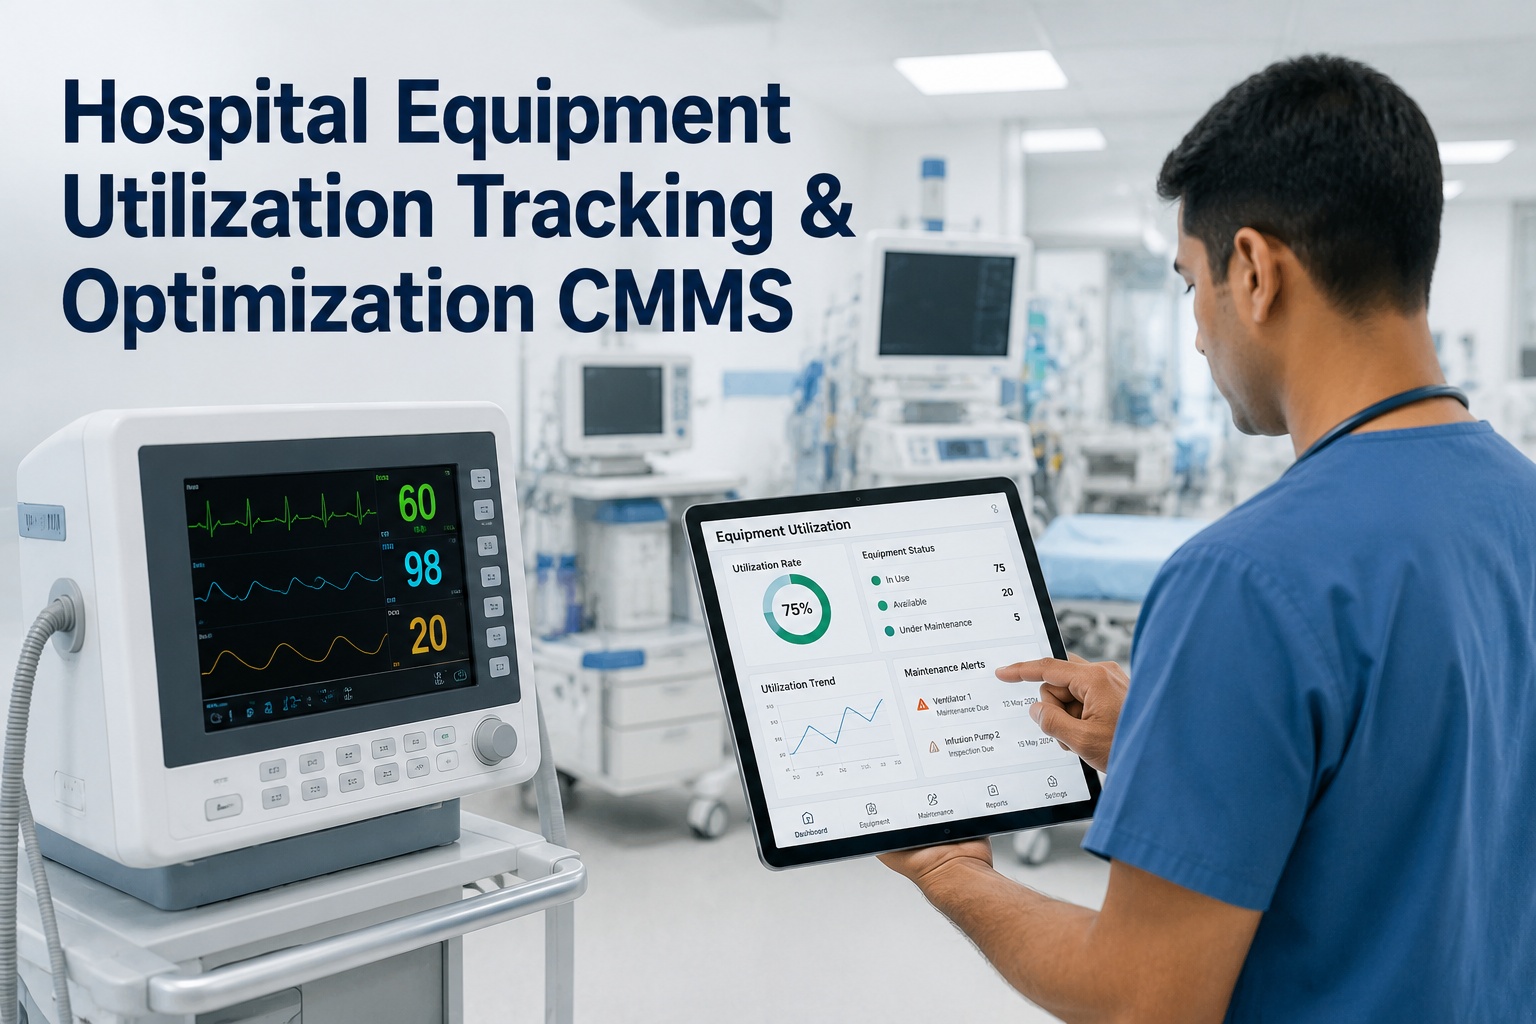
Hospital equipment utilization tracking and optimization through a CMMS is how modern clinical engineering teams stop guessing about device usage and start making data-driven decisions about what to buy, share, or retire. The average hospital runs at 42–58% utilization on mobile medical equipment, yet departments regularly request capital purchases for devices that sit idle 40% of the time. A dedicated utilization tracking CMMS for healthcare closes that visibility gap by capturing real dispatch, runtime, and idle data on every infusion pump, ventilator, and wheelchair. This 2026 guide breaks down how hospital usage tracking works, how to identify underutilized assets, and how CMMS utilization analytics convert equipment purchasing from a departmental wish-list into a portfolio-level decision. Ready to see the difference on your own asset register? Start Free Trial and upload your first 50 assets today.
Hospital Equipment Utilization Guide 2026
You Probably Own Too Many of the Wrong Devices — and Not Enough of the Right Ones
Real utilization data almost always surprises hospital administrators. A CMMS built for healthcare utilization tracking reveals which assets earn their keep, which sit idle, and where a shared equipment pool eliminates a six-figure capital purchase request.
Utilization Measurement
How to Calculate Hospital Equipment Utilization the Right Way
Most hospitals confuse "available" with "utilized." A pump sitting in a hallway is available — but it is not generating clinical value. True hospital equipment utilization measures the percentage of time a device is actively dispatched and in clinical use against the total hours it could be deployed.
Core Utilization Formula
Available Hours = total hours in period minus planned PM downtime. Deployed Hours = time asset is checked out to a patient or department via CMMS work order or dispatch ticket.
Target Benchmarks by Device Class
High-acuity devices like ventilators may justify lower utilization (redundancy for surge capacity). Standard infusion pumps and wheelchairs should sit in the 55–70% band before you consider adding units.
A 280-bed regional hospital tracked 412 infusion pumps for 90 days in OxMaint. Measured utilization averaged 38% — yet two departments had pending purchase requests for 30 additional pumps worth $180,000. The data showed that peak demand across departments never coincided. By launching a shared equipment pool managed through CMMS dispatch tickets, the hospital met 100% of peak demand with the existing fleet and cancelled the purchase — a $180K capital avoidance in a single quarter.
Right-Sizing & Shared Pools
From Departmental Request to Portfolio Decision: Right-Sizing Your Fleet
Without CMMS utilization analytics, every department sees only its own demand curve and assumes it needs more devices. The result: overlapping purchases, bloated fleets, and maintenance budgets stretched across idle assets. Right-sizing flips that dynamic.
Baseline Measurement
Tag every mobile asset with a barcode or QR label. Log all dispatch and return events through OxMaint work orders. Capture 30 days of continuous usage data to establish a real baseline — not an estimate.
Demand Pattern Analysis
OxMaint utilization analytics break down usage by department, shift, and day-of-week. Identify peak overlap windows and idle periods. Flag assets below 30% utilization for retirement or reallocation.
Shared Pool Launch
Consolidate underutilized devices into a CMMS-managed shared pool. Departments request equipment through work orders; OxMaint tracks dispatch, turnaround, and cleaning cycles. Cancel redundant purchase requests with data.
Continuous Optimization
Set automated alerts when utilization on any asset class drops below threshold or spikes above 75%. Quarterly utilization reports feed directly into capital planning — purchasing decisions now start with data, not requests.
Underutilized Asset Identification
Identifying Underutilized Healthcare Assets Before They Drain Your Budget
An underutilized asset in healthcare costs you three times: the original capital outlay, ongoing preventive maintenance, and the storage or floor space it occupies. CMMS utilization analytics surface these hidden costs automatically.
Dispatch-to-Available Ratio
OxMaint calculates the ratio of hours each asset is dispatched against total available hours. Assets below 30% for two consecutive months are flagged on the utilization dashboard — no manual reporting required.
Department Concentration Analysis
When 80% of a device's usage comes from a single department, that asset is a candidate for department-owned deployment. When usage is fragmented across 4+ departments, a shared pool is the better model.
Maintenance Cost per Deployed Hour
Divide annual PM and repair costs by deployed hours. If a $4,000 pump costs $600/year to maintain but logs only 200 deployed hours, your cost-per-use is $3.00 — often higher than a rental would cost.
Peak Demand Coincidence
Do three departments peak at the same hour, or do their demand curves offset? OxMaint overlays department-level usage timelines so you can see whether a shared pool will meet demand — or whether genuine scarcity exists.
OxMaint CMMS for Hospital Utilization
How OxMaint CMMS Drives Hospital Equipment Utilization Optimization
OxMaint is an AI-powered CMMS and EAM platform built to turn raw asset dispatch data into portfolio-level decisions. Four capabilities map directly to hospital utilization challenges — each with a measurable outcome.
Real-Time Utilization Dashboards
Live dashboards show utilization by asset class, department, and shift. Set threshold alerts for idle or overused equipment. Outcome: identify 15–25% of your fleet as right-size candidates within 60 days.
Shared Equipment Pool Dispatch
Work-order-driven dispatch manages check-out, return, and cleaning cycles for shared pools. Departments request devices through the CMMS; OxMaint tracks every handoff. Outcome: avoid $100K–$300K in annual redundant purchases.
Capital Planning Analytics
Quarterly utilization reports export directly to capital planning committees. Every purchase request is evaluated against actual fleet utilization data. Outcome: cut capital equipment spend 20–35% with zero reduction in clinical availability.
Predictive Maintenance Integration
AI models correlate utilization patterns with failure data to predict when an asset will need service — scheduling PM only when needed, not on a fixed calendar. Outcome: reduce PM downtime 30–50% and keep more assets available for clinical use.
Utilization Analytics Comparison
Spreadsheet Tracking vs CMMS Utilization Analytics: What Changes
Most hospitals still track equipment usage on spreadsheets or within biomed modules that were never designed for utilization analytics. The gap between spreadsheet tracking and a purpose-built CMMS is measurable in both dollars and clinical availability.
| Capability | Spreadsheet / Manual Log | OxMaint CMMS Utilization |
|---|---|---|
| Real-time utilization rate | Calculated monthly, often inaccurate | Live dashboard, updated per dispatch event |
| Department-level demand overlay | Not possible without manual pivot tables | Automated heat-map by department and shift |
| Shared pool dispatch tracking | Paper logs or email requests | Work-order-driven dispatch with full audit trail |
| Underutilized asset alerts | Discovered during annual inventory | Automated alert when utilization drops below threshold |
| Capital planning report export | Manual compilation, 4–8 hours per quarter | One-click quarterly utilization report |
| Maintenance cost per deployed hour | Rarely calculated | Automatically computed per asset and class |
See It On Your Assets
Stop Guessing About Equipment Utilization — Start Measuring It
Book a 30-minute demo and we will load your top 50 assets into OxMaint, configure utilization dashboards, and show you exactly where your fleet is over- or under-deployed — before you spend another dollar on capital equipment.
FAQ
Hospital Equipment Utilization Tracking — Frequently Asked Questions
What is hospital equipment utilization tracking?
Hospital equipment utilization tracking is the process of measuring how often each medical device is actively deployed in clinical use versus the total hours it is available. A CMMS captures dispatch and return events through work orders, then calculates a utilization percentage for every asset, department, and device class. This data reveals which equipment earns its keep and which sits idle — the foundation for right-sizing and shared pool decisions.
How does a CMMS improve hospital equipment utilization?
A CMMS like OxMaint automates the capture of dispatch data, calculates real-time utilization rates, and flags underutilized assets through threshold-based alerts. It also manages shared equipment pool dispatch, tracks cleaning and turnaround cycles, and exports quarterly utilization reports for capital planning — eliminating the manual spreadsheets that hide idle assets and inflate purchase requests. You can Start Free Trial to see your utilization data within 30 days.
What is a good utilization rate for hospital medical equipment?
For standard mobile medical equipment like infusion pumps, wheelchairs, and monitors, a healthy utilization rate sits between 55% and 70%. High-acuity devices such as ventilators or defibrillaries may run lower (35–50%) because redundancy and surge capacity are clinically justified. Any asset below 30% utilization for two consecutive months should be evaluated for retirement, reallocation, or inclusion in a shared pool.
How do shared equipment pools reduce hospital capital spending?
Shared equipment pools consolidate devices that are individually underutilized across multiple departments into a central, CMMS-managed inventory. Because departmental peak demand rarely coincides, a smaller shared fleet can meet 100% of clinical need. Hospitals using OxMaint for shared pool dispatch typically avoid $100,000–$300,000 in annual redundant capital purchases while maintaining or improving device availability.
How long does it take to implement utilization tracking in a hospital CMMS?
Most hospitals can begin capturing utilization data within 2–4 weeks of implementing OxMaint. Asset tagging and CMMS work-order configuration take 1–2 weeks; baseline utilization data requires 30 days of continuous dispatch logging. Meaningful right-sizing decisions can be made by day 60, and shared pool launches typically occur in month 3. Full capital planning integration is operational by month 4. To accelerate your timeline, Book a Demo and we will build your implementation plan in the session.
Get Started With OxMaint
Turn Equipment Utilization Data Into Capital Savings This Quarter
Join the clinical engineering teams using OxMaint to right-size fleets, launch shared equipment pools, and make every capital purchase a data-backed portfolio decision.
Free 14-day trial · No credit card