Hospital equipment failure does not send a warning. An MRI scanner trips offline at 6 AM. A ventilator throws a fault code mid-shift. A surgical suite HVAC system fails on a Tuesday with a full operating schedule. These are not rare disasters — they are the predictable cost of running reactive maintenance programs on aging biomedical and facility infrastructure. Across US hospital networks, UK NHS trusts, and UAE smart-hospital projects, the hidden drain of equipment downtime is measured not just in repair invoices but in cancelled procedures, diverted patients, compliance flags, and the slow erosion of clinical staff confidence in the environment around them. The gap between a high-downtime facility and a high-uptime facility is not luck — it is structure, data, and the discipline to act before failure rather than after. If your maintenance program is still largely reactive, start a free trial with your actual asset data today, or book a demo with an Oxmaint healthcare specialist this week.
Every Hour of Downtime Has a Price Tag. Most Hospitals Are Not Tracking It.
Oxmaint gives biomedical and facilities teams a single platform to schedule preventive maintenance, track asset condition, and forecast capital needs — before equipment failure makes those decisions for you. Whether you manage a single campus or a 40-location health network, the structure is the same. Start a free trial and connect your first facility in under 48 hours, or book a demo for a walkthrough mapped to your asset portfolio.
What Is Hospital Equipment Downtime — and Why Does the Definition Matter?
Hospital equipment downtime is the total period during which a clinical or facility asset is unavailable for its intended use — whether due to unexpected failure, scheduled maintenance that runs over time, parts delays, or compliance holds. For revenue-generating equipment like MRI and CT scanners, each hour of unplanned downtime costs between $1,500 and $3,000 in lost procedure revenue alone, before factoring in patient rescheduling, staff idle time, and the downstream effect on surgical and diagnostic throughput. For life-critical equipment like ventilators, infusion pumps, or medical gas systems, the stakes extend beyond revenue to direct patient safety. Facilities that define downtime narrowly — counting only catastrophic failures — systematically undercount the true cost. A thorough downtime definition includes partial failures, degraded performance states, compliance-triggered holds, and corrective work that exceeds its scheduled window. Understanding the full scope is the first step toward measuring it accurately enough to reduce it. Start a free trial to see how Oxmaint captures every downtime event across your asset portfolio, or book a demo with a solutions specialist this week.
Equipment Downtime: The Complete Picture
Total asset unavailability spanning unplanned breakdowns, compliance-triggered holds, corrective overruns, and partial performance degradation — across clinical equipment, biomedical devices, and critical facility systems including HVAC, electrical, medical gas, and water infrastructure. Every category has a cost. Most hospitals only count the first.
Eight Root Causes of Chronic Equipment Downtime in Hospitals
Unplanned equipment failures rarely happen without warning — they happen when warning signals go unread or when maintenance programs lack the structure to act on them before the failure event. These are the eight root causes that consistently drive hospital downtime rates above acceptable thresholds, and collectively they represent a solvable operational problem. Book a demo and we will map each cause directly to your current maintenance program structure.
No Preventive Maintenance Schedule Tied to Asset Records
PM tasks managed in spreadsheets or paper systems — not linked to the individual asset's service history, age, or condition score. Teams schedule maintenance by calendar interval rather than actual equipment state, missing early degradation signals that predict failure weeks in advance.
Aging Infrastructure With No Condition Visibility
Over 40% of US hospital buildings predate 1980. Mechanical and electrical systems approaching end-of-life with no condition scoring system in place fail at a rate 60% higher than assets under structured monitoring programs. Age alone does not predict failure — condition does.
Parts Unavailability at Failure Time
When a failure occurs and the required spare part is not in inventory, repair time extends from hours to days. Facilities without spare parts inventory linked to their asset records pay emergency procurement premiums of 22–28% and extend mean time to repair by an average of 3.2 days per critical failure event.
Fragmented Work Order Tracking
Without a centralized work order system with complete asset-level history, technicians repeat diagnostic work already done by colleagues, miss recurring fault patterns, and underestimate the complexity of repeat failures. Mean time to repair increases 40% at facilities with no structured CMMS work order history.
IoT Data Without Maintenance Integration
BMS sensors, SCADA systems, and connected medical equipment generate anomaly data continuously — but at most facilities, this data feeds dashboards rather than work orders. When sensor readings indicating bearing wear, temperature drift, or pressure anomaly do not automatically trigger a maintenance task, the value of IoT investment approaches zero.
Compliance Holds From Missed Inspection Cycles
Equipment placed on compliance hold due to missed calibration, certification, or inspection deadlines is effectively out of service — and the hold generates its own administrative backlog. Facilities managing inspection schedules in separate systems from their maintenance calendar miss combined deadlines at a rate 3x higher than those using an integrated platform.
Technician Overload From Poor Task Distribution
When work orders are assigned informally rather than through a structured dispatch system, high-priority corrective tasks pile onto the same two or three technicians while low-urgency PM work sits unscheduled. Productive wrench time drops below 60% at facilities without mobile-first work order management — meaning 40% of each shift is administrative overhead.
No Predictive End-of-Life Planning
Capital planning built on average useful life tables rather than individual asset condition scores consistently underestimates replacement risk for high-utilization equipment. When a critical asset reaches failure before the budgeted replacement year — costing $250K or more per event — it signals a CapEx model that prioritizes accounting convention over operational reality.
The True Cost Anatomy of a Single Unplanned Failure Event
When hospital finance teams calculate maintenance costs, they typically count the repair invoice. The real cost of a single unplanned failure event is four to seven times higher when all components are captured. Understanding this anatomy is what makes the business case for preventive maintenance programs undeniable to ownership groups, CFOs, and boards. Start a free trial to begin tracking full downtime cost per asset in your portfolio, or book a demo to see how Oxmaint builds this cost model automatically from your work order data.
Reactive vs. Planned: A Direct Operational Comparison
The financial and operational gap between reactive and planned maintenance is not theoretical — it is measurable at every asset class, every site, and every quarter. The table below maps the practical difference across eight operational dimensions that directly affect hospital budget, safety, and compliance posture. Book a demo to see this comparison modeled against your specific portfolio and asset mix.
| Operational Dimension | Reactive Model — Status Quo | Planned Model — Oxmaint |
|---|---|---|
| Repair Cost Per Event | 4.8x baseline — emergency labor, expedited parts, unplanned overtime | Baseline cost with scheduled labor and standard procurement timelines |
| Equipment Uptime Rate | Unplanned downtime averaging 15–20% of total operating hours per asset class | Uptime above 92% across maintained asset classes with structured PM |
| Mean Time to Repair | 3–5 days with no parts inventory or diagnostic history per asset | Under 6 hours with asset history, parts inventory, and technician dispatch |
| Compliance Documentation | Paper trails, missing inspection logs, audit risk at every cycle | Complete digital audit trail with timestamps and digital signatures |
| CapEx Forecast Accuracy | Spreadsheet estimates — no condition data, 40–60% variance at replacement | Condition-based rolling 5–10 year model at the individual asset level |
| Technician Productive Time | Below 60% productive wrench time due to administrative overhead | 80%+ wrench time with mobile-first work orders and structured dispatch |
| MRO Parts Spend | 22–28% emergency procurement premium on unplanned repair parts | Asset-linked inventory with automated reorder thresholds per equipment class |
| Multi-Site Visibility | Manual consolidation, 3–4 week reporting lag, inconsistent formats by site | Real-time portfolio dashboard with instant drill-down per site or asset |
How Oxmaint Rebuilds Hospital Uptime From the Asset Up
Reducing hospital equipment downtime is not a technology problem — it is a structure problem. Most facilities have data. They lack the platform to organize that data into maintenance triggers, condition scores, work order histories, and capital projections that their teams can actually act on before failure. Oxmaint provides that structure, built specifically for multi-site, compliance-heavy, capital-intensive healthcare environments. Here is how the platform maps to the specific uptime challenge in hospital operations. Start a free trial and run your first PM schedule within 48 hours of activation.
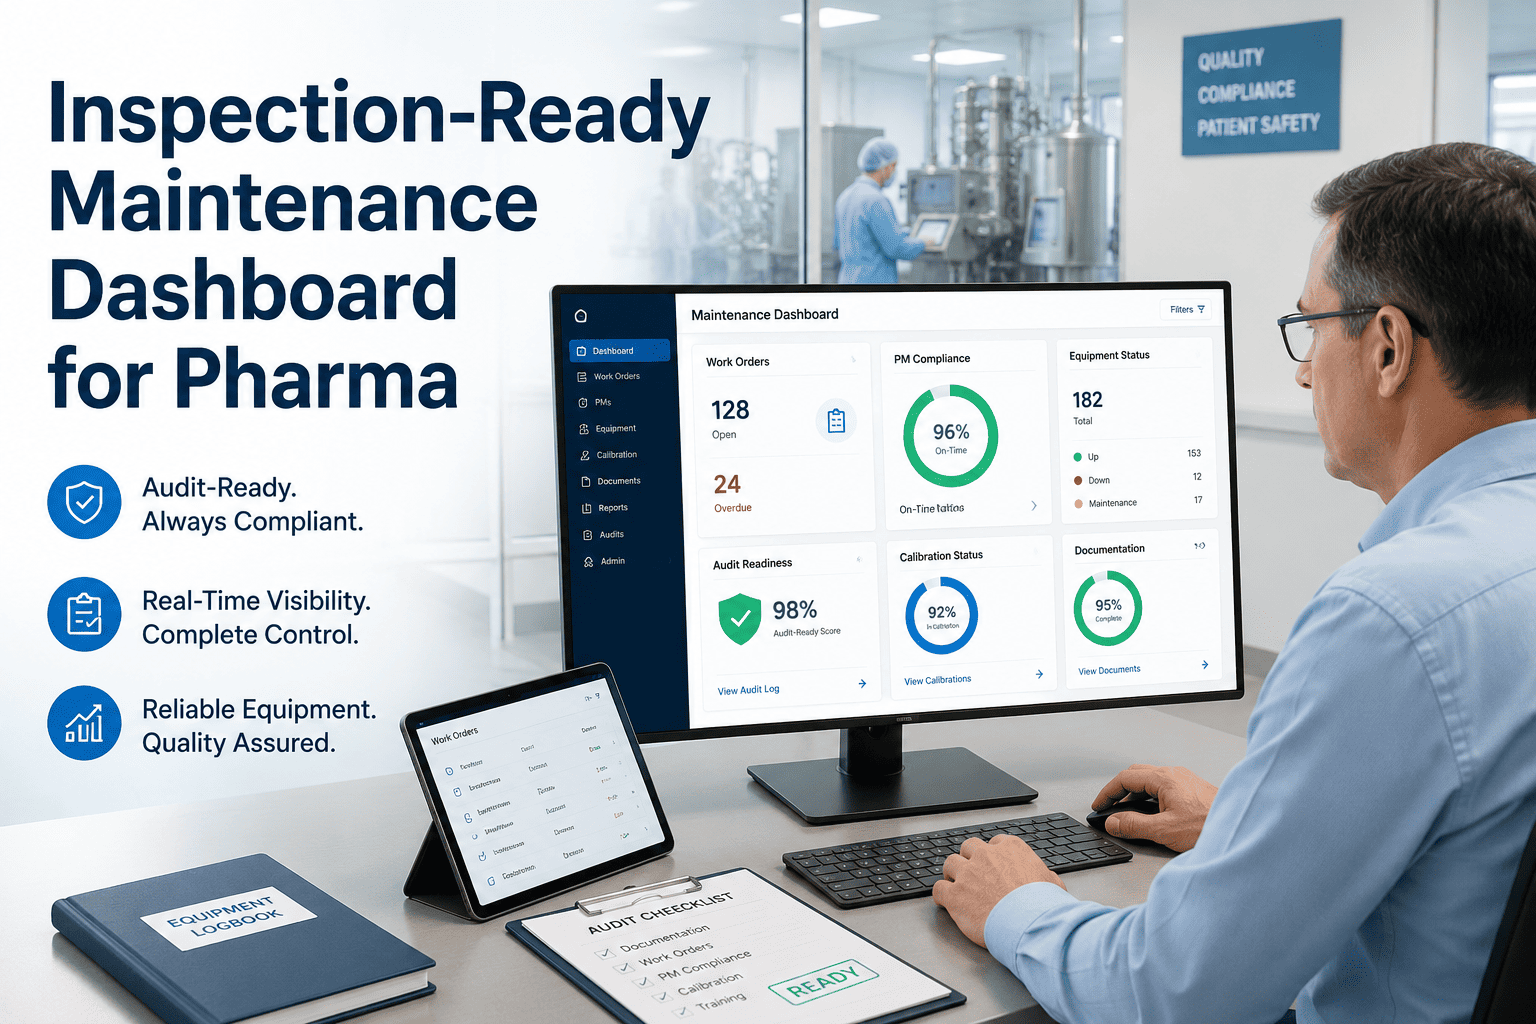
Asset Registry With Live Condition Scoring
Every asset — MRI, HVAC chiller, infusion pump, surgical suite AHU — organized in a five-tier hierarchy: Portfolio, Property, System, Asset, Component. Condition scores updated at every inspection give maintenance leadership a real-time uptime risk map across the entire portfolio, not just the sites generating complaints this week.
Preventive Maintenance Scheduling Tied to Asset Records
PM tasks built on top of individual asset records — not standalone spreadsheets. Trigger by calendar interval, usage hours, cycle counts, or live IoT sensor readings from BMS and SCADA systems. Technicians receive structured mobile work orders before failures occur, shifting the maintenance posture across every asset class on every site.
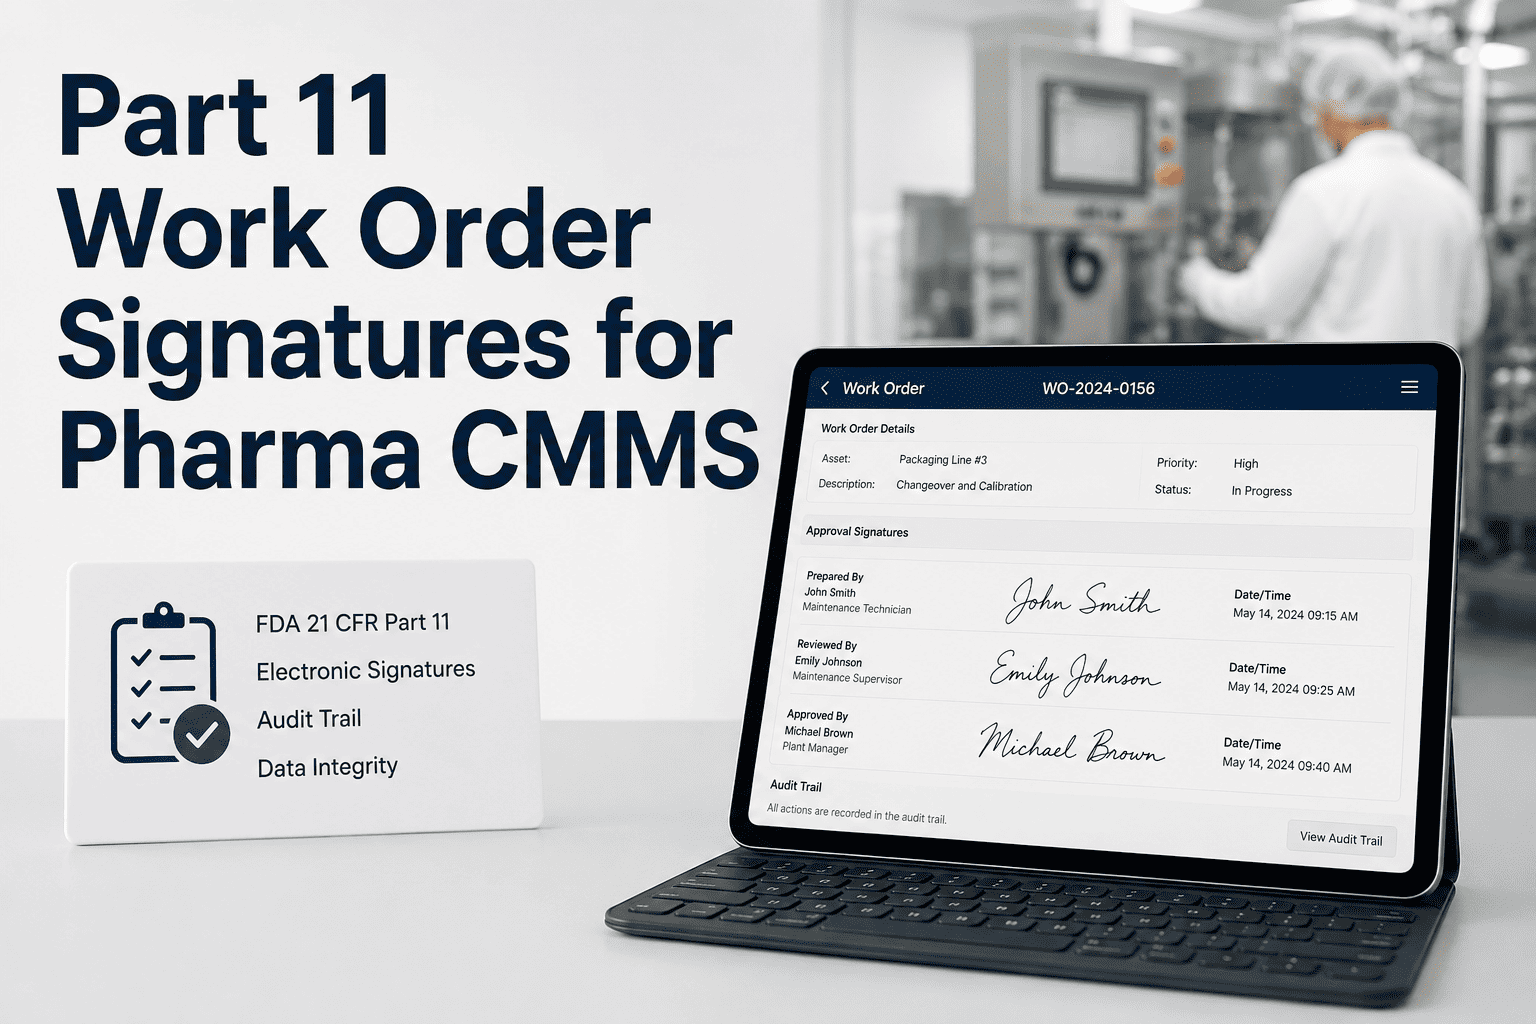
Work Order Management With Full Repair History
Every work order — corrective and preventive — carries a complete, tamper-proof record: technician identity, timestamps, parts consumed, diagnostic notes, and digital signatures. Recurring fault patterns surface automatically, reducing repeat diagnostic time and mean time to repair by up to 40% within the first operational quarter.
IoT and SCADA Integration for Condition-Based Triggers
Oxmaint connects directly to BMS, SCADA, and IoT sensor networks. Anomalies in bearing temperature, refrigerant pressure, electrical draw, or vibration automatically generate work orders before they escalate to failure events. Smart building data finally becomes maintenance intelligence rather than a dashboard no one acts on.
Spare Parts Inventory Linked to Asset Records
Critical spare parts mapped to the assets they serve — with automated reorder thresholds and consumption tracking from every completed work order. When a failure occurs, the required part is already in stock. Emergency procurement premiums drop by 22–28% within the first six months of inventory program deployment.
Predictive CapEx Modeling From Condition Data
Asset condition scores and maintenance histories feed into rolling 5–10 year capital replacement models at the asset level — not the department level. Operations leaders walk into board meetings with condition-based replacement timelines rather than useful-life table estimates, improving forecast accuracy by 3.2x over spreadsheet-based projection methods.
Downtime Reduction ROI — Numbers That Matter to Boards and Ownership Groups
Healthcare operations leaders managing real budgets and real accountability to investor or ownership groups need more than operational anecdote. They need measurable, defensible ROI from any platform investment. The metrics below reflect what Oxmaint-deployed facilities report within the first two quarters of structured maintenance program activation. Start a free trial and build your own ROI baseline from day one, or book a demo for a live model built against your portfolio size and asset mix.
Frequently Asked Questions
What is the real cost of MRI or CT scanner downtime per hour in a hospital setting?
Imaging equipment downtime costs between $1,500 and $3,000 per hour in lost procedure revenue alone, depending on facility size, payer mix, and scheduling density. When patient rescheduling losses — up to 18% of affected patients do not return — clinical staff idle time, and compliance documentation burden are added, the true per-event cost for a full-day imaging suite outage regularly exceeds $25,000 at a mid-size facility. For facilities running no structured preventive maintenance on imaging equipment, unplanned outages average 3.4 per scanner per year. Oxmaint PM scheduling tied to utilization hours and IoT sensor feeds reduces this frequency by 35% or more within the first operational quarter.
How does predictive maintenance differ from preventive maintenance in a hospital context?
Preventive maintenance uses fixed calendar or usage intervals to schedule service tasks — a useful baseline, but blind to the actual condition of the individual asset at maintenance time. Predictive maintenance uses real-time sensor data — bearing temperature, vibration frequency, pressure variance, electrical draw anomalies — to trigger maintenance only when specific condition thresholds are crossed. In hospital settings, Oxmaint combines both approaches: structured PM schedules tied to asset records provide the baseline, while IoT and SCADA integration adds condition-based triggers that catch anomalies the calendar would miss. The result is fewer unnecessary interventions and far fewer unplanned failures.
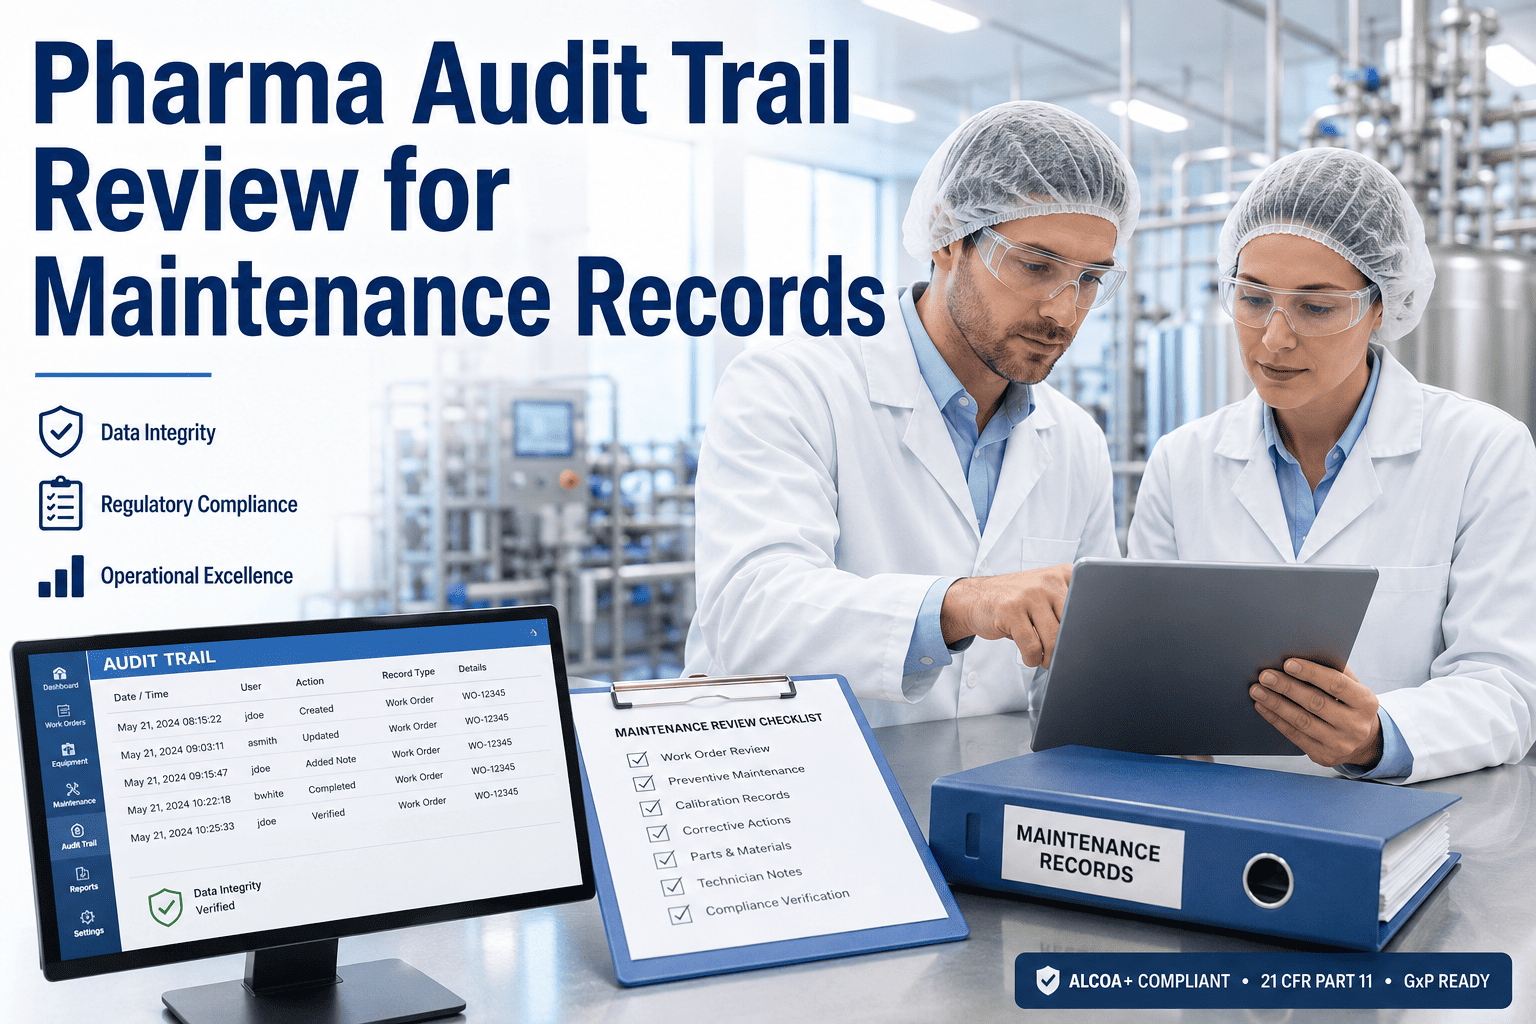
How does Oxmaint support compliance with Joint Commission and NHS building safety requirements?
Oxmaint generates a complete, tamper-proof digital audit trail for every maintenance event — technician identity, timestamps, parts consumed, inspection checklists, and digital signatures. PM completion rates, calibration records, and inspection documentation are instantly retrievable by asset, site, or date range. For Joint Commission, CQC, and NHS audits, this means a compliance officer can pull complete documentation for any asset in the portfolio in seconds rather than hours. Inspection cycles that previously consumed 8–12 staff-hours of manual file preparation are reduced to a matter of minutes with structured digital records across every location.
How fast can a hospital get started with Oxmaint — and is there a long implementation program?
Most facilities complete their initial asset registry and generate their first structured work orders within 48 hours of Oxmaint account activation. Preventive maintenance schedules, condition scoring, and portfolio reporting configurations are operational within the first two weeks. There are no heavy professional services requirements and no multi-month implementation roadmaps. Oxmaint is designed for operations leaders managing real teams under real time pressure — not IT departments with 12-month deployment programs. A free trial gives you direct access to the full platform with your actual facility data from day one, with a dedicated support specialist to guide initial setup at no additional cost.
Stop Measuring Downtime. Start Preventing It.
Whether you are managing a single hospital or a 50-location health network, Oxmaint provides the asset registry, preventive maintenance structure, condition-based capital forecasting, and compliance documentation capability that hospital operations require in 2026. No implementation drag. No guesswork. A clear view of every asset, every site, and every maintenance dollar — from day one of activation.