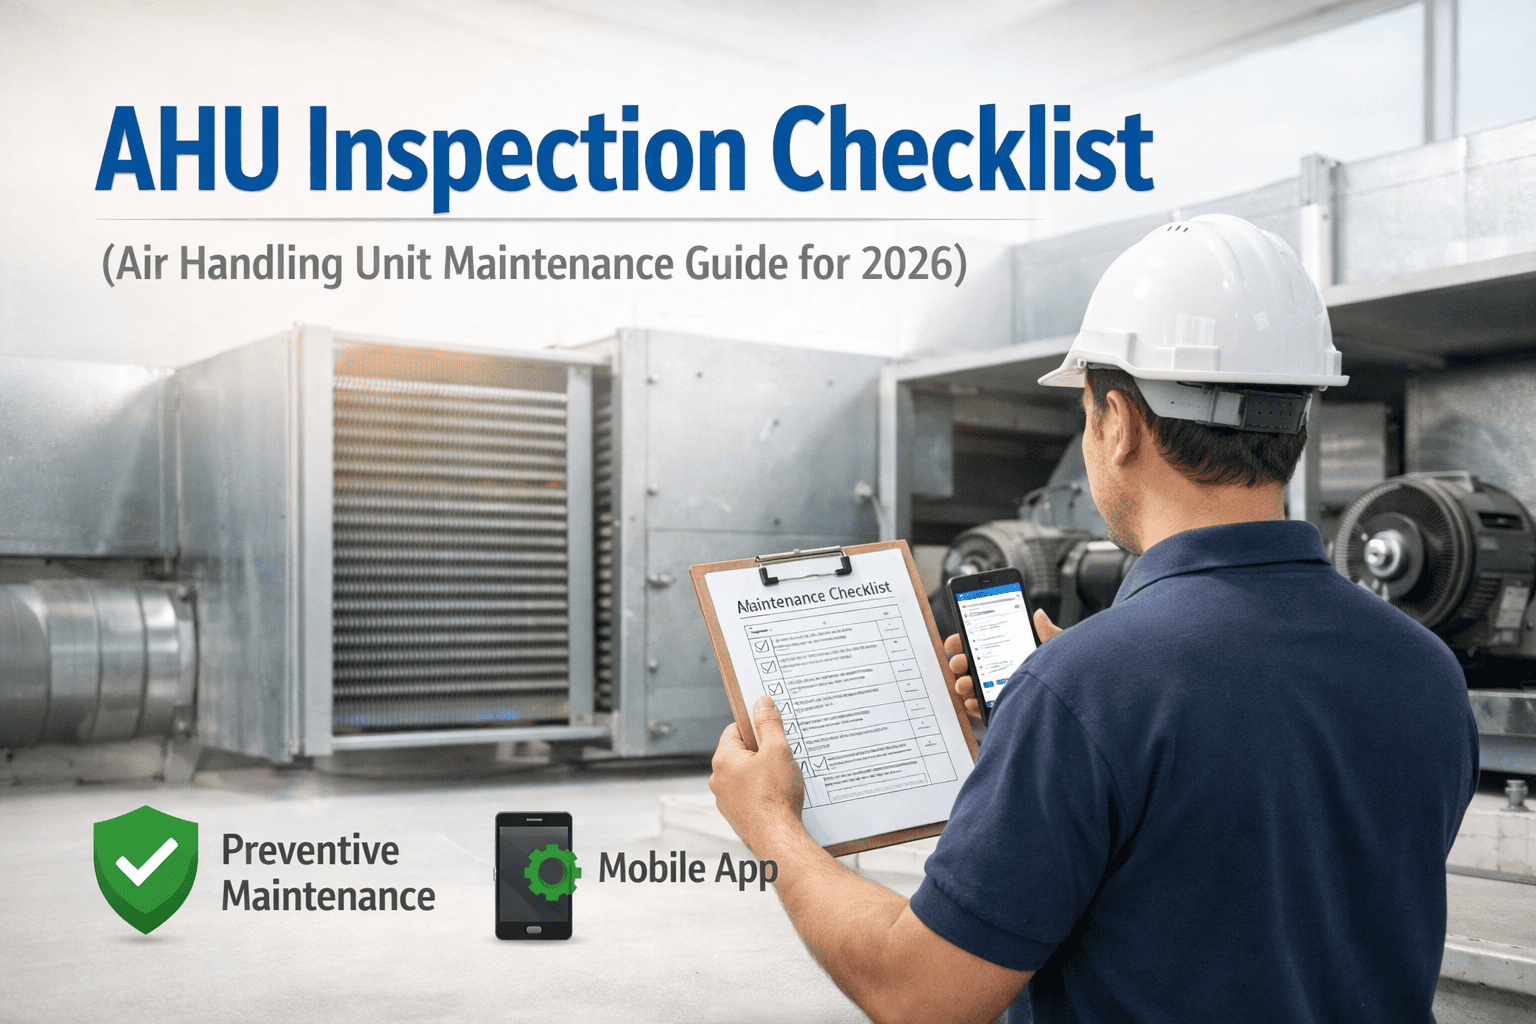
An air handling unit serving a 180,000-square-foot hospital wing develops a 2-inch water gauge increase in filter pressure drop over six weeks. Nobody notices—the BMS alarm threshold is set at 3 inches. The fan motor compensates by drawing 18% more power to maintain airflow. Eight weeks later, the motor burns out during a summer heatwave. Emergency replacement costs $28,000 and takes 36 hours. But the real consequences are far worse: three operating rooms lose positive pressurization for two days, 11 surgical procedures are rescheduled, and the facility faces a Joint Commission citation for inadequate ventilation in sterile environments. The entire chain of events started with a dirty filter that a $200 replacement would have prevented—if anyone had been tracking the pressure trend instead of waiting for a threshold alarm.
Digital AHU maintenance management powered by CMMS platforms and continuous performance monitoring changes this equation completely. Instead of relying on calendar-based filter swaps and annual coil cleanings, intelligent maintenance systems track real-time airflow, pressure differentials, temperature splits, humidity levels, and energy consumption across every AHU in your portfolio. A filter loads progressively. A coil's approach temperature widens. A damper actuator responds sluggishly. Each trend tells a story about declining performance and indoor air quality—if you have the technology to capture it. The global indoor air quality monitoring market reached $5.1 billion in 2024 and is projected to grow at 7.8% CAGR through 2032, with commercial HVAC optimization and IAQ compliance driving the fastest adoption. Leading facility teams are already leveraging digital AHU management to protect occupant health and optimize energy spend—schedule a demo to see how Oxmaint brings intelligent AHU maintenance to your building operations.
Intelligent AHU Maintenance Management
Maximizing HVAC performance, energy efficiency & indoor air quality
$5.1B
Global IAQ monitoring market value in 2024
20-40%
Energy savings with optimized AHU maintenance
35-60%
Reduction in IAQ-related occupant complaints
6-12 mo
Typical ROI achievement timeline
How Digital AHU Maintenance Management Works
Traditional AHU maintenance operates on two outdated models: reactive (respond when occupants complain about temperature or stuffiness) or calendar-based preventive (change filters quarterly and clean coils annually regardless of actual condition). Both approaches fail building occupants. Reactive maintenance means people breathe degraded air for weeks before complaints trigger action—and studies show indoor air quality can deteriorate 40-60% before occupants consciously notice discomfort. Calendar-based maintenance either replaces filters too early (wasting money) or too late (wasting energy and degrading IAQ). Digital AHU maintenance management takes a fundamentally better approach—it continuously monitors actual system performance and air quality metrics, triggering maintenance precisely when conditions warrant intervention.
The Digital AHU Maintenance Intelligence Cycle
1
Monitor
IoT sensors and BMS integration continuously capture filter ΔP, supply/return temperatures, humidity, CO₂ levels, fan speed, and energy consumption across all AHUs
2
Track
Digital asset profiles maintain complete service histories, filter inventories, coil condition records, belt replacement logs, and IAQ compliance documentation for every unit
3
Analyze
Analytics dashboards compare real-time performance against design specifications, ASHRAE standards, and historical baselines to identify degradation trends and efficiency losses
4
Alert
Condition-based triggers auto-generate prioritized work orders when filter loading, coil fouling, damper performance, or IAQ metrics cross intervention thresholds
5
Optimize
Closed-loop reporting tracks maintenance outcomes against energy use and IAQ metrics, continuously refining intervention thresholds and scheduling algorithms
The technology stack combines BMS data feeds with supplemental IoT sensors, cloud-based CMMS analytics, and mobile technician apps for seamless field execution. Industry research shows digitally managed AHU fleets achieve 20-40% energy savings through optimized filter replacement timing and coil maintenance, reduce IAQ-related complaints by 35-60%, and extend major component lifecycles by 25-40%. Buildings with integrated AHU monitoring report occupant satisfaction scores averaging 28% higher than those relying on reactive or calendar-based maintenance. Ready to transform your AHU maintenance operations? Start your free Oxmaint trial and connect your AHU assets within minutes.
Critical AHU Components for Digital Monitoring
Air handling units are complex assemblies where the performance of every component directly affects both energy efficiency and indoor air quality. A fouled cooling coil doesn't just waste energy—it reduces dehumidification capacity, allowing humidity to rise and creating conditions for microbial growth. A stuck outdoor air damper doesn't just waste heating energy—it starves zones of fresh air, driving CO₂ levels above ASHRAE 62.1 limits. The highest-value digital monitoring targets are components where degradation simultaneously impacts energy cost, occupant health, and equipment longevity.
Critical Priority
Filters & Pre-Filters
Key Metrics:
Pressure differential (ΔP), loading rate trend, MERV rating verification, bypass leakage detection
Failure Impact:
30-50% fan energy increase, IAQ degradation, downstream coil fouling, particle breakthrough
Digital Benefit:
Condition-based replacement saves 15-25% on filter spend while maintaining optimal IAQ
Critical Priority
Cooling & Heating Coils
Key Metrics:
Approach temperature, ΔT across coil, airside pressure drop, leaving air temperature stability
Failure Impact:
10-30% capacity loss, humidity control failure, freeze risk, Legionella growth in drain pans
Digital Benefit:
Fouling factor trending schedules cleaning at optimal point—20-30% energy savings
Critical Priority
Supply & Return Fans
Key Metrics:
Vibration amplitude, bearing temperature, motor current draw, VFD speed vs. airflow relationship
Failure Impact:
Complete airflow loss, zone pressurization failure, emergency AHU shutdown, fan motor burnout
Digital Benefit:
Vibration trending detects bearing wear 6-10 weeks before failure, preventing 85% of fan emergencies
High Priority
Dampers & Actuators
Key Metrics:
Commanded vs. actual position, stroke time, outdoor air fraction, mixed air temperature accuracy
Failure Impact:
Economizer failure, excessive OA heating/cooling cost, ventilation non-compliance, pressurization issues
Digital Benefit:
Actuator stroke time monitoring catches sticking dampers before energy waste or IAQ impact
High Priority
Humidification Systems
Key Metrics:
Steam cylinder conductivity, dispersion tube condition, downstream RH accuracy, mineral buildup rate
Failure Impact:
Static electricity damage, occupant respiratory irritation, product quality issues, duct corrosion
Digital Benefit:
Cylinder conductivity trending predicts replacement need 2-4 weeks before output drops
High Priority
Condensate Drain Systems
Key Metrics:
Drain pan water level, trap seal integrity, condensate pump cycle frequency, biofilm indicator
Failure Impact:
Water overflow damage, mold growth, Legionella risk, foul odors in supply air, ceiling damage
Digital Benefit:
Automated drain monitoring prevents 90%+ of water damage and microbial growth incidents
Indoor Air Quality: The AHU Maintenance Connection
Indoor air quality isn't just a comfort metric—it's a health, productivity, and liability issue with measurable financial impact. Harvard's COGFX study demonstrated that improved ventilation and IAQ increases cognitive function by 61% and reduces sick building syndrome symptoms by 30%. Post-pandemic awareness has elevated IAQ from a facilities concern to a C-suite priority, with WELL Building Standard and ASHRAE 241 compliance increasingly required by tenants and regulators. Every AHU maintenance decision directly impacts the air that occupants breathe, making AHU maintenance management the frontline defense for indoor environmental quality.
Critical IAQ Parameters Linked to AHU Maintenance
CO₂ Concentration
Indicates ventilation adequacy. Rising CO₂ signals insufficient outdoor air—often caused by stuck OA dampers, failed economizers, or incorrect BMS scheduling. Target: below 1,000 ppm per ASHRAE 62.1.
NDIR sensors | ±50 ppm accuracy | Continuous zone monitoring
Particulate Matter (PM2.5)
Measures fine particle penetration directly linked to filter condition. Spikes indicate filter bypass, seal failure, or MERV rating inadequacy. Target: below 12 μg/m³ per WHO guidelines.
Laser scattering | ±10% accuracy | Return air & zone sampling
Relative Humidity
Controlled by cooling coil dehumidification and humidifier performance. Out-of-range RH drives mold growth (>60%), static damage (<30%), and occupant discomfort. Target: 40-60% per ASHRAE.
Capacitive polymer | ±2% RH accuracy | Supply & zone monitoring
VOC Levels (TVOC)
Detects off-gassing from materials, cleaning products, and occupant activities. Elevated VOCs with adequate ventilation may indicate contaminated outdoor air intake or duct contamination.
Metal oxide or PID | ppb resolution | Supply & return air
Supply Air Temperature
Deviation from setpoint indicates coil fouling, valve malfunction, or control loop instability. Inconsistent discharge temperature drives zone complaints and energy waste simultaneously.
RTD | ±0.2°F accuracy | Pre-coil, post-coil, discharge
Airflow Volume (CFM)
Verifies AHU delivers design airflow to meet ventilation and thermal requirements. Declining CFM at constant fan speed indicates filter loading, coil fouling, or duct obstruction progressing.
Thermal dispersion or pitot array | ±3% accuracy | Main duct
The most effective digital AHU maintenance programs correlate equipment performance data with IAQ measurements to create a holistic view of system health. When CO₂ rises in a zone, the system checks whether the serving AHU's outdoor air damper is meeting its commanded position. When PM2.5 spikes, it examines filter ΔP and loading rate. This cross-referencing capability transforms IAQ monitoring from a passive reporting exercise into an active diagnostic tool that pinpoints the specific maintenance action needed to resolve each air quality issue. Need help building an IAQ-focused AHU maintenance program? Book a consultation with our building performance specialists.
Ready to Optimize Your AHU Performance and Indoor Air Quality?
Join facility teams worldwide using Oxmaint's platform to transform AHU maintenance from calendar-based guesswork into data-driven precision.
AHU Maintenance Task Framework by Frequency
Effective AHU maintenance requires a structured task hierarchy that balances component-specific inspection frequencies with condition-based triggers. Digital CMMS platforms transform these tasks from static checklists into dynamic workflows with built-in measurement validation, photo documentation, IAQ correlation, and automatic escalation when readings fall outside acceptable ranges. The key principle: high-wear, high-impact components get frequent attention while structural elements follow longer inspection cycles—but condition data can override any calendar schedule.
Comprehensive AHU Maintenance Task Schedule
Monthly Tasks
Filter ΔP reading and visual inspection, condensate drain pan check and treatment, belt tension and wear assessment (if belt-driven), general visual inspection of cabinet integrity, damper linkage spot check, and BMS alarm log review for recurring nuisance faults.
Digital workflow: Technician scans AHU QR code → mobile app loads month-specific checklist → ΔP reading auto-compared against baseline → photo required for any anomaly → work order auto-generated if threshold exceeded
Quarterly Tasks
Coil approach temperature measurement, economizer functional test, fan bearing vibration reading, VFD parameter verification, control valve stroke test, outdoor air fraction measurement, and humidity sensor calibration check against reference instrument.
Digital workflow: CMMS auto-schedules based on AHU runtime hours → task includes target values from commissioning data → deviations trigger root cause investigation protocol → results feed coil fouling trend model
Semi-Annual Tasks
Complete coil cleaning (if condition-triggered), fan motor amp draw and insulation resistance test, damper actuator full-stroke timing, condensate pump test, duct inspection at accessible points, UV lamp replacement (if equipped), and complete IAQ verification at representative zones.
Digital workflow: Pre-cleaning coil photos and approach temps documented → post-cleaning measurements compared → delta quantifies energy recovery → cost avoidance calculated automatically for ROI reporting
Annual Comprehensive
Full airflow traverse measurement against design CFM, complete electrical connection inspection and torque, control sequence verification against original design intent, drain pan integrity inspection, cabinet air leakage test, energy performance benchmarking against previous year, and compliance documentation update.
Digital workflow: Annual report auto-generated from accumulated data → year-over-year performance comparison → degradation trends flagged for capital planning → compliance documents archived with timestamps
Leading facility management organizations report that transitioning from paper-based AHU checklists to digital CMMS workflows improves task completion rates from 72% to 96%, reduces average inspection time by 35% through guided mobile procedures, and captures 4x more diagnostic data per inspection. The accumulated data creates increasingly accurate performance baselines that make condition-based maintenance triggers more precise with each completed cycle. These aren't theoretical improvements—they're measurable outcomes reported by organizations managing 50 to 5,000+ AHUs across diverse building portfolios.
Energy Optimization Through AHU Maintenance
AHU maintenance is the single highest-leverage energy optimization strategy available to building operators. HVAC systems consume 35-50% of total commercial building energy, and AHUs represent the largest controllable share of that consumption. Research from Lawrence Berkeley National Laboratory shows that poorly maintained AHUs waste 15-30% more energy than properly maintained units—meaning maintenance-driven energy recovery often exceeds the savings achievable through equipment upgrades or control strategy changes. Digital maintenance management quantifies this energy impact, turning every work order into a measurable efficiency improvement.
Your 90-Day AHU Digital Maintenance Roadmap
Days 1-30
Asset Discovery
Inventory all AHUs with design specs, CFM, coil data, and filter types
Map AHU-to-zone relationships and ventilation requirements
Import service histories, warranty data, and commissioning records
Deploy CMMS with AHU-specific asset templates and PM schedules
Days 31-60
Baseline & Connect
Integrate BMS data feeds for real-time AHU operating parameters
Deploy supplemental IAQ sensors in representative zones
Establish performance baselines for filter ΔP, coil ΔT, and energy use
Train maintenance teams on digital workflows and mobile app
Days 61-90
Intelligence
Activate condition-based maintenance triggers for filters and coils
Configure IAQ-correlated alerts linking zone conditions to AHU performance
Launch energy performance dashboards with maintenance impact tracking
Document baseline ROI and plan portfolio-wide expansion
Day 90+
Scale & Optimize
Expand digital management to full AHU portfolio across all sites
Implement predictive analytics for fan, coil, and damper degradation
Integrate with energy management and sustainability reporting systems
Develop WELL/ASHRAE 241 compliance automation and documentation
The critical success factor is choosing a CMMS platform that understands the unique relationship between AHU maintenance and indoor environmental quality. The platform must track both equipment performance metrics (filter ΔP, coil approach temperature, fan vibration) and occupant-facing outcomes (zone temperature, humidity, CO₂, particulates) within a single analytics environment—because optimizing one without the other leads to either energy waste or IAQ compromise. Equipment-agnostic platforms can manage AHUs from Carrier, Trane, York, Daikin, Mammoth, and custom-built units through the same dashboard. Want to discuss AHU maintenance transformation for your portfolio? Schedule a technical consultation to design your digital roadmap.
Measuring ROI: The Business Case for Digital AHU Maintenance
Digital AHU maintenance delivers returns across three powerful dimensions: energy cost reduction, occupant health and productivity gains, and extended equipment lifecycles. Unlike many capital investments that require years to show returns, AHU maintenance optimization delivers measurable savings from the first month—because you're eliminating waste that's happening right now. Industry benchmarks confirm that digitally managed AHU programs reduce total HVAC energy consumption by 20-40%, decrease IAQ-related complaints by 35-60%, and extend major component lifecycles by 25-40%.
AHU Digital Maintenance ROI Framework
Direct Cost Savings
20-40%
Reduction in AHU-related energy consumption
50-75%
Fewer emergency AHU repair events
15-25%
Savings on filter and consumable spend through optimal timing
Operational Improvements
35-60%
Reduction in occupant IAQ and comfort complaints
96%+
PM task completion rate with digital workflows
25-40%
Extended fan motor, coil, and damper actuator lifespan
Strategic Value
Verified
ASHRAE 62.1/241 and WELL Building compliance documentation
Improved
Occupant productivity and reduced absenteeism from better IAQ
Strengthened
ESG reporting with verified energy and IAQ performance data
A corporate campus with 14 buildings and 86 AHUs transitioned from calendar-based to digital condition-based maintenance management. Within the first year, energy costs attributed to AHU operations dropped 31%—saving $420,000 annually. Filter spend decreased 18% despite improving average filtration performance, because condition-based replacement eliminated both premature changes and overloaded filters wasting fan energy. Comfort complaints dropped 52%, and the facility achieved WELL Building Silver certification using IAQ data automatically documented by the CMMS platform. Total first-year savings of $580,000 against a system investment of $95,000 delivered 6.1x ROI. These results repeat across every building portfolio that commits to data-driven AHU management. The question isn't whether digital AHU maintenance pays for itself—it's how much you're wasting every month without it. Create your free Oxmaint account today and start optimizing your AHU fleet with real performance data.
Transform Your AHU Maintenance and Indoor Air Quality
Stop guessing when to change filters and clean coils. Start managing AHU performance with data-driven intelligence that protects occupant health and optimizes energy spend.
Frequently Asked Questions
How does condition-based AHU maintenance differ from calendar-based schedules?
Calendar-based AHU maintenance changes filters every 90 days and cleans coils annually regardless of actual condition—wasting money on premature replacements while missing units that need attention sooner. Condition-based maintenance monitors real-time filter ΔP, coil approach temperature, fan performance, and IAQ metrics to trigger maintenance precisely when conditions warrant it. This optimizes both cost and air quality simultaneously, ensuring every maintenance dollar delivers maximum impact on system performance and occupant health.
What IAQ standards should our AHU maintenance program target?
At minimum, target ASHRAE 62.1 ventilation requirements (CO₂ below 1,000 ppm, minimum outdoor air per person and per square foot). For higher-performance buildings, align with ASHRAE 241 (infection risk management), WELL Building Standard v2 (comprehensive IAQ thresholds), or LEED Indoor Environmental Quality credits. Digital CMMS platforms can track compliance against multiple standards simultaneously and auto-generate documentation for audits and certifications.
How much does digital AHU maintenance management cost to implement?
CMMS platform subscriptions typically cost $50-$150 per user per month. Supplemental IAQ sensors range from $200-$1,000 per zone depending on parameters monitored. Most facilities leverage existing BMS data feeds, minimizing hardware costs. ROI typically arrives within 6-12 months through energy savings alone—filter optimization, coil cleaning timing, and economizer performance recovery. Starting with your highest-energy AHUs demonstrates value quickly before portfolio-wide expansion.
Can one platform manage AHUs from different manufacturers and BMS systems?
Yes—equipment-agnostic CMMS platforms integrate with major BMS systems (Siemens, Johnson Controls, Honeywell, Schneider, Tridium) through BACnet, Modbus, or API connections to pull AHU operating data regardless of equipment manufacturer. This unified approach is critical for portfolios with mixed-vintage buildings where AHUs span multiple brands, vintages, and control system generations—all managed through a single maintenance intelligence dashboard.
Which AHU components should we prioritize for digital monitoring?
Start with the three highest-impact components: filters (greatest energy impact from loading), cooling coils (simultaneous energy and IAQ impact from fouling), and fans (highest failure cost and safety consequence). These components provide the fastest ROI through energy savings and avoided emergency repairs. Expand to damper actuators, humidifiers, and condensate systems as your digital maturity grows—each additional monitoring point refines the system's ability to correlate equipment performance with occupant-facing outcomes.