The High Cost of Deferred HVAC Maintenance: Why Proactive Care Saves Money
By Mark Strong on March 19, 2026
A facilities director at a 180,000-square-foot logistics center skipped the chiller tune-up three years in a row. Budget was tight, the system was running, and the work order kept getting pushed. Last August, the compressor failed on the hottest week of the year. The emergency replacement cost $94,000. Downtime cost another $61,000 in lost productivity. A single tune-up would have cost $2,200. That is what deferred HVAC maintenance actually costs — not the money you save by skipping it, but the five-to-one penalty you pay when the system finally breaks. If your team is still deferring maintenance without visibility into the risk, sign up free on OxMaint or book a demo to see what the analytics dashboard shows about your current exposure.
Cost Analysis
The Real Price of Deferred HVAC Maintenance
Every skipped service call is a future emergency repair with a 5x markup
5x
Cost multiplier: deferred vs. proactive maintenance
30%
Extra energy consumed by poorly maintained HVAC systems
$15K
Average emergency HVAC repair cost vs. $800 planned PM
63%
Of HVAC failures are directly traceable to missed preventive maintenance
How Deferred Maintenance Turns Small Costs Into Large Ones
Deferred HVAC maintenance does not eliminate a cost. It converts a small, predictable, planned cost into a larger, unpredictable, emergency one — and adds energy waste, equipment degradation, and downtime risk in between. The pattern is consistent across every building type. Understanding the cost escalation sequence is the first step to making the business case for proactive programs.
The Deferred Maintenance Cost Escalation Chain
How a skipped $800 filter replacement becomes a $47,000 compressor failure
Month 0 — Task Deferred
Filter replacement skipped, belt inspection missed
The PM work order is pushed for the third consecutive quarter. The system continues running. No immediate symptom is visible. Budget pressure is relieved by $800.
Cost deferred: $800
Months 1-4 — Efficiency Degradation
Clogged filters restrict airflow, increasing motor load
System works harder to move air through dirty filters. Energy consumption rises 8-15%. The efficiency loss is invisible on most utility bills but accumulates daily across every operating hour.
Hidden cost accumulating: $220/month in excess energy
Months 5-8 — Component Stress
Fan motor overheats, belt wear accelerates, bearings degrade
Restricted airflow causes the fan motor to run at elevated temperatures. Belt wear that would have been caught at inspection is now critical. Bearing degradation begins. The system is now one stress event from failure.
Risk accumulating: component damage value $3,400-$8,200
Month 9 — Cascade Failure
Bearing failure causes motor burnout and compressor damage
During a heat wave, the degraded system fails completely. The bearing seizure damages the motor shaft. Debris from the motor reaches the compressor. What started as a filter-and-belt issue is now a major mechanical failure requiring emergency response.
Emergency repair bill: $14,800 — $47,000+
Day of Failure — Total Exposure
Emergency repair + downtime + lost productivity + tenant/occupant impact
Emergency contractor premium (1.8-2.4x standard labor rate), parts at spot price, expedited shipping, building downtime, occupant complaints, potential lease penalty clauses, and lost productivity — all from a task that cost $800 to prevent.
Total exposure: $22,000 — $94,000 vs. $800 prevented cost
The Five Cost Categories of Deferred HVAC Maintenance
Most facility managers focus on the repair bill when calculating the cost of HVAC failure. The repair bill is typically the smallest component. The full cost of deferred maintenance spans five categories — and most of them never show up on a maintenance budget line. Sign up to track all five categories in OxMaint's analytics dashboard.
Five Cost Categories: What Deferred HVAC Maintenance Actually Costs
The full financial picture — beyond the repair invoice
01
Energy Waste
8-30% excess consumption
Dirty filters, fouled coils, low refrigerant charge, and worn belts all force HVAC equipment to work harder for the same output. This inefficiency runs 24/7 and accumulates silently on every utility bill.
Example: A 200,000 sf office building with deferred coil cleaning consumes an estimated $38,000-$64,000 in excess energy annually before any equipment failure occurs
02
Emergency Repair Premium
1.8-2.4x standard labor rate
Emergency HVAC calls carry after-hours labor premiums, expedited parts procurement, spot-market pricing on components, and dispatch costs that planned maintenance never incurs. The same compressor swap costs dramatically more when urgent.
Example: A planned compressor replacement quoted at $8,200 becomes a $17,400-$22,000 emergency replacement when the failure occurs on a Friday evening in August
03
Equipment Lifespan Reduction
40-60% shorter service life
Chillers properly maintained last 25-30 years. Reactively maintained, they average 12-15 years. AHUs, cooling towers, and rooftop units show similar patterns. Every deferred service task accelerates the depreciation curve on capital assets worth $50,000-$1M+.
Example: A $180,000 chiller replaced at year 14 instead of year 26 due to deferred maintenance represents $84,000 in accelerated capital expenditure
04
Productivity and Downtime Loss
$150-$1,400/hour depending on building type
In commercial offices, productivity drops 6-9% per degree above comfort range. In manufacturing and food processing, an HVAC failure can halt production lines entirely. Healthcare HVAC failures trigger immediate regulatory and patient care consequences.
Example: A 4-hour HVAC failure in a 300-person call center during peak hours represents $18,000-$34,000 in productivity loss before any repair costs are counted
05
Compliance and Liability Exposure
$10,000-$268,000 in regulatory fines
Building performance regulations, Joint Commission standards, CMS requirements, and Legionella prevention mandates all require documented maintenance histories. A deferred maintenance record is a compliance gap that surveyors find — and regulators fine.
Example: NYC Local Law 97 penalties reach $268/ton of CO2 over the emissions limit — a deferred maintenance program that degrades HVAC efficiency directly increases carbon output and fine exposure
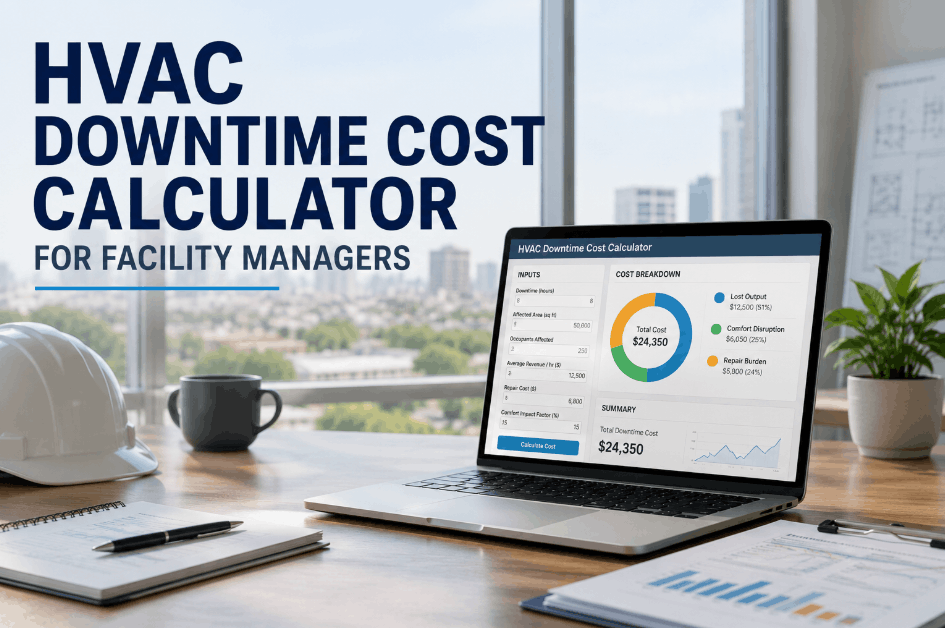
See your deferred maintenance cost exposure in real time
OxMaint's Analytics Dashboard tracks overdue PMs, calculates risk exposure by asset, and shows the projected cost of deferral vs. the cost of completion — giving facility managers the data to act before the failure bill arrives.
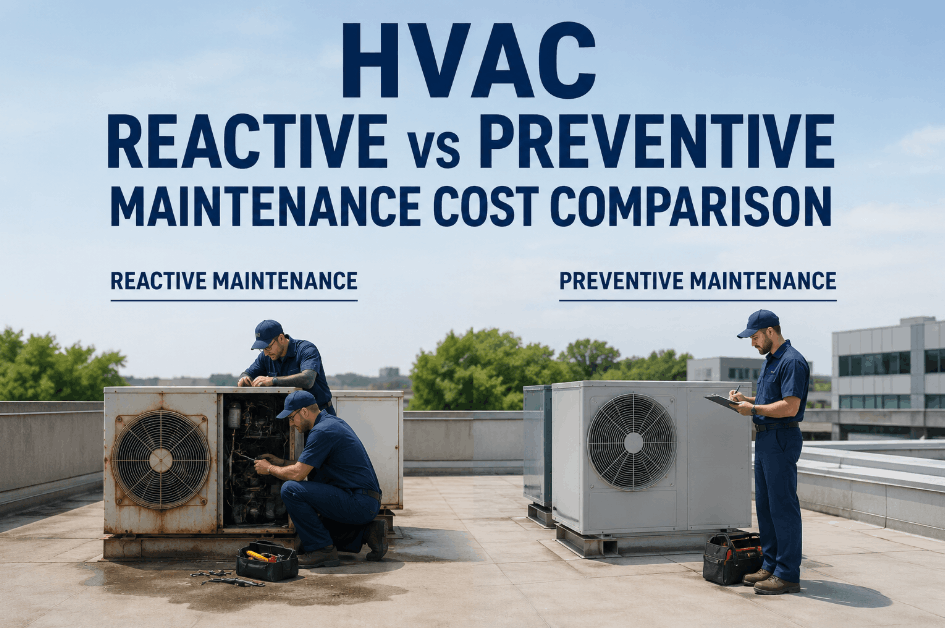
True Cost Comparison: Proactive Maintenance vs. Deferred Reactive
10-year total cost of ownership for a representative 150,000 sf commercial building HVAC system
Reactive / Deferred Program
Annual PM spend$12,000
Emergency repairs (avg/yr)$68,000
Excess energy cost (avg/yr)$44,000
Downtime / productivity loss$31,000
Early equipment replacement$210,000
10-Year Total Cost$1,650,000
vs
Proactive Maintenance Program
Annual PM spend$38,000
Emergency repairs (avg/yr)$9,000
Excess energy cost (avg/yr)$0
Downtime / productivity loss$4,000
Early equipment replacement$0
10-Year Total Cost$510,000
$1.14M
10-year savings from proactive vs. reactive program — same building, same equipment
3.2x
Higher total cost under reactive program vs. proactive despite lower annual PM spend
69%
Of total reactive program cost comes from energy waste and emergency repairs — not PM spend
The Most Commonly Deferred Tasks — and What They Cost When Skipped
Not all deferred maintenance carries equal risk. Some tasks are low-consequence if delayed a few weeks. Others create cascading failures within months. The table below maps the most commonly deferred HVAC maintenance tasks to their deferral risk level and the cost consequence when they graduate from a skipped PM to an emergency event. Book a demo to see how OxMaint tracks and prioritizes overdue tasks by risk level.
Deferred HVAC Task Risk and Cost Consequence Matrix
Ranked by escalation risk — tasks marked Critical should never be deferred beyond one PM cycle
Maintenance Task
PM Cost
Deferral Risk
Consequence When Skipped
Emergency Cost Range
Coil cleaning — evaporator and condenser
$400-$900
Critical
Fouled coils reduce heat transfer 20-40%, force compressor to work harder, accelerate refrigerant overheating and compressor failure
$12,000-$48,000
Filter replacement — all AHU units
$80-$300
Critical
Restricted airflow overloads fan motor, degrades IAQ, increases energy consumption 8-15%, can cause freeze-up in cooling season
$3,400-$18,000
Refrigerant charge verification
$150-$400
Critical
Low refrigerant causes compressor to overheat, oil breaks down, compressor fails. Also a regulatory violation under EPA Section 608
$8,000-$47,000
Belt inspection and tension
$60-$180
High
Worn belts slip or break, shutting down AHU fan without warning. Often fails during peak demand when consequences are worst
$800-$3,200
Bearing lubrication — all rotating equipment
$120-$350
High
Dry bearings overheat and seize. Bearing failure can damage shaft, motor windings, and driven equipment in cascade sequence
$2,400-$22,000
Condensate drain cleaning
$80-$200
High
Blocked drain causes overflow, water damage to equipment, ceiling, and structure. Mold growth in drain pan creates IAQ and liability issues
$4,000-$35,000
Cooling tower basin cleaning
$600-$1,800
Critical
Sediment accumulates Legionella. Regulatory violation with fines to $10,000/day plus outbreak liability exposure of $500K-$2.8M
$78,000-$2,800,000
Economizer damper calibration
$200-$500
Moderate
Stuck dampers eliminate free cooling opportunity. Energy loss is invisible but continuous — hundreds of hours of missed free cooling per year
$8,000-$24,000 energy waste/yr
Chiller tube cleaning
$800-$2,400
High
Scale on tubes reduces heat transfer, forces higher condenser water temperatures, increases chiller energy 10-25%, accelerates compressor wear
$15,000-$90,000
Swipe to view full table
Know exactly which tasks are overdue and what skipping them costs
OxMaint's Analytics Dashboard flags overdue PMs by risk level, calculates the projected cost of continued deferral, and generates work orders automatically — so the right tasks get done before they become the wrong kind of urgent.
Why Facility Teams Keep Deferring — and How to Stop
Four Reasons Deferred Maintenance Persists — and the Fixes That Work
Understanding the organizational patterns that keep reactive cycles going
No visibility into overdue task risk
When all overdue PMs look the same on a list, teams prioritize by loudness — whatever tenant complained last, whatever manager asked. The $80 filter replacement that will cost $18,000 if skipped again looks identical to the $200 task that has zero consequences if delayed.
Fix
Risk-stratified PM queues in CMMS — tasks ranked by failure consequence, not just by due date. OxMaint flags high-risk overdue tasks separately from low-consequence deferrals.
Budget approval requires justification that does not exist
Finance departments that have never seen a proactive maintenance ROI report default to treating maintenance as discretionary. Without cost-of-deferral data, the conversation becomes "we need to spend $38,000 on HVAC" instead of "we need to spend $38,000 now to avoid $155,000 later."
Fix
Analytics reports that quantify deferred maintenance cost exposure — showing finance the projected cost of not acting. OxMaint generates these reports automatically from maintenance history and asset risk data.
Technician time is consumed by emergency response
Teams in reactive cycles spend 60-70% of technician time on emergency calls. That leaves no scheduled capacity for preventive work, which generates more emergency calls, which consumes more emergency capacity. The cycle is self-reinforcing and will not break without deliberate intervention.
Fix
PM scheduling tools that protect preventive maintenance time from emergency displacement — with escalation alerts when PM capacity falls below threshold. Breaking the cycle requires making PMs non-negotiable in the schedule.
No documentation of what has been deferred and for how long
When deferred tasks are not tracked, the risk accumulates invisibly. A filter replacement that has been skipped three consecutive quarters appears as a single overdue task — not as a three-quarter-old risk that has been accumulating equipment stress for nine months.
Fix
CMMS tracking that records how long each PM has been deferred, not just whether it is overdue. Age-of-deferral visibility changes how managers prioritize catch-up work and communicate risk to leadership.
What Proactive HVAC Maintenance Looks Like in Practice
Proactive vs. Reactive: What the Day-to-Day Difference Looks Like
The operational habits that separate high-performing maintenance programs from reactive ones
Situation
Reactive Team
Proactive Team
HVAC system running warm
Waits for tenant complaint, then dispatches emergency call
Analytics dashboard alerts on approach temperature deviation — PM dispatched before occupants notice
Budget cycle planning
Requests maintenance budget based on prior year spend plus guess
Presents CMMS report showing PM cost, projected failure risk, and cost-of-deferral analysis to support the ask
Compressor making noise
Waits to confirm failure, then calls emergency contractor at 2x labor rate
Vibration trend flagged in CMMS weeks earlier — planned replacement scheduled during off-hours at standard rate
Regulatory survey visit
Scrambles to compile maintenance records, finds gaps, risks citation
Runs compliance report in OxMaint — complete timestamped history produced in under 15 minutes
High energy bill arrives
No baseline data — cannot determine cause, cannot prove improvement
Compares against energy baseline in dashboard — identifies specific equipment degradation driving the increase
Frequently Asked Questions
How much does deferred HVAC maintenance actually cost per year?
Industry data consistently shows that reactive/deferred HVAC programs cost 3 to 3.2 times more than proactive programs over a 10-year period when all cost categories are included. For a 150,000 square foot commercial building, the difference typically amounts to $100,000-$140,000 per year in additional costs — spread across excess energy consumption, emergency repair premiums, accelerated equipment replacement, and productivity losses. The highest-risk single cost event is major chiller or compressor failure, which averages $47,000-$94,000 in emergency replacement and downtime costs per incident.
Which deferred maintenance tasks carry the highest risk?
The four highest-risk deferral items are coil cleaning (leads directly to compressor failure), refrigerant charge verification (EPA regulatory violation plus compressor damage), cooling tower basin cleaning (Legionella risk with $500K-$2.8M liability exposure), and condensate drain maintenance (water damage and mold). These tasks have asymmetric risk profiles — the PM cost is $80-$1,800, but the consequence of skipping is $10,000-$2,800,000. All other maintenance tasks can be assessed by urgency after these four are addressed.
How does a CMMS help prevent deferred maintenance from accumulating?
A CMMS addresses deferred maintenance at the source by automating PM scheduling so tasks are assigned and tracked without relying on manual calendar management. More importantly, modern CMMS platforms like OxMaint provide analytics dashboards that show the age of each deferred task, the projected cost of continued deferral by asset, and the risk-weighted priority order for catch-up work. This converts the conversation from "we have overdue tasks" to "here is exactly what it will cost if we do not act this week" — which is the language that moves maintenance budgets.
How do I make the business case to leadership for proactive HVAC maintenance?
The strongest business case uses three data points: current deferred maintenance cost exposure (how much is at risk right now if the highest-risk deferred tasks escalate to failure), 10-year total cost comparison between reactive and proactive programs for your specific building size, and the cost differential between planned and emergency labor rates for your most critical assets. OxMaint's analytics dashboard generates all three data sets automatically — giving facility managers a board-ready cost analysis that finance departments can evaluate against the PM budget request without requiring manual calculation or estimation.
Every deferred PM is a future emergency with a 5x price tag
OxMaint's Analytics Dashboard gives facility managers real-time visibility into deferred maintenance risk exposure — which tasks are overdue, what they cost to complete now, and what they cost if they escalate. Stop managing HVAC reactively. Start making maintenance decisions with data.