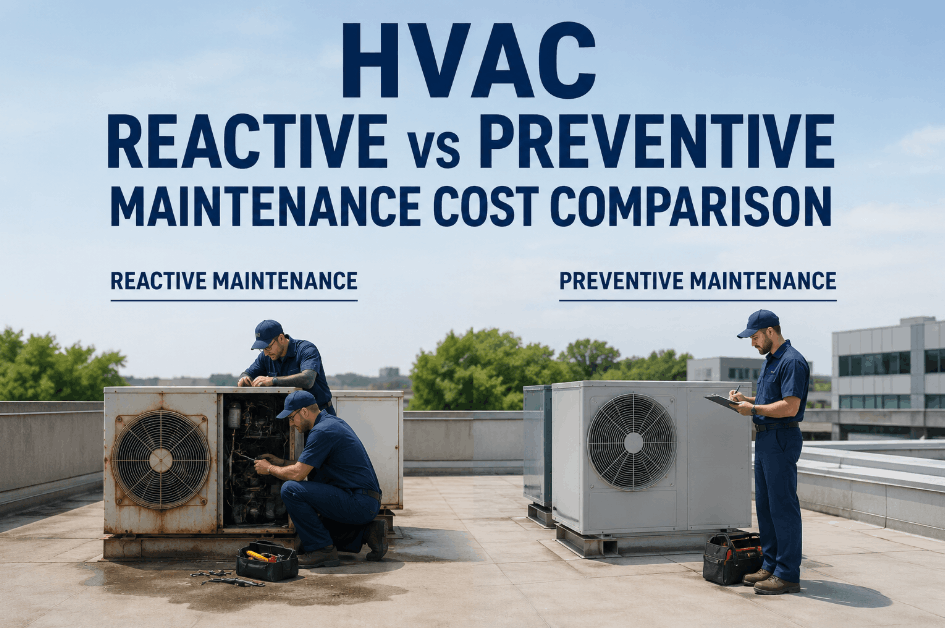
HVAC reactive vs preventive maintenance is fundamentally a cost decision disguised as a technical one. Emergency HVAC repairs run 50% to 100% more than standard service calls, and running equipment to failure costs three to ten times more than a proper preventive program once overtime labor, expedited parts, and secondary damage are counted. The most cited industrial benchmark puts the multiplier at 4.8x — emergency reactive repairs cost 4.8 times more than the same work performed as scheduled maintenance. The trap is that reactive spending looks cheaper on the maintenance budget line because the largest costs never appear on the repair invoice. Sign Up Free to model your true reactive cost with OxMaint's work order cost tracking. A compressor replacement that costs $1,200 in parts and labor during a planned visit can exceed $3,000 as an emergency once rush service, overtime, and building downtime are added. Book a Demo to see the five-year cost gap modeled against your own asset base.
HVAC Preventive Maintenance · Cost Comparison · 2026
HVAC Reactive vs Preventive Maintenance Cost Comparison
See the 3x emergency repair premium, the five-year true-cost gap, and the equipment lifespan impact — with CMMS-based preventive scheduling that eliminates it.
4.8xEmergency reactive repairs cost 4.8 times more than the same work done as scheduled maintenance
50%Total maintenance cost reduction from planned programs vs reactive, per U.S. DOE research
70–75%Reduction in equipment breakdowns achievable with well-structured preventive programs
5–8 yrAdditional equipment lifespan preventive maintenance adds versus a neglected system
4 Hidden Cost Categories That Make Reactive Maintenance Expensive
The repair invoice is the smallest part of what a reactive failure costs. When HVAC equipment breaks unexpectedly, the cost ripples through several expense categories that never appear on the maintenance budget line — which is exactly why reactive maintenance keeps looking cheaper than it is. The categories below are where OxMaint's cost tracking surfaces the real number. Sign Up Free to attach true cost to every work order in OxMaint.
01
Overtime Labor Premium
Cost Driver: Emergency Timing
50–100% Premium
Failures do not respect shift schedules. When a unit stops on the hottest afternoon of summer, technicians arrive at overtime rates of 1.5 to 2 times standard. The same repair may need two technicians on emergency callout instead of one during a planned window.
02
Expedited Parts & Freight
Cost Driver: Rush Procurement
20–40% Markup
Planned maintenance orders standard-lead-time parts at normal pricing. Emergency repairs take whatever is available, shipped as fast as possible. Expedited freight on a critical part can cost five to ten times standard ground shipping.
03
Building Downtime & Productivity Loss
Cost Driver: Occupant Impact
Largest Hidden Cost
This is typically the single largest cost and the one least likely to appear on a maintenance report. An uncomfortable or uninhabitable building drives tenant complaints, lease-renewal risk, and lost productivity — none of which lands on the repair invoice.
04
Secondary Cascading Damage
Cost Driver: Collateral Failure
3–5x Component Value
Equipment that fails catastrophically rarely fails alone. A worn belt caught during a scheduled visit is a cheap replacement; the same belt ignored can damage a compressor or motor, turning a minor part into a full rooftop unit replacement.
Reactive vs Preventive — Five-Year Cost & Reliability Comparison
The financial gap between the two strategies is wider than most facility managers realize, and it compounds every year the program stays reactive. The comparison below shows how the same asset base performs on cost, downtime, and data under each approach — and where OxMaint shifts the ratio. Book a Demo to model the cost shift for your facility's equipment.
Reactive-to-Preventive Transition Maturity — Where Does Your Program Score?
Most facilities sit somewhere between pure breakdown response and a fully scheduled preventive program with cost tracking and PM-compliance reporting. The framework below identifies where a program operates today and the highest-impact next step to close the cost gap. Book a Demo to assess your transition maturity with an OxMaint solutions engineer.
Reactive-to-Preventive Maturity
Score 5 = scheduled PM with cost tracking · Score 1 = breakdown response only
5
Scheduled PM · True-Cost Tracking · Compliance Reporting
Preventive work orders auto-generate per asset. Every work order carries full cost — labor, parts, downtime. PM completion rates tracked per asset, per team, per site above 80%.
Profile: Emergency spend is the exception. Cost data drives interval optimization and CapEx forecasting.
4
Scheduled PM · Partial Cost Capture
Preventive schedules run reliably. Repair costs logged but downtime and secondary damage not consistently attributed. PM compliance measured on critical assets only.
Action: Attach full cost — including downtime — to every work order. The hidden categories are where the gap lives.
3
Mixed Program · Reactive-Dominant
Some PM scheduled, but the majority of labor still goes to breakdown response. No MTBF baseline. Reactive treated as "free" because full cost is not modeled.
Gap: The reactive-to-planned ratio is the single biggest lever. Shifting critical assets to scheduled PM is the highest-impact move.
2
Informal PM · Emergency-Driven Spend
Maintenance happens when something breaks. Occasional filter changes but no structured schedule. Emergency premiums absorbed as the cost of doing business.
Risk: Budgets are unpredictable and equipment fails early. A basic PM schedule pays for itself on the first prevented breakdown.
1
Pure Run-to-Failure
Equipment runs until it stops. No PM, no cost tracking, no asset history. Every repair is an emergency at premium rates.
Risk: This is the most expensive strategy once full cost is counted — and the data to prove it does not exist yet.
Model the True Cost of Reactive Before Your Next Emergency Invoice.
OxMaint attaches full cost to every work order, tracks PM compliance per asset, and surfaces the reactive premium hiding in your maintenance budget — in one CMMS platform.
How OxMaint Shifts You From Reactive to Preventive
OxMaint connects preventive scheduling, work order cost tracking, and PM-compliance reporting into a single workflow that makes the reactive premium visible and then eliminates it. Industry benchmarks show facilities implementing structured PM via a CMMS reach ROI within six to twelve months through reduced emergency repair, lower overtime, and avoided downtime. Sign Up Free to build your preventive schedule in OxMaint. Book a Demo to see PM compliance reporting configured for your facility.
Auto-Generated PM
Per Asset, On Schedule
Scheduled work orders
OxMaint generates preventive work orders per asset on interval, assigns them, and tracks completion — moving labor off breakdown response and onto planned work.
Work Order Cost Tracking
True Cost Per Repair
Labor, parts, and variance
Every work order carries cost data so the reactive premium stops hiding. Compare planned versus emergency spend per asset with real numbers.
PM Compliance Reporting
80%+ Drives Results
Completion rate per team
OxMaint tracks PM completion per asset, team, and site — so managers see where compliance falls short before failures occur, the key ROI driver.
Asset Lifecycle View
Repair vs Replace
CapEx forecasting data
Cost history per asset surfaces units approaching economic end-of-life — so repair spend that should trigger replacement is caught, not repeated.
"
We were convinced our reactive approach was the cheaper option because the PM contract quotes always looked expensive on paper. Then we put a year of work orders into OxMaint with actual cost attached — overtime, expedited freight, the two days a wing sat at 82 degrees. The reactive spend was more than double what a scheduled program would have cost, and one compressor failure alone would have funded the entire PM year. We shifted our critical rooftop units to scheduled PM and the emergency calls dropped off within two quarters.
Maintenance Manager — Mid-Size Commercial Facility, 140,000 sq ft, Texas, USA
Frequently Asked Questions
How much more does reactive HVAC maintenance cost than preventive?
Emergency repairs run 50% to 100% more than standard service calls, and the most cited industrial benchmark puts reactive repairs at 4.8 times the cost of the same work done as scheduled maintenance.
Why does reactive maintenance look cheaper than it is?
The repair invoice is the smallest cost. Overtime labor, expedited freight, building downtime, and secondary damage rarely appear on the maintenance budget line, so reactive spend is systematically underestimated.
How does OxMaint make the reactive cost premium visible?
OxMaint attaches full cost to every work order and compares planned versus emergency spend per asset, so the hidden reactive premium becomes a number managers can see and act on.
How quickly does a CMMS-based preventive program pay off?
Industry benchmarks show ROI within six to twelve months through reduced emergency repair costs, lower overtime, and avoided downtime — often from a single prevented compressor failure.
Is reactive maintenance ever the right choice?
Yes, when applied deliberately to non-critical assets through a formal criticality analysis. Run-to-failure is a legitimate strategy for the right equipment — the problem is when it becomes the default by neglect.
Stop Letting Reactive Repairs Eat a Budget You Can Predict.
OxMaint structures preventive scheduling, true-cost work order tracking, and PM-compliance reporting — so you shift the ratio from emergency response to planned work with data behind every decision.