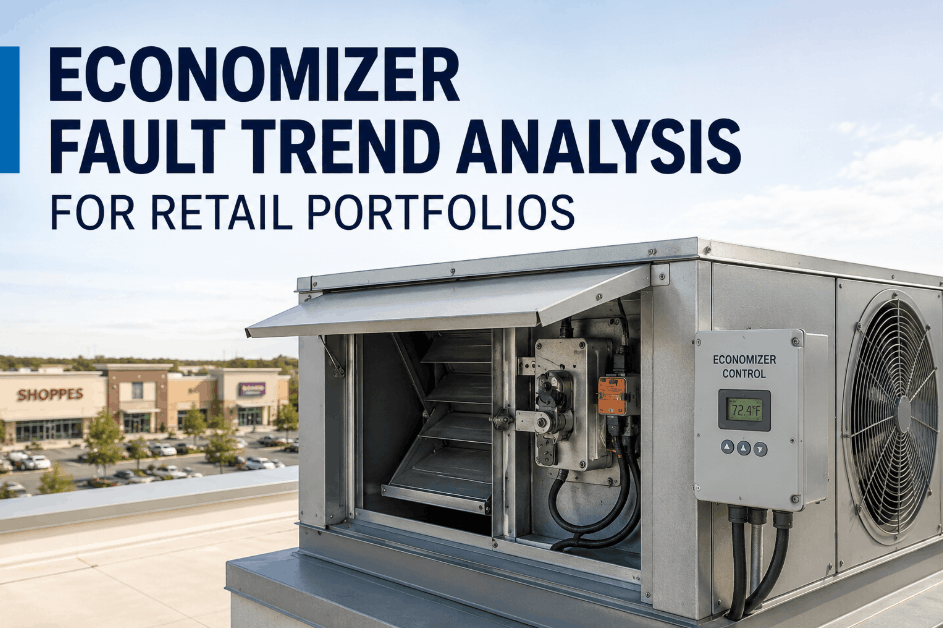
Economizer fault trend analysis helps retail facility teams identify recurring damper position errors, mixed-air temperature anomalies, and seasonal control failures across distributed store locations — before those faults start driving up HVAC energy costs or triggering comfort complaints from store managers. Retail portfolios face a compounding challenge: economizer faults are intermittent, hard to diagnose remotely, and rarely reported until they cause a noticeable problem. Sign Up Free to connect your retail HVAC units to Oxmaint AI and begin building the fault trend history your portfolio needs to catch economizer issues before they repeat. Oxmaint monitors damper behavior, mixed-air temperatures, and seasonal control performance across every connected unit, flagging trend patterns that indicate an economizer is degrading before a full failure occurs. Book a Demo to see how retail facility teams use Oxmaint for portfolio-wide economizer fault trend analysis.
Stop Discovering Economizer Faults After They Show Up in Utility Bills
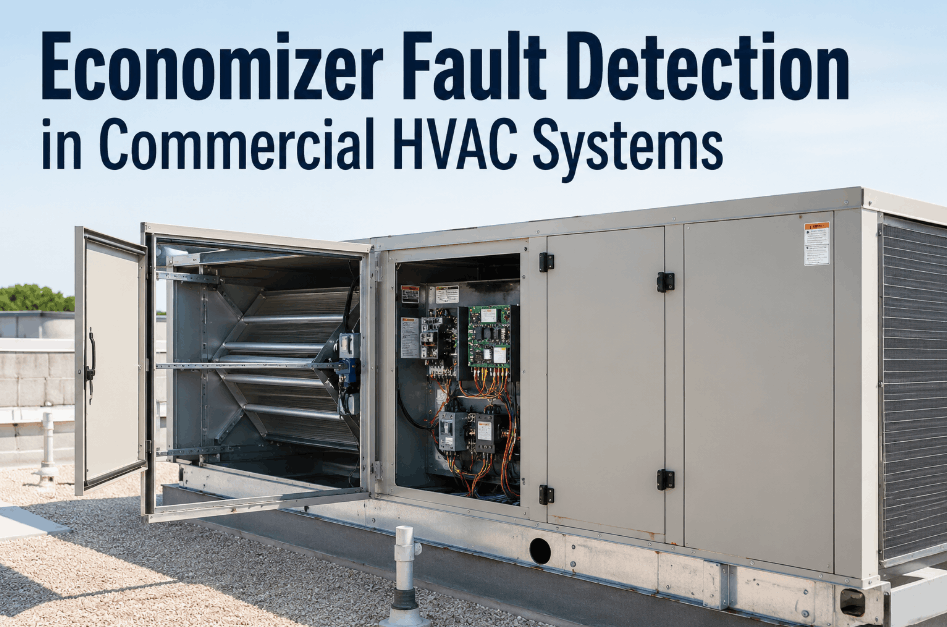
Oxmaint AI monitors damper position, mixed-air temperature, and seasonal HVAC behavior across your retail portfolio — generating fault trend reports that surface economizer issues early, across every location.
Gap #1
Faults Are Intermittent and Missed
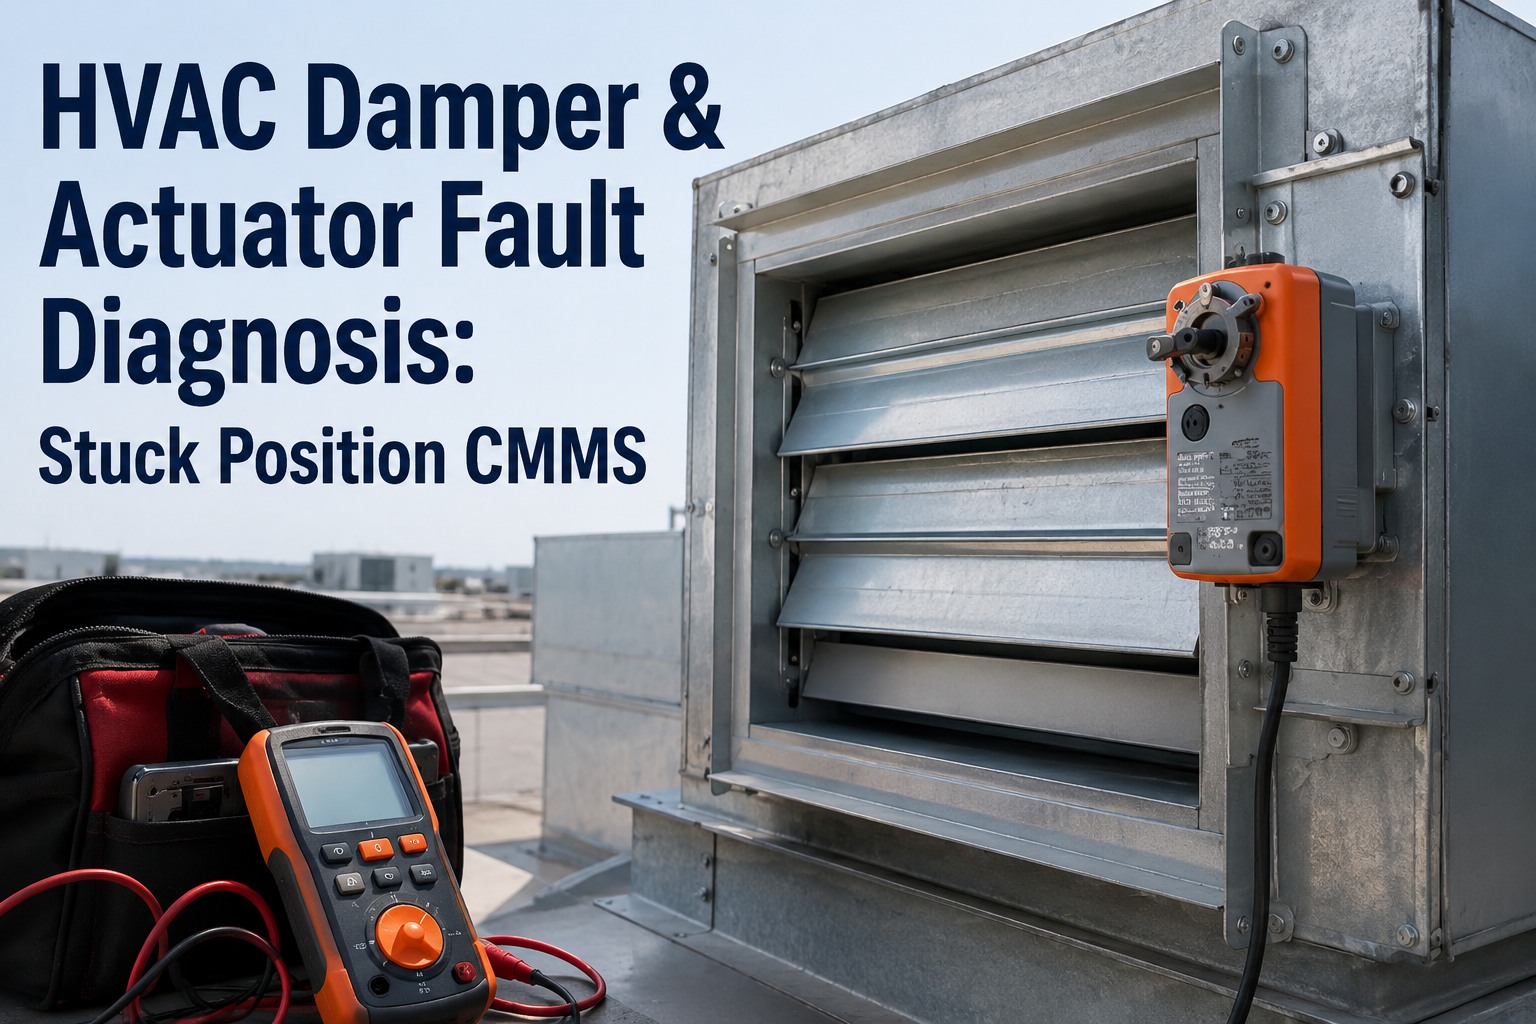
Economizer faults — stuck dampers, sensor drift, control failures — often appear and clear before a service visit, leaving no documented history of the fault pattern.
Gap #2
No Cross-Location Trend Visibility
Retail portfolios manage dozens of locations, but fault data is siloed per store, making it impossible to identify which fault types are trending across the portfolio.
Gap #3
Damper Position Not Monitored Continuously
Damper position is rarely logged between service visits, so stuck-open or stuck-closed conditions persist for weeks before anyone detects the energy or comfort impact.
Gap #4
Mixed-Air Temperature Anomalies Untracked
Mixed-air temperature deviations from expected setpoints are not recorded historically, making seasonal fault analysis impossible without manual data collection.
Gap #5
Seasonal Behavior Not Compared Year Over Year
Without a seasonal baseline, teams cannot determine whether current economizer behavior is within normal range or reflects a degradation from the prior year's performance.
Gap #6
Service Dispatch Not Prioritized by Fault Frequency
When fault trend data is unavailable, service dispatch is reactive and equal across locations — missing the opportunity to prioritize stores with the highest fault recurrence.
01
RTU and Controller Connection
Connect rooftop units and economizer controllers across all retail locations to Oxmaint so damper position, mixed-air temp, and control status stream in continuously.
→
02
Fault Pattern Logging
Oxmaint records each economizer fault event with timestamp, fault type, duration, and location — building a cross-portfolio trend history that accumulates over time.
→
03
Seasonal Trend Analysis
Fault frequency, damper behavior, and mixed-air temperature trends are analyzed season over season to identify which units are degrading and which fault types are recurring portfolio-wide.
→
04
Priority-Ranked Service Dispatch
Stores with the highest fault frequency and most severe trend patterns are surfaced for priority dispatch, so field resources go to locations with the greatest need.
Fault Data Layer
Economizer fault events logged with type, timestamp, and duration
Damper position recorded continuously between service visits
Mixed-air temperature deviation tracked against setpoint history
Trend Analysis
Fault frequency trend built season over season per location
Cross-portfolio fault type ranking updated continuously
Year-over-year seasonal behavior compared per RTU
Control Diagnostics
Economizer control response logged against outdoor conditions
Sensor drift patterns identified from historical mixed-air data
Seasonal changeover behavior compared to expected control logic
Operational Outcome
Economizer faults caught before they compound into energy loss
Service dispatch prioritized by fault trend severity across stores
Recurring fault patterns addressed at root cause rather than symptom
94%
Prediction accuracy reported by teams using Oxmaint AI on connected HVAC sensor data across retail locations
62%
Reduction in unplanned HVAC downtime among retail facilities using continuous fault trend monitoring
48hrs
Typical time from RTU connection to first economizer fault trend dashboard in Oxmaint
1season
Time needed to establish a seasonal fault baseline for year-over-year economizer trend comparison
Standard CMMS — Reactive Fault Response
Economizer faults recorded only when reported by store staff or found during scheduled service visits
No continuous damper position or mixed-air temperature history between service visits
Fault data stored per work order with no cross-location trend aggregation
Seasonal economizer behavior not compared year over year — no degradation baseline
Service dispatch prioritized by complaint volume rather than fault trend severity
Recurring fault patterns identified only after multiple service calls to the same unit
Oxmaint AI — Trend-Driven Fault Analysis
Economizer faults logged automatically from connected sensors as they occur — Sign Up Free
Damper position and mixed-air temperature recorded continuously across every connected RTU
Cross-portfolio fault trends aggregated and ranked by frequency and type automatically
Year-over-year seasonal comparison reveals whether each unit is degrading or stable
Service dispatch ranked by fault trend severity — highest-risk locations serviced first
Recurring fault patterns surfaced from trend history for root cause investigation
These KPIs give retail facility teams measurable evidence of economizer health across the portfolio and the trend direction each location is moving in. Book a Demo to see Oxmaint track all six automatically.
KPI 01
Number of economizer fault events per store over a rolling period. Locations with increasing fault frequency are flagged for priority attention before failures become chronic.
Portfolio Ranking
KPI 02
How often damper position falls outside expected range relative to outdoor conditions and setpoints. Persistent deviation signals a mechanical or control failure requiring service.
Damper Health
KPI 03
Difference between actual mixed-air temperature and expected value based on outdoor conditions and damper position. High variance is an early indicator of sensor drift or economizer control degradation.
Sensor Accuracy
KPI 04
Whether the same fault types reappear each season at the same locations. Recurrence confirms that prior service did not resolve the root cause and deeper intervention is needed.
Fix Durability
KPI 05
Estimated additional energy consumption attributable to economizer faults at each location. Quantifies the utility cost of unresolved faults and prioritizes remediation by financial impact.
Cost Attribution
KPI 06
Average time between fault events per RTU. Declining MTBF on a unit indicates accelerating degradation and signals that a deeper inspection or replacement decision is approaching.
Degradation Signal
Grocery and Food Retail
Grocery chains use Oxmaint to track economizer behavior on RTUs serving refrigerated and food-handling areas, where HVAC fault impact is compounded by product safety requirements. Sign Up Free for your portfolio.
Apparel and Specialty Retail
Apparel and specialty retailers use Oxmaint to monitor economizer performance across dozens of locations, catching damper and mixed-air anomalies before store managers report comfort problems. Book a Demo for your stores.
Big Box Retail
Large format retailers use Oxmaint to manage economizer fault trends across facilities with multiple RTUs per location, identifying which units are trending toward failure before service is needed.
Franchise Networks
Franchise operators use Oxmaint to give both corporate facility teams and local managers a consistent view of economizer fault trends, supporting standardized service and reporting across the network.
Get Portfolio-Wide Economizer Fault Trend Visibility in Oxmaint
Oxmaint AI connects to retail RTUs and tracks damper position, mixed-air temperature, and seasonal fault behavior across every location — so fault trends surface before they become energy losses or service calls. Book a Demo to see how.
It is the practice of recording and analyzing economizer fault events over time to identify recurring patterns, seasonal degradation, and which locations have the highest fault frequency across a retail portfolio.
Oxmaint connects to RTU controllers and sensors, recording damper position, mixed-air temperature, and fault events continuously so trend data accumulates automatically without manual data collection.
Yes. Fault type data from all connected locations is aggregated and ranked, so facility teams can see which fault categories are most frequent across the portfolio and allocate service resources accordingly.
Yes. Oxmaint builds a seasonal fault baseline per unit and compares current behavior to prior seasons, flagging units where performance is degrading relative to historical norms.
Most teams see their first cross-location economizer fault dashboard within 48 hours of connecting RTUs. A full seasonal baseline typically develops within one cooling or heating season of continuous monitoring.
Start Building Your Retail Portfolio Economizer Fault Trend History in Oxmaint
Oxmaint AI gives retail facility teams continuous economizer monitoring across all locations — so fault trends surface early, service dispatch goes to the right stores, and seasonal degradation is caught before it drives up utility costs.