HVAC systems account for 40–60% of total energy consumption in commercial buildings — and industry research consistently shows that 30% of that energy is wasted through inefficiency, poor scheduling, and undetected equipment degradation. The gap between a building running on reactive HVAC management and one using AI-driven energy analytics is not a technology investment story — it is a measurable cost line that appears on every utility bill. OxMaint's Energy and ESG Reporting platform detects HVAC energy waste automatically, optimises runtime scheduling across asset classes, and gives facility managers actionable analytics that reduce utility costs without replacing equipment.
Blog · Energy Optimization · AI Analytics
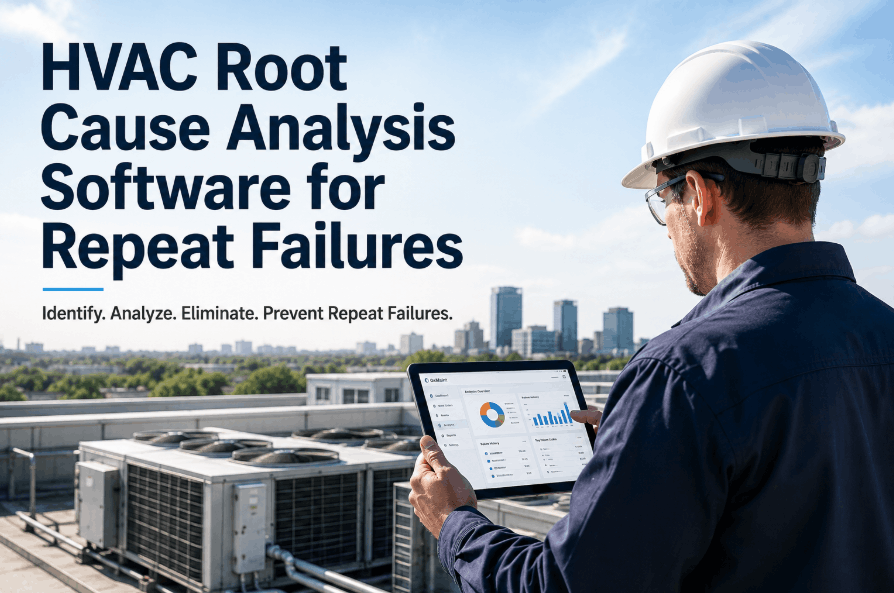
HVAC Energy Optimization AI for Commercial Buildings
Waste Detection · Runtime Optimization · Utility Cost Reduction · ESG Reporting · Live Analytics
AI-Detected Savings Opportunity
$38,400
Annualised · 3 buildings · 12 waste patterns identified
23%
Energy Waste Detected
40–60%
Of commercial building energy consumed by HVAC systems
30%
Average HVAC energy wasted in commercial buildings — DOE data
15–25%
Utility cost reduction achievable with AI-driven HVAC optimization
18 months
Average payback period for AI energy analytics deployment
12 HVAC Energy Waste Patterns AI Detects Automatically
01
After-Hours Runtime
Avg waste: 18% of total runtime
HVAC running at full capacity in unoccupied zones after business hours — detected by comparing runtime logs against occupancy schedules.
02
Simultaneous Heating and Cooling
Avg waste: 12–20% per zone
Heating and cooling systems fighting each other in adjacent zones — a control logic failure that AI detects from supply air temperature vs setpoint conflicts.
03
Dirty Filter Pressure Drop
Fan energy increase: 15–25%
Clogged filters force fans to work harder. AI correlates static pressure readings with filter replacement schedules to flag overdue filters before energy penalty compounds.
04
Chiller Operating Below Optimum COP
Efficiency loss: 8–15%
Chillers running below rated coefficient of performance due to refrigerant charge issues, condenser fouling, or setpoint drift — detected from kW/ton trend monitoring.
05
Dead Band and Setpoint Conflicts
Control energy waste: 5–12%
Overlapping heating and cooling setpoints with insufficient dead band cause continuous cycling. AI identifies setpoint configurations generating excess compressor starts per hour.
06
Economizer Lockout During Suitable Conditions
Free cooling missed: up to 30%
Economizers stuck in mechanical cooling mode during conditions where outdoor air could provide free cooling — detected by correlating outdoor enthalpy with cooling energy consumption.
Energy Performance Benchmarks — Commercial Building HVAC
| Building Type |
HVAC Energy Intensity (kWh/m²/yr) |
High-Performance Target |
OxMaint Alert Trigger |
| Office — Naturally ventilated |
55–75 |
Below 50 |
10% above building baseline trend |
| Office — Fully air conditioned |
95–135 |
Below 90 |
Month-over-month increase above 5% |
| Retail — Single-level |
110–160 |
Below 100 |
kWh/m² above peer group median |
| Hotel — Full service |
180–280 |
Below 160 |
HVAC share above 55% of total energy |
| Hospital — Acute care |
350–500 |
Below 320 |
Air change compliance + energy trend combined |
| Data Centre — Colocation |
PUE target: 1.4–1.6 |
PUE below 1.35 |
PUE trend rising week-over-week |
How OxMaint AI Detects and Acts on Energy Waste
1
Baseline Established — First 30 Days
OxMaint ingests runtime logs, energy meter data, and work order history to establish an asset-level energy baseline. Benchmarks are set per building type, season, and occupancy profile — not generic industry averages.
2
Anomaly Detection — Continuous
AI algorithms monitor energy consumption patterns against the established baseline. Deviations exceeding the configured threshold — typically 8–12% above baseline — trigger an investigation alert with the probable cause identified from maintenance and operational context.
3
Root Cause Linked to Maintenance Status
OxMaint correlates energy anomalies with open work orders, overdue PMs, and recent fault history. A chiller consuming 15% more energy than baseline is automatically cross-referenced against its condenser cleaning schedule and refrigerant charge history — giving the facility manager the probable cause before they open the plant room.
4
PM or Corrective Work Order Generated
When an energy anomaly is linked to a maintenance cause, OxMaint generates the relevant work order automatically — condenser clean, filter replacement, refrigerant check — and tracks energy recovery after the work order is closed to confirm the intervention was effective.
"
The most common misconception I encounter when working with facility managers on HVAC energy reduction is that the problem requires new equipment. In the majority of buildings I have audited, the energy savings available from better maintenance and smarter scheduling exceed what any equipment replacement programme would deliver — and at a fraction of the capital cost. A chiller running at 78% of its rated COP due to fouled condenser tubes is not a capital problem. It is a PM scheduling problem. OxMaint makes that visible by connecting energy consumption data to maintenance history in real time. When a facility manager can see that their AHU #3 consumed 22% more energy than baseline in March and that its filter was 6 weeks overdue, the cause-and-effect relationship is undeniable — and the fix costs $80 in labour and parts, not $80,000 in new equipment.
Priya Menon, MBA, LEED AP O+M
Director of Sustainability & Energy — Commercial Portfolio Operations · 18 Years Building Energy Management and ESG Reporting · LEED Accredited Professional (Operations & Maintenance) · Specialising in AI-driven energy analytics, HVAC optimisation for mixed commercial portfolios, and ESG energy reporting frameworks
Your HVAC Systems Are Wasting 30% of Their Energy Right Now. AI Can Find Exactly Where.
OxMaint's energy analytics connect runtime data, maintenance history, and utility consumption to identify waste patterns, generate corrective work orders, and track recovery — automatically.
ESG Reporting — From HVAC Data to Carbon Disclosure
Scope 1
Direct Combustion Emissions
Gas-fired HVAC, boilers, and CHP units — OxMaint tracks fuel consumption from work order data and calculates Scope 1 CO2e for GRI and TCFD reporting.
Scope 2
Purchased Electricity
Chiller, AHU, fan, and pump electrical consumption — tracked per asset and converted to CO2e using location-based or market-based emission factors.
SECR
UK Streamlined Energy Reporting
OxMaint generates SECR-compliant energy consumption reports from HVAC runtime and maintenance data — reducing annual reporting preparation from weeks to hours.
ENERGY STAR
Portfolio Benchmarking
OxMaint's energy intensity metrics align with ENERGY STAR Portfolio Manager inputs — supporting annual benchmarking and building performance standard compliance tracking.
Frequently Asked Questions
How does OxMaint connect HVAC energy data without replacing existing meters or BMS systems?
OxMaint integrates with existing energy meters, BMS platforms, and submetering systems via BACnet, Modbus, and MQTT protocols — or through manual meter reading entry for facilities without smart meters. For BMS integration, OxMaint pulls runtime hours, set points, and alarm data at configurable intervals without requiring BMS replacement. The energy analytics layer is built on top of whatever data sources the facility already has — adding intelligence without infrastructure disruption. Most commercial buildings achieve meaningful energy analytics from OxMaint within 30–60 days of deployment using existing meter and BMS data.
Start a free trial to assess your building's current data readiness.
What is the minimum data required for OxMaint to detect HVAC energy waste?
At minimum, OxMaint requires utility bill data (monthly or interval), HVAC equipment asset register, and work order history to begin detecting anomalies against baseline. With interval meter data (15-minute or hourly), the waste detection accuracy increases significantly — enabling real-time anomaly alerts rather than monthly trend analysis. Adding BMS runtime data, filter change logs, and equipment PM completion records allows OxMaint to correlate energy anomalies with specific maintenance causes, which is where the most actionable intelligence comes from. Even facilities starting with only monthly utility bills and manual work order data typically identify 3–5 significant waste patterns within the first 60 days.
Book a demo to see what OxMaint can detect from your existing data.
Can OxMaint's energy analytics produce reports for ESG disclosure and building performance standards?
Yes. OxMaint's ESG Reporting module generates energy consumption reports aligned with GRI 302, TCFD physical risk disclosure, ENERGY STAR Portfolio Manager, NABERS, and UK SECR requirements. Reports include energy intensity by building type, Scope 1 and Scope 2 emissions calculations using configurable emission factors, year-over-year consumption trend analysis, and asset-level breakdown of HVAC energy by system type. For portfolios subject to building performance standards — such as New York Local Law 97 or the EU Energy Performance of Buildings Directive — OxMaint tracks performance against the relevant compliance thresholds and projects penalty risk based on current consumption trends.
Explore OxMaint's ESG reporting with a free trial.
OxMaint · HVAC Energy Optimization AI
Stop Paying for HVAC Energy Waste You Cannot See. Start Measuring It Asset by Asset.
OxMaint's AI energy analytics detect waste patterns, link them to maintenance causes, and generate work orders that recover efficiency — turning your utility bill into a maintenance improvement programme.