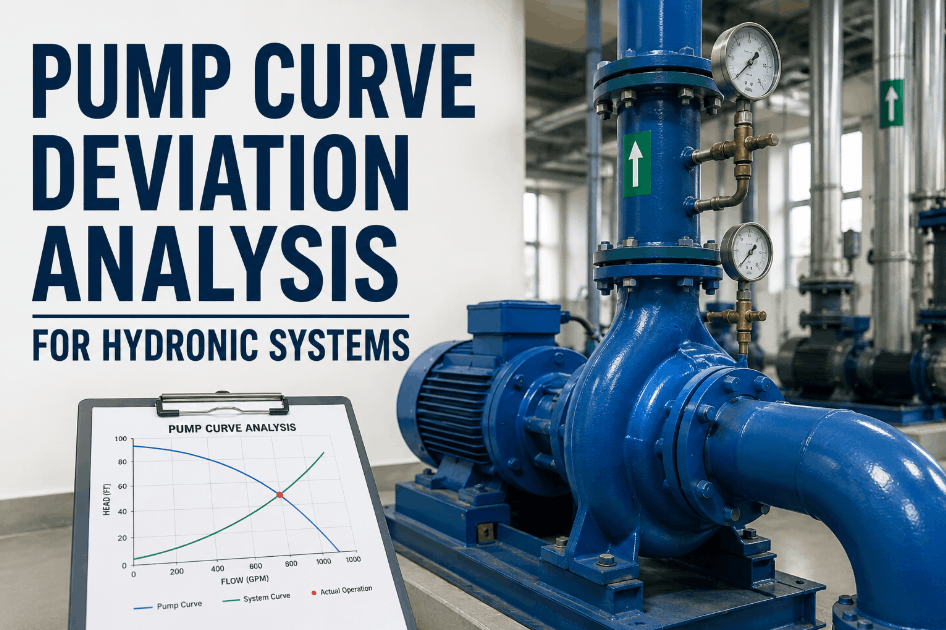
Pump curve deviation analysis for hydronic systems is one of the most reliable methods for detecting cavitation, impeller wear, valve loss, and flow pressure degradation before those conditions cause chilled water or condenser water system failures. When a pump operates away from its published performance curve — delivering less flow at a given head, consuming more power than expected, or running with unusual vibration — the deviation is a measurable signal of a developing problem. Maintenance and mechanical systems teams using Sign Up Free on OxMaint can log hydronic pump performance readings, track operating point drift against design curve references, and schedule condition-based maintenance work orders against individual pump asset records. Without structured pump performance history, operating curve deviations remain invisible between inspections, and Book a Demo to see how OxMaint connects hydronic pump condition data to reliability maintenance workflows in a single asset management platform.
Why Pump Curve Deviation Goes Undetected in Hydronic System Maintenance
Most hydronic system maintenance programs track pump failures as events — they respond when flow drops, pressure alarms fire, or a pump trips offline. Without structured operating point data logged against design curve references for each pump asset, gradual performance deviation remains invisible in routine inspection logs and work order notes. Book a Demo to see how OxMaint structures hydronic pump performance data by asset to surface curve deviation patterns that calendar-based PM programs miss.
Six Operating Parameters That Reveal Pump Curve Deviation in Hydronic Systems
Effective pump curve deviation analysis combines multiple operating measurements from the same asset history into a performance trend — not a single spot check against nameplate data. Teams using Sign Up Free on OxMaint can capture all six inputs in structured inspection records tied to individual hydronic pump assets, building the condition history that supports reliable deviation detection and root cause analysis.
Differential Pressure and Flow Rate Operating Point Tracking
Logging actual differential pressure and flow rate at each inspection and plotting against the design curve reveals whether the pump is operating on, above, or below its intended performance envelope. OxMaint per-asset records track this operating point shift over time.
Motor Power Draw and Efficiency Trend Analysis
Increased motor power draw at the same flow rate indicates rising system resistance or impeller wear. Decreased power at reduced flow may signal cavitation or internal recirculation. OxMaint power reading logs tied to flow data distinguish between these failure modes.
Vibration Amplitude and Frequency Signature Monitoring
Cavitation, impeller damage, and bearing wear each produce characteristic vibration signatures before system performance degrades visibly. Logging vibration readings by frequency band in OxMaint against per-pump baselines enables early identification of the specific failure mode driving curve deviation.
Suction and Discharge Pressure Balance Verification
Net positive suction head (NPSH) margin erosion — from suction line restrictions, strainer fouling, or system pressure changes — drives cavitation that shifts the operating curve downward. OxMaint inspection records for suction and discharge pressure provide the upstream data that explains why a pump is deviating from its curve.
System Resistance Change Detection and Valve Loss Identification
Control valve fouling, partially closed isolation valves, or strainer plugging add system resistance that forces the operating point left on the curve. Correlating differential pressure readings with flow data in OxMaint identifies whether curve deviation is caused by pump wear or system resistance changes.
Temperature Rise Across Pump and Seal Housing Observation
Elevated pump casing temperature indicates internal recirculation or seal friction from operating too far off the best efficiency point. OxMaint temperature readings alongside vibration and pressure data allow maintenance teams to distinguish off-curve operation from mechanical seal or bearing degradation.
Pump Curve Deviation Reference by Hydronic System Type and Failure Mode
Different hydronic system applications and pump types present distinct curve deviation patterns and monitoring priorities. Book a Demo to explore how OxMaint structures pump performance records and condition-based maintenance scheduling by hydronic system type in a single CMMS platform.
| System Type / Application | Primary Deviation Signal | Monitoring Frequency | Failure Risk if Undetected | OxMaint Lever |
|---|---|---|---|---|
| Chilled Water Primary Pumps | Flow drop, differential pressure rise | Monthly performance reading | High — cooling capacity shortfall in peak season | Operating point log + deviation alerts |
| Condenser Water Pumps | Reduced flow, elevated chiller leaving temperature | Monthly inspection | High — chiller efficiency loss and potential trip | Flow and pressure trend tracking in OxMaint |
| Hot Water Heating Pumps | Pressure imbalance, terminal unit underheating | Seasonal inspection | Medium — comfort and energy inefficiency | Differential pressure logs with baseline comparison |
| Secondary Variable Flow Pumps | VFD speed vs. flow mismatch, differential pressure sensor drift | Quarterly controls check | High — system balance loss without visible alarm | Power draw records + work order history in OxMaint |
| Cooling Tower Makeup and Condenser Recirculation | Strainer fouling, flow reduction, vibration increase | Monthly visual and vibration check | Medium — tower performance and water quality risk | Vibration trend + strainer service log correlation |
How Unstructured Pump Monitoring Compounds Hydronic System Reliability Risk
Hydronic systems that rely on fixed PM intervals without structured pump performance data collection miss the gradual operating point drift that precedes capacity loss and failure. Each inspection cycle without a curve comparison extends the detection window and increases the probability that the first visible symptom is a comfort complaint, chiller alarm, or emergency pump repair. Sign Up Free to begin logging hydronic pump performance readings in OxMaint and build the condition history your curve deviation analysis program requires.
Building a Pump Curve Deviation Analysis Program with OxMaint
Register All Hydronic Pumps with Design Curve and Operating Parameters
Create asset records in OxMaint for each hydronic pump, including design flow rate, design head, motor power, and best efficiency point data from the manufacturer's pump curve. This design reference is what each performance reading is compared against to detect deviation.
Configure Structured Inspection Checklists for Performance Parameters
Build OxMaint inspection checklists that capture differential pressure, flow rate, motor power draw, vibration readings, and suction/discharge pressure at each pump inspection visit — ensuring every field reading contributes to the asset's performance trend data.
Establish Performance Baselines and Curve Deviation Alert Thresholds
Use initial commissioning data or early inspection readings in OxMaint to establish per-pump performance baselines. Set alert thresholds that trigger a maintenance review when flow, pressure, or power readings deviate from the design curve operating window by a defined margin.
Link Deviation Alerts to Maintenance Work Order Creation
Configure OxMaint to generate a work order automatically when a pump performance alert fires — routing the deviation finding to the mechanical maintenance team with the asset history attached for technician review before the site visit.
Analyze Fleet-Wide Curve Deviation Patterns for Program Refinement
Use OxMaint reporting to compare performance deviation patterns across the hydronic pump fleet. Fleet-level analysis identifies which deviation signals are the most reliable predictors of failure for your specific system types and refines alert thresholds over successive operating seasons.
Frequently Asked Questions: Pump Curve Deviation Analysis for Hydronic Systems
What is pump curve deviation analysis in hydronic systems?
It is the practice of comparing actual pump operating measurements — flow, head, power, and vibration — against the design performance curve to identify degradation from cavitation, wear, valve loss, or system resistance changes before those conditions cause flow or pressure failures in the hydronic system.
What causes a hydronic pump to deviate from its design curve?
Common causes include impeller wear from cavitation or abrasion, mechanical seal or bearing degradation, suction line restrictions reducing NPSH margin, strainer or valve fouling adding system resistance, and VFD or controls drift in variable flow systems.
How does OxMaint support pump curve deviation monitoring programs?
OxMaint provides structured performance inspection checklists, per-asset condition history, configurable deviation alert thresholds, and automatic work order creation — giving mechanical maintenance teams the CMMS infrastructure to operate a condition-based hydronic pump monitoring program.
How often should hydronic pumps be checked for curve deviation?
Chilled water and condenser water pumps in year-round or seasonal operation benefit from monthly performance readings. Heating hot water pumps and lower-criticality secondary pumps can be checked quarterly. OxMaint PM scheduling ties inspection frequency to system criticality and condition history.
How do you distinguish pump wear from system resistance as the cause of curve deviation?
Pump wear typically shifts the operating point left on the curve with reduced flow at similar head. System resistance increases shift the point up and left with higher head at lower flow. Correlating suction pressure, strainer condition, and valve status in OxMaint alongside pump performance data allows the root cause to be identified before repair work begins.