Rooftop Unit (RTU) Maintenance Management: AI-Driven Solutions for Commercial Buildings
By John Mark on February 25, 2026
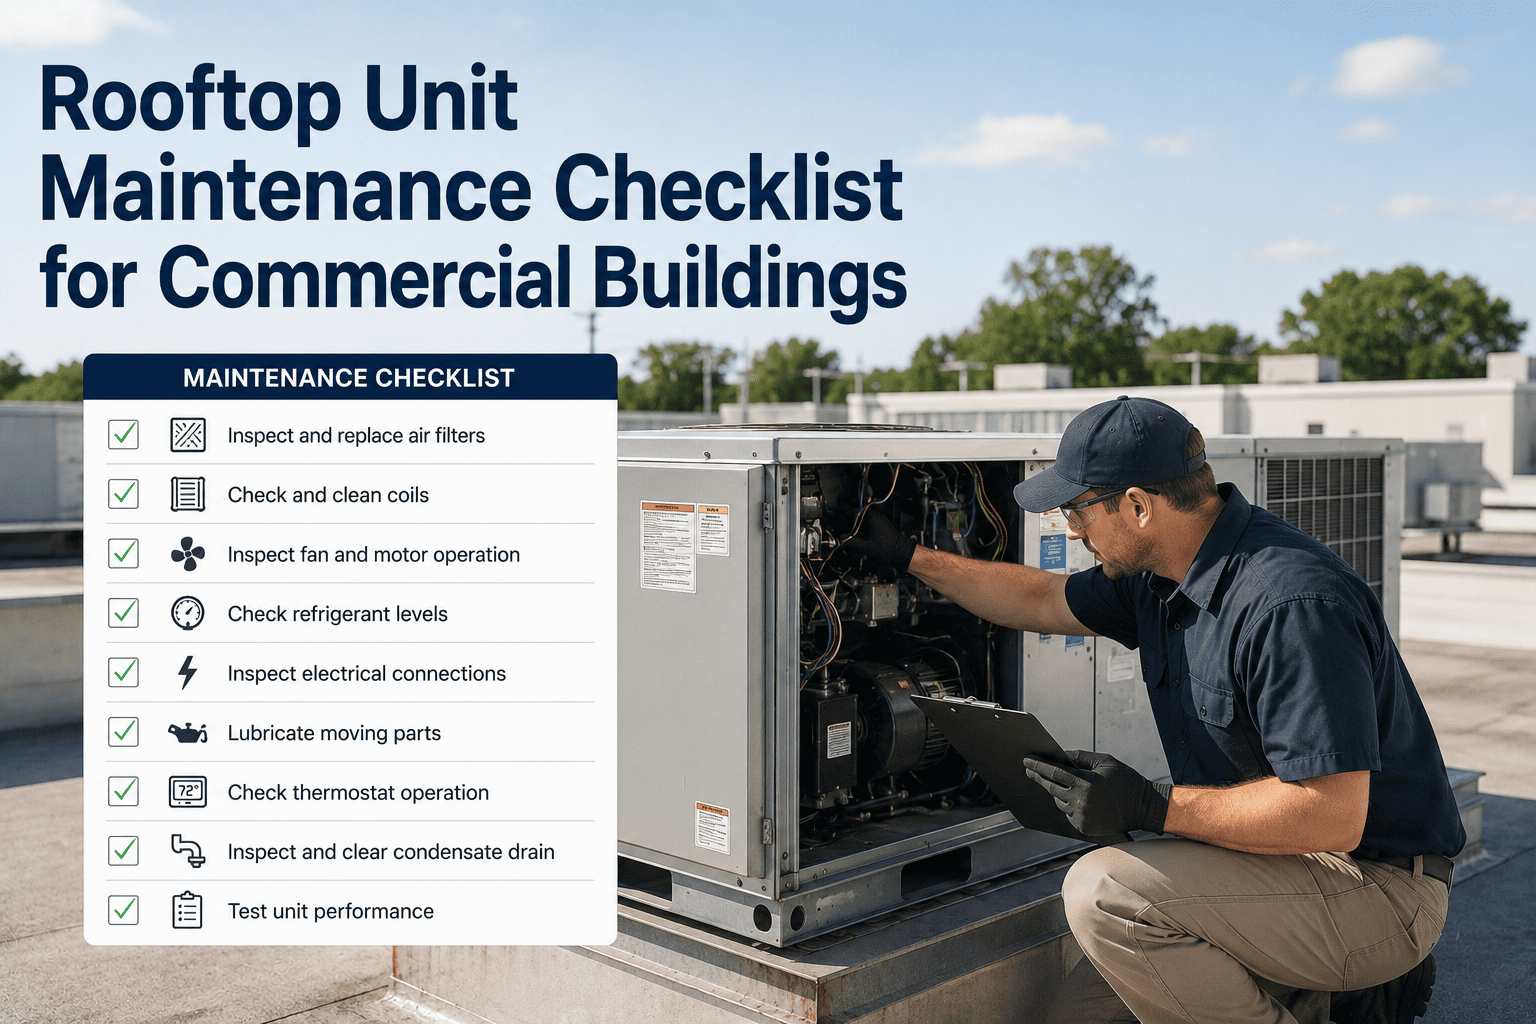
Rooftop units are the workhorses of commercial HVAC — and the most neglected. They sit on roofs in baking sun, freezing rain, hail, and wind, operating 2,500–4,500 hours per year with less maintenance attention than any other mechanical system in the building. A typical 200,000 square foot commercial building runs 15–40 RTUs ranging from 5 to 75 tons, collectively responsible for 40–60% of the building's total energy consumption and 100% of its occupant comfort. Yet the average RTU receives two maintenance visits per year — a spring startup and a fall changeover — with perhaps a filter change somewhere in between. The rest of the year, these $15,000–$150,000 machines operate unsupervised on the roof, slowly degrading: belts stretching and glazing, bearings wearing, coils fouling, refrigerant leaking, economizer dampers seizing, contactors pitting, capacitors aging, and controls drifting. By the time something fails hard enough to trigger a complaint from the space below, the unit has been operating inefficiently for weeks or months — burning excess energy, shortening its remaining life, and setting up the cascade of secondary failures that turns a $200 belt replacement into a $6,000 compressor burnout. AI-driven RTU maintenance management changes this equation by monitoring every unit continuously through BMS data and IoT sensors, detecting the early signatures of each degradation pattern, diagnosing the specific component failing, and generating targeted work orders that send technicians to the right unit with the right parts at the right time — before the failure occurs, before the energy waste accumulates, and before the tenant calls to complain.
The Rooftop Problem by the Numbers
15–40
RTUs on a typical 200K sq ft commercial building
40–60%
of total building energy consumed by RTUs
2×/year
average maintenance visits — the rest of the year, unmonitored
15–20 yrs
design life — but 30–40% fail to reach it under typical maintenance
$8K–$25K
average cost of a compressor replacement — the #1 RTU capital repair
The RTU Failure Cascade: How $200 Problems Become $15,000 Emergencies
RTU failures rarely happen in isolation. One degraded component creates operating conditions that accelerate wear on connected components, producing cascading failures that multiply cost by 5–20× versus catching the original problem early. Understanding these cascades is why AI-driven monitoring delivers such outsized ROI — it catches the $200 problem before it becomes the $15,000 emergency. Plants that track their RTU fleet on a centralized AI-integrated CMMS break these cascades at the first link.
Trigger
Dirty condenser coil
Fix cost: $150–$400
Head pressure rises 15–30% → compressor works harder → current draw increases 10–20%
After 4–12 months: compressor winding burnout from sustained overheating — contaminates entire refrigerant circuit
Cascade result
Compressor + system flush + filter driers + recharge: $12,000–$25,000
15–80× the cost of finding and fixing the leak early
What AI Monitors on Every RTU — and What It Catches
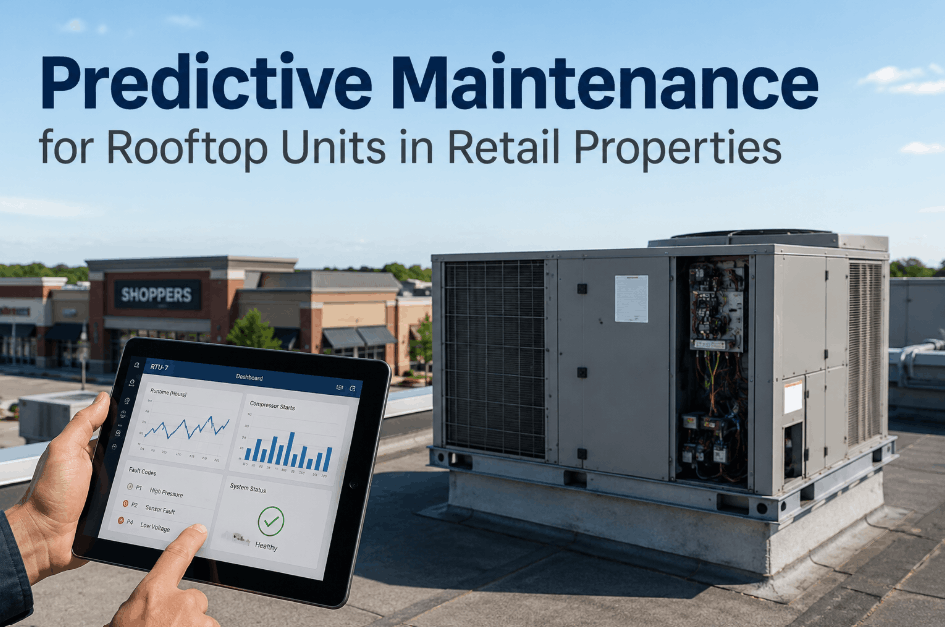
AI-driven RTU monitoring uses a combination of BMS data points (where available) and low-cost IoT sensors (where BMS coverage is limited) to build a continuous performance profile for each unit. The monitoring doesn't require exotic instrumentation — it requires consistent data from a handful of critical parameters, analyzed intelligently.
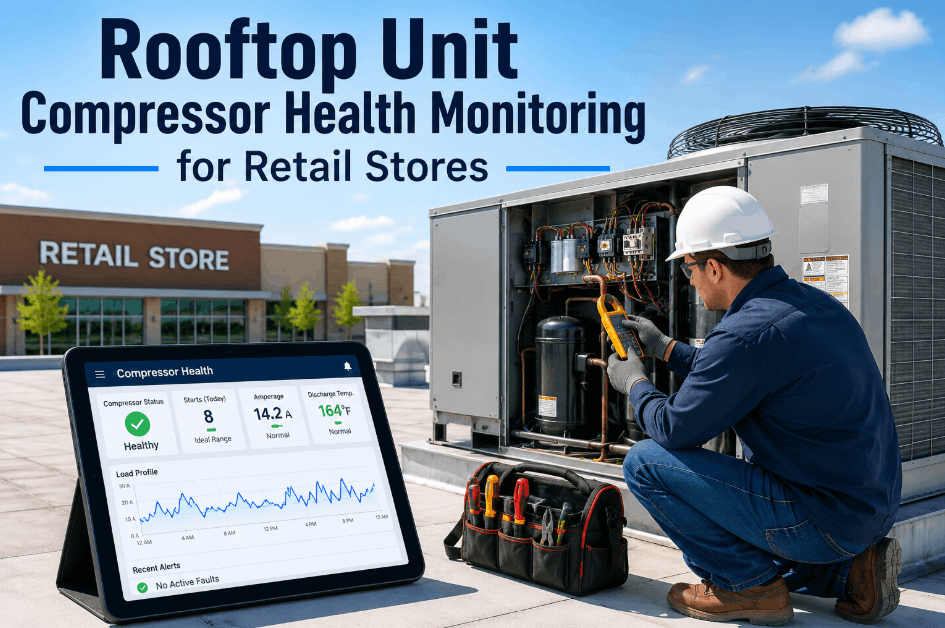
Compressor Current Draw
CT clamp — $30–$80 per circuit
Trending upward: Bearing wear, winding degradation, high head pressure from dirty condenser, refrigerant overcharge
Trending downward: Refrigerant undercharge (less mass to compress), unloader stuck open, lost compressor valve
Irregular pattern: Short cycling from high/low pressure cutout, contactor chatter, thermostat dead band issues
Supply & Return Air Temperatures
Duct sensors — typically already in BMS
Delta-T shrinking: Reduced cooling/heating capacity from low charge, dirty coil, failed compressor stage, or reduced airflow
Supply temp unstable: Compressor short cycling, staging issues, economizer hunting, or intermittent sensor fault
Supply temp not reaching setpoint: Undersized for load (design issue), multiple component degradation, or excessive outdoor air intake
Discharge & Suction Pressure
Wireless transducers — $150–$300 per circuit
High discharge: Dirty condenser, condenser fan failure, refrigerant overcharge, non-condensables in system
Current rising at constant speed: Dirty filter or coil increasing static pressure, bearing drag increasing from wear
Economizer Position vs. Outdoor Air Temperature
Damper position + OAT — typically in BMS
Damper not responding to OAT: Failed actuator, broken linkage, disabled sequence — losing thousands in free cooling annually
Damper stuck partially open: Excess outdoor air load when hot/humid, excess heating load when cold — energy waste year-round
OAT sensor reading implausible: Failed or sun-exposed sensor causing incorrect economizer decisions on every operating hour
30 RTUs on the Roof. 8,760 Hours a Year. 2 Maintenance Visits. That Math Doesn't Work.
OxMaint combines AI-powered continuous monitoring with RTU fleet management — detecting degradation on every unit in real time, generating targeted work orders with diagnosis and parts lists, and tracking every intervention from detection to verified resolution.
Seasonal Failure Patterns: When RTUs Break and Why
RTU failures are not random — they cluster around seasonal transitions and peak-demand periods in predictable patterns. AI monitoring uses these patterns to pre-position maintenance resources and catch seasonal degradation before the peak demand arrives.
Compressors that sat idle all winter fail on first cooling call — oil migration, liquid slugging on startup, and contactor welding from the initial inrush current
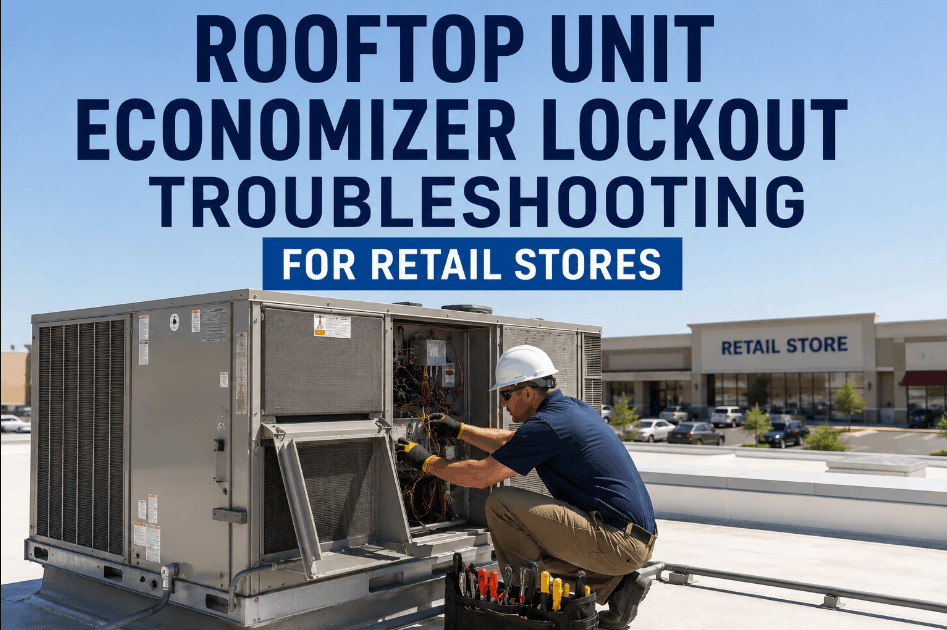
Economizer dampers that seized during winter from ice, corrosion, or debris are discovered only when free cooling mode should activate — and doesn't
Refrigerant leaks that developed over winter are revealed when the system starts and suction pressure is unexpectedly low
AI catches before startup: Compressor current anomaly on first test cycle, economizer position not responding to test command, suction pressure below baseline on first cooling cycle — all detectable within the first 24 hours of seasonal operation
Dirty condensers that performed adequately at 80°F ambient fail at 95°F+ — head pressure exceeds cutout, compressor short cycles, space temperature rises
Condenser fan motor failures from heat stress — capacitor degradation accelerates exponentially above 130°F (roof surface temperature near the motor)
Low refrigerant that maintained marginal performance in mild weather can't meet design cooling at peak — 10% undercharge = 20–30% capacity loss at peak ambient
AI catches before peak: Head pressure trending upward at constant ambient (condenser fouling), condenser fan current signature changing (capacitor aging), superheat/subcooling drift indicating charge loss — all detectable 4–8 weeks before peak failure
Fall Changeover (September–November)
Peak failure risk: Heating system startup failures, gas valve issues
Gas furnace sections that sat idle all summer fail on first heating call — gas valve stuck, igniter cracked, flame sensor contaminated, inducer motor seized
Heat pump reversing valves that haven't cycled in months stick in cooling position — discovered when the space won't heat on the first cold morning
Economizer changeover from free cooling to mechanical cooling misbehaves — mixed air temperature drops below freezing, coil freeze risk
AI catches before cold weather: Gas valve response time on test fire, igniter resistance measurement trending toward failure, inducer motor current anomaly — detectable during early fall test cycles before heating is critically needed
Peak Heating (December–February)
Peak failure risk: Freeze events, gas system failures under sustained demand
Freeze stat trips from economizer faults — stuck-open outdoor air damper admits sub-freezing air across the coil, ice forms, water damage follows when it thaws
Heat exchanger cracks under thermal cycling stress — CO risk in occupied space, discovered only if CO monitoring is functional
Defrost control failures on heat pumps — outdoor coil ices over completely, capacity drops to zero, auxiliary heat can't compensate
AI catches before freeze events: Mixed air temperature dropping toward freezing (economizer malfunction), heat exchanger delta-T anomaly (crack developing), defrost cycle frequency increasing abnormally (control or sensor issue) — all detectable days to weeks before the critical failure
RTU Fleet Management: From Individual Units to Portfolio Optimization
Managing 15–40 RTUs on a single building — or hundreds across a multi-site portfolio — requires fleet-level thinking, not unit-by-unit reaction. AI-driven fleet management reveals patterns invisible at the individual unit level and enables maintenance resource allocation that maximizes ROI across the entire fleet.
Performance Benchmarking
AI compares similar units (same model, same age, similar loads) across the fleet. An RTU consuming 18% more energy than its peers with similar operating profiles has a maintenance-correctable issue — even if it's "running normally" by its own historical standard. Fleet-wide benchmarking identifies the underperformers hiding behind acceptable absolute performance.
Common-Cause Failure Detection
When multiple RTUs of the same model show the same degradation signature simultaneously, the root cause is likely systemic — a batch manufacturing defect, a firmware bug, or a site-specific environmental factor — not random individual failures. AI detects these fleet-wide patterns that no individual unit inspection would reveal, enabling proactive fleet-wide intervention before the failures cascade.
Replacement Planning & Capital Forecasting
AI's remaining useful life estimates for each unit feed directly into capital planning. Instead of replacing all 25-year-old RTUs simultaneously (a $500K–$2M capital event), the system identifies which units are actually approaching end-of-life based on condition data — some 15-year units need replacement sooner than some 22-year units. Data-driven replacement sequencing spreads capital over 3–5 years while eliminating the units most likely to fail first.
Maintenance Route Optimization
For multi-building portfolios, AI batches maintenance work orders by building and urgency — creating optimized technician routes that address the highest-priority faults first while minimizing travel time. A technician dispatched to Building A for a compressor issue also addresses the belt replacement and economizer repair flagged on two other RTUs at the same building — one trip, three fixes instead of three separate dispatches.
ROI: AI-Driven RTU Maintenance Management
Annual ROI — 30-Unit RTU Fleet (200,000 sq ft commercial building)
$48K
Prevented Cascade Failures
3–5 compressor failures prevented annually by catching upstream triggers (dirty coils, low charge, worn belts) at $8K–$20K avoided per event
$32K
Energy Waste Elimination
12–20% RTU energy reduction from resolved economizer faults, corrected refrigerant charge, clean coils, and eliminated scheduling waste
$22K
Extended Equipment Life
3–5 year RTU life extension through optimized operating conditions — deferring $300K–$600K in fleet replacement capital over 10 years
$15K
Reduced Emergency Service Calls
55–70% fewer emergency dispatches — each avoided after-hours call saves $400–$1,200 in emergency labor premium and expedited parts
$8K
Maintenance Labor Efficiency
Targeted dispatches with pre-diagnosis reduce troubleshooting time 40–60% — first-visit fix rate increases from 50% to 85%+
Expert Perspective: Transforming RTU Maintenance with AI
"
I manage HVAC maintenance for a 42-building, 6.2 million square foot retail portfolio — 380 RTUs across three states. Before AI monitoring, our RTU maintenance was entirely reactive with a thin veneer of preventive. We had contracts for spring and fall PM visits, but the reality was that 70% of our maintenance spend was emergency calls: tenant too hot, tenant too cold, unit not working. We were spending $1.4 million annually on RTU maintenance and replacement, and the buildings were still uncomfortable. We piloted AI monitoring on 60 RTUs across 8 buildings. Within 90 days, the system identified $218,000 in annual energy waste across those 60 units — 14 stuck economizers, 8 units running overnight on overridden schedules, 6 units with low refrigerant, and 22 dirty condenser coils. It also flagged 4 compressors showing early bearing degradation signatures that our PM technicians hadn't caught. We resolved the top-priority faults over 6 weeks using our existing maintenance contracts — no additional staff. The energy savings were immediate and measurable. The avoided compressor failures saved an estimated $56,000 in emergency repairs. After the pilot, we rolled AI monitoring to the full fleet. Year-one results across 380 units: emergency calls down 61%, total RTU maintenance spend down 28%, energy cost down 17%, and tenant comfort complaints down 54%. The biggest cultural shift was moving from "fix it when it breaks" to "fix it when the data says to." Our technicians initially resisted — they didn't trust a computer to tell them what was wrong with their equipment. But after the third time the system correctly diagnosed a fault they couldn't find during a PM visit, they became the system's biggest advocates. Now they won't go to a unit without checking the AI dashboard first.
Pilot on 8–10 buildings first — prove ROI with data before full portfolio rollout
Fix the cascade triggers first — dirty coils, low charge, and worn belts are cheap fixes that prevent expensive compressor failures
Win the technicians over with accuracy — once they see the AI diagnose faults they missed, they become advocates
Track everything — emergency calls, energy cost, tenant complaints, maintenance spend — to prove ROI and justify expansion
Rooftop units deserve better than two PM visits and a prayer. AI-driven maintenance management monitors every unit continuously, catches the $200 problems before they cascade into $15,000 emergencies, eliminates the energy waste hiding in economizer faults and dirty coils, and gives maintenance teams the diagnostic precision to fix the right thing on the first visit. If you're ready to stop reacting to RTU failures and start preventing them, book a free demo to see how AI-powered RTU fleet management works on OxMaint.
Every Unit Monitored. Every Fault Diagnosed. Every Cascade Broken. Every Dollar Justified.
OxMaint delivers AI-powered RTU fleet management — continuous monitoring with automated fault detection, diagnostic work orders with root cause and parts lists, seasonal pre-failure alerts, fleet benchmarking, and capital replacement planning. One platform for every unit on every roof.
What sensors are needed to monitor an RTU that isn't connected to a BMS?
Many RTUs — particularly in retail, light commercial, and older buildings — operate on standalone thermostats with no BMS connection. These units can be brought into AI monitoring through a low-cost IoT sensor kit that typically includes: one or two current transducers (CT clamps) on the compressor and supply fan power feeds ($30–$80 each, non-invasive clamp-on installation requiring no electrical modification), a supply air temperature sensor ($20–$40, strap-on or insertion type in the supply duct), a return air temperature sensor (same), and optionally, refrigerant pressure transducers on the suction and discharge service ports ($150–$300 per circuit, providing the most diagnostic-rich data but requiring a licensed technician for installation). The sensors connect to a wireless gateway (cellular, WiFi, or LoRaWAN) mounted inside or near the RTU cabinet, transmitting data to the cloud platform at 1–5 minute intervals. Total hardware cost per RTU: $200–$800 depending on sensor selection. Installation: 30–90 minutes per unit by an HVAC technician or electrician. This basic sensor set provides sufficient data for 80% of the fault detection and diagnostic value: compressor health monitoring, capacity trending, airflow verification, efficiency benchmarking, and scheduling fault detection. Adding economizer position feedback and outdoor air temperature (if not available from another source) captures the remaining 20% of detection capability. For RTUs already connected to a BMS, most of these data points are already available — the integration effort shifts from sensor installation to BMS data extraction, which is typically faster and cheaper.
How does AI differentiate between a dirty condenser and low refrigerant charge — both cause high head pressure?
This is one of the most valuable diagnostic capabilities of AI-based monitoring and a common source of misdiagnosis by technicians relying on pressure readings alone. Both dirty condenser coils and refrigerant overcharge produce elevated discharge pressure, but they produce different signatures across the full set of monitored parameters. A dirty condenser shows: high discharge pressure, normal or slightly high suction pressure, normal superheat, normal or slightly reduced subcooling, elevated condenser split (difference between discharge pressure saturation temperature and ambient), and normal compressor current relative to the elevated head pressure. The approach temperature between the refrigerant saturation temperature and the outdoor air temperature widens progressively as fouling increases. Low refrigerant charge shows: high discharge temperature but often normal or only slightly elevated discharge pressure (less refrigerant mass), low suction pressure, high superheat (the key differentiator), low subcooling, and reduced capacity (larger supply-return delta-T gap from setpoint). The compressor current is often lower than expected because it's compressing less mass. The AI model uses the combination of these parameters — particularly the superheat and subcooling relationship with the pressure and ambient conditions — to distinguish between the two faults with high confidence. When the system reports "dirty condenser" versus "low refrigerant charge," the technician arrives with the right tools and expectations: a pressure washer and coil cleaner for the condenser, or a leak detector and refrigerant for the charge issue. This diagnostic precision is what drives the first-visit fix rate from 50% to 85%+.
What is the typical payback period for AI RTU monitoring on a 30-unit building?
For a typical 30-unit RTU fleet on a 200,000 sq ft commercial building, the investment and payback work out as follows. First-year costs: sensor hardware at $300–$600 per unit ($9,000–$18,000 total for the fleet), installation labor at $50–$100 per unit ($1,500–$3,000), gateway hardware at $200–$500 per building ($200–$500), and platform subscription at $8–$15 per unit per month ($2,880–$5,400 annually). Total first-year investment: $13,580–$26,900. First-year savings typically come from three sources in roughly this proportion: energy waste elimination (economizer faults, scheduling errors, coil fouling, charge issues) saves $15,000–$35,000 on a 30-unit fleet; avoided emergency repairs (2–4 prevented cascade failures at $5,000–$15,000 each) saves $10,000–$60,000; and maintenance labor efficiency (fewer dispatches, faster diagnosis, higher first-visit fix rate) saves $5,000–$12,000. Conservative first-year total savings: $30,000–$107,000. That puts the payback period at 2–6 months for most implementations, with the wide range reflecting the current condition of the RTU fleet — buildings with significant deferred maintenance see the fastest payback because there are more faults to find and fix. Year-two economics improve further because the sensor hardware is already installed (only the platform subscription continues), and the fleet operates at higher baseline efficiency because the major faults were resolved in year one.
Can AI monitoring work with older RTUs that have single-stage compressors and no VFDs?
Absolutely — and in many ways, older single-stage RTUs benefit more from AI monitoring than modern variable-capacity units. Older units are simpler, which means their failure signatures are more distinct and easier for AI to classify. A single-stage scroll compressor is either on or off, drawing a characteristic current when running — any deviation from that characteristic current is immediately significant. There's no variable-speed modulation to complicate the analysis. The monitoring approach for older RTUs emphasizes: compressor run-time analysis (excessive run time at constant capacity indicates undersizing for current load, dirty coils, or low charge — the unit is running at 100% and still can't meet the load), cycle frequency and duration (short cycling indicates high-pressure cutout, low-pressure cutout, thermostat dead band issues, or oversizing), on/off current signature (startup inrush pattern changes indicate capacitor degradation, contactor wear, or mechanical binding), and run-time-to-cooling-delivered ratio (correlating run hours with actual temperature change achieved — declining ratio indicates capacity degradation from any cause). The diagnostic resolution is somewhat lower than on modern units with VFDs and integrated monitoring — the AI has fewer data dimensions to work with — but the fundamental value proposition is the same: catching problems before they cascade, eliminating energy waste, and sending technicians with the right diagnosis. In fact, older RTUs typically have more deferred maintenance and more active faults, so the initial ROI from monitoring is often higher than on a newer fleet.
How does the AI handle RTUs that serve different zone types — retail, restaurant, office — with different load profiles?
This is a core strength of AI-based monitoring versus rule-based systems. Rule-based FDD applies the same thresholds to every unit regardless of its operating context — which produces false positives on units serving high-load zones (restaurant kitchens, server rooms) and misses faults on units serving low-load zones (storage areas, corridors). AI models are trained per unit, learning each RTU's specific normal operating pattern in its actual application. An RTU serving a restaurant kitchen that runs its compressor 85% of the time during operating hours is "normal" for that application — the AI baseline reflects this. An identical RTU serving a corridor office that suddenly starts running 85% compressor time is flagged as anomalous because that unit's baseline is 40% run time. The per-unit learning approach also adapts to: building orientation (south-facing zones have different load profiles than north-facing), occupancy patterns (retail units peak on weekends, office units peak on weekdays), internal loads (server rooms have constant cooling load, conference rooms have intermittent peak loads), and schedule variations (some zones operate extended hours, some have nighttime setback). After the initial 4–8 week learning period, the AI model for each unit reflects its specific operating context — making fault detection accurate regardless of the zone type served.