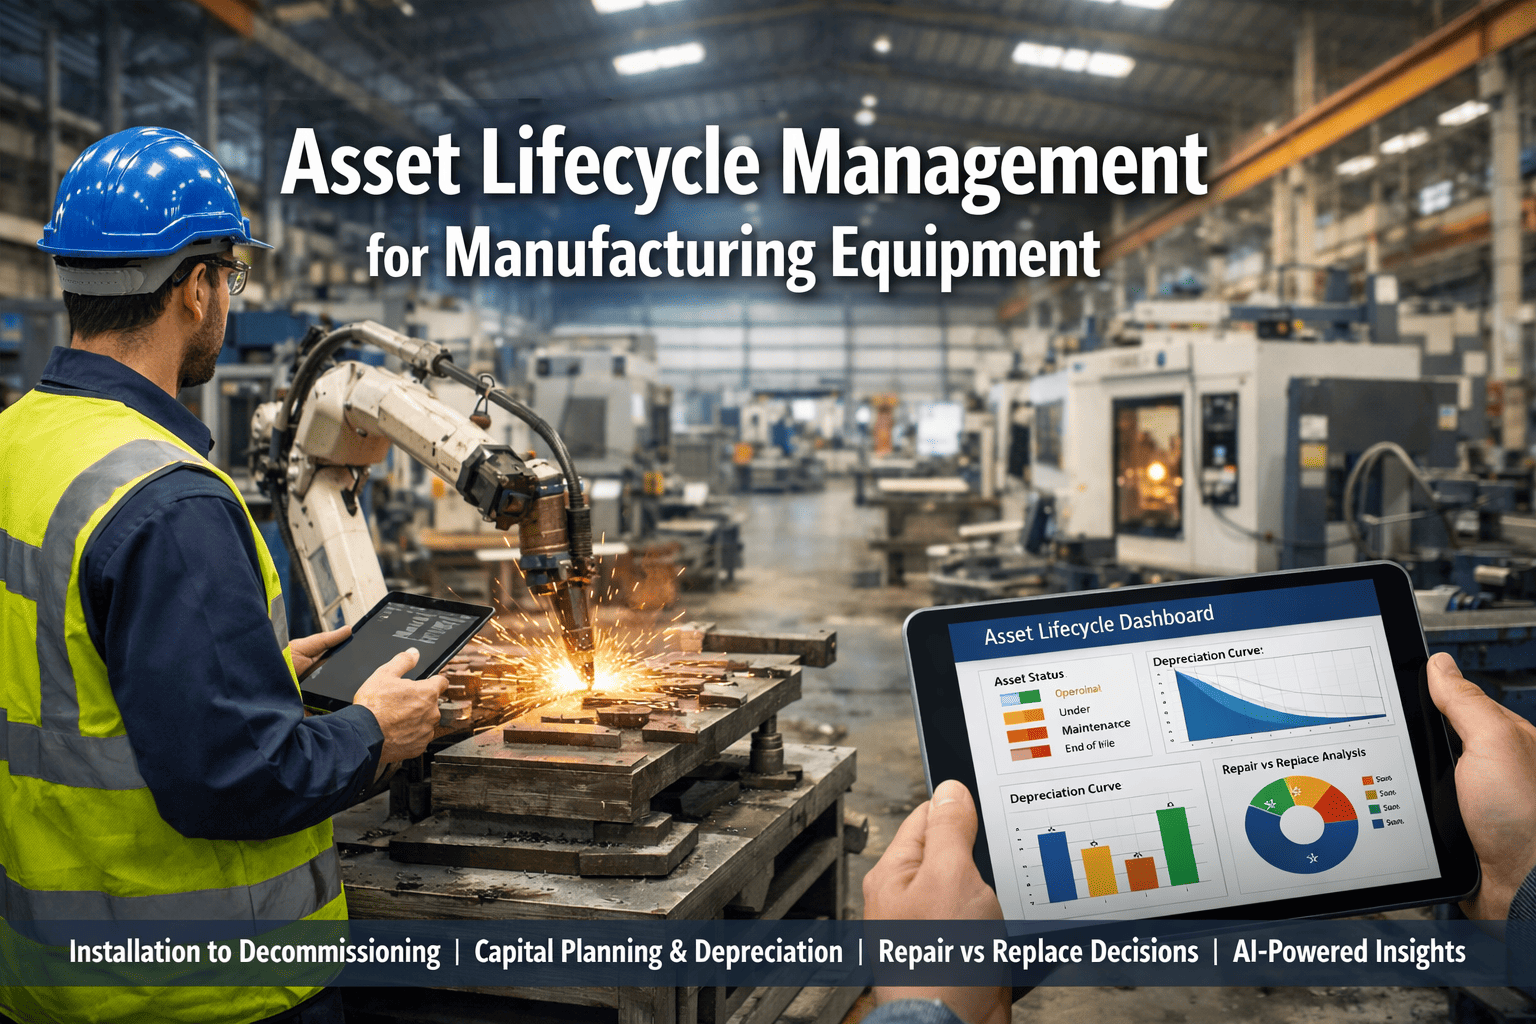
An aging asset isn't just an old one — it's one whose failure behavior, spare-parts risk, and cost curve have all quietly changed, while the maintenance plan around it usually hasn't. Most plants run critical equipment well past its design life, and treating a 30-year-old press like a new one is how aging assets end up owning the downtime log and the budget. This guide is a working aging-equipment strategy for reliability engineers: how to assess real condition, decide between maintain, rebuild, and replace, and get ahead of obsolescence and spare-parts risk before they force your hand. Start free on OxMaint to build your aging-asset register, or schedule a demo.
Condition · Decision · Obsolescence · Spares
Managing Aging Equipment in Manufacturing Plants
A different asset needs a different strategy. Keep aging equipment productive without letting it dominate the downtime log or the budget.
42%
Share of unplanned downtime commonly tied to aging assets
20–40%
How far past design life much critical plant equipment is actually run
3
Decisions on the table for every aging asset — maintain, rebuild, replace
Bathtub
The failure curve aging assets climb — wear-out risk that rises with every year
Why Aging Assets Break the Standard Playbook
New equipment fails randomly and rarely; aging equipment fails from wear-out, and the probability climbs every year — the right-hand wall of the classic bathtub curve. That single fact breaks the standard maintenance playbook. A fixed PM interval that was right at year five is dangerously long at year twenty-five. Spare parts that were a phone call away are now obsolete. And the failure that used to be a nuisance is now the one that idles the line for a week while a part is fabricated. Aging-asset management is the discipline of adjusting the strategy to match the curve the asset is actually on.
The Bathtub Curve · Where Your Asset Sits Decides the Strategy
Infant
Early Life
Break-in failures. Commissioning defects surface. Falling failure rate.
Useful Life
Mid Life
Low, random failures. Standard PM and condition monitoring fit perfectly here.
Wear-Out
Aging
Rising failure rate. The zone where aging strategy replaces the standard plan.
The mistake isn't running assets into wear-out — sometimes that's the right economic call. The mistake is running them there on a useful-life maintenance plan.
Step 1 · Condition Assessment — Know What You Actually Have
You can't strategize an aging fleet you haven't honestly assessed. Age in years is the weakest possible signal — a well-maintained 30-year-old machine can outlive a hard-run 10-year-old one. Real condition assessment scores the asset on evidence, not birthdays.
Condition Data
Vibration, thermography, oil analysis, and inspection findings — the physical evidence of wear the age number can't give you.
Failure History
Frequency, mode, and trend of past failures. An accelerating failure interval is the clearest sign an asset has entered wear-out.
Maintenance Cost Trend
Annual maintenance spend per asset, trended. A rising curve is the financial signature of aging — and the input the replace decision needs.
Criticality
Consequence of failure — production, safety, quality. A low-condition asset that's also single-point-of-failure is the top of the action list.
Step 2 · The Decision — Maintain, Rebuild, or Replace
Every aging asset sits at one of three decisions, and the reliability engineer's job is to make that call on evidence before a failure makes it for them. The deciding inputs are condition, criticality, the cost trend, and whether parts are even still available.
Decision A
Maintain & Monitor
Condition still sound, cost trend flat, parts available. Tighten PM intervals to match the rising wear risk and add condition monitoring so degradation shows early.
When: good condition, manageable cost, non-urgent
Decision B
Rebuild / Refurbish
Core structure sound but wear components spent. A rebuild resets the failure clock at a fraction of replacement cost — when the platform is still fit for purpose and parts exist.
When: sound core, high replacement cost, spares still available
Decision C
Replace
Cost trend rising sharply, obsolescence looming, or condition beyond economic repair. Plan it as capital before a failure forces an emergency buy at a premium.
When: rising cost, obsolete parts, or unsafe/unfit
Score Your Aging Fleet on Evidence — Free Forever
The maintain/rebuild/replace call is only as good as the data behind it. Load your assets into OxMaint and let condition data, failure history, and maintenance-cost trend build the evidence for each decision — instead of reacting to the next breakdown. No card, no time limit.
Step 3 · Obsolescence — The Risk That Ambushes You
The failure that hurts most on an aging asset often isn't mechanical — it's that the part, the controller, or the vendor no longer exists. Obsolescence turns a two-hour repair into a two-week fabrication or a forced replacement at the worst possible time. It has to be tracked as its own risk, ahead of the failure.
01
Component Obsolescence
A critical spare no longer manufactured. Flag it before the last one on the shelf gets used, not after.
02
Control & Electronics
Legacy PLCs, drives, and HMIs that outlive vendor support. Often the true trigger for replacement — the mechanicals are fine, the controls are unsupportable.
03
Vendor / Skills Loss
The OEM exits the market or the one technician who understood the machine retires. Knowledge obsolescence is as real as parts obsolescence.
04
Documentation Gaps
Drawings, manuals, and settings lost over decades. Capture them into the asset record now — while someone still has them.
Step 4 · Spare-Parts Hedging — Insurance Against the Clock
For an aging asset in wear-out with looming obsolescence, spares strategy shifts from "just-in-time" to "hedge the risk." The question changes from how little inventory can we hold to what does a stockout of this part actually cost us — and the answer is often a critical last-time-buy.
Critical Spares Identified
Which parts, if unavailable, idle a critical asset. This list is the whole basis of an aging-asset spares hedge.
Last-Time-Buy
When a part goes end-of-life, a final stocking buy sized to bridge the asset to its planned replacement — the classic obsolescence hedge.
Stockout Cost, Not Just Carrying Cost
Hold decisions weighed against downtime cost, not just the cost of shelving the part. For a critical aging asset the math usually favors holding.
How OxMaint Runs the Aging-Equipment Program
Condition scoring, the decision inputs, obsolescence flags, and the spares hedge all live on one platform — every aging asset carried with its condition trend, failure history, cost curve, and parts risk in one record, so the maintain/rebuild/replace call is made on evidence and the surprises stop being surprises.
Score
Condition & Criticality
Every asset carried with a condition score built from inspection, vibration, and oil data, weighted by criticality.
Trend
Failure & Cost History
Failure frequency and maintenance spend trended per asset — the accelerating curves that signal wear-out.
Decide
Maintain / Rebuild / Replace
The decision inputs in one view so the call is evidence-based capital planning, not a reaction to a breakdown.
Flag
Obsolescence Risk
Parts, controls, and documentation gaps tracked as risks against the asset — surfaced before they force a decision.
Hedge
Critical Spares
Critical and last-time-buy spares identified and tracked so a stockout never idles an aging critical asset.
Adapt
Wear-Out PM Intervals
PM cadence tightened per asset as it climbs the wear-out curve — the plan matched to the curve it's on.
Stop Letting Aging Assets Own the Downtime Log
Free forever plan — no card, no time limit. Build the aging-asset register, trend the cost and failure curves, and make maintain/rebuild/replace a planned decision instead of an emergency. Or book 30 minutes and we'll map your oldest critical assets onto the platform end to end.
Frequently Asked Questions
What makes an asset "aging" — is it just about age in years?
No. Age in years is the weakest signal. An asset is functionally aging when its failure rate is rising (wear-out), its maintenance cost is trending up, or its parts and controls are heading toward obsolescence. A well-maintained 30-year-old machine can be in better shape than a hard-run 10-year-old one, so the strategy is driven by condition and cost evidence, not the birthday.
How do I decide whether to maintain, rebuild, or replace an aging asset?
Weigh four inputs: current condition, criticality, the maintenance-cost trend, and parts availability. Sound condition with flat cost and available parts means maintain with tightened intervals. A sound core with spent wear components favors a rebuild that resets the failure clock cheaply. A sharply rising cost curve, looming obsolescence, or condition beyond economic repair points to a planned replacement — ideally as capital, before a failure forces an emergency buy.
Why is obsolescence such a big risk for aging equipment?
Because the worst failure on an old asset is often not mechanical — it's that the spare, the controller, or the vendor no longer exists. Obsolescence turns a two-hour repair into a two-week fabrication or a forced replacement at the worst possible moment. Legacy control electronics that outlive vendor support are frequently the real trigger for replacement even when the mechanicals are fine, so obsolescence has to be tracked as its own risk ahead of the failure.
Book a demo to see obsolescence flagging.
Should PM intervals change as equipment ages?
Yes. Aging assets are on the wear-out portion of the bathtub curve, where failure probability rises over time — so an interval that was right in the useful-life phase becomes too long. Tighten PM cadence and add condition monitoring as the asset ages so degradation is caught earlier. Running an asset into wear-out can be the right economic call; running it there on a useful-life maintenance plan is not.
How does a CMMS help manage an aging fleet specifically?
It turns scattered signals into the evidence the strategy needs: condition scores, failure-frequency and maintenance-cost trends per asset, obsolescence flags on parts and controls, and a critical-spares hedge — all in one asset record. That lets reliability engineers make maintain/rebuild/replace decisions as planned capital calls and keeps aging assets from quietly dominating the downtime log and the budget.
Start free to build the register.



![equipment-asset-register-template-for-manufacturing-plants-[free-excel]](./manage-post-2k26/uploads/equipment-asset-register-template-for-manufacturing-plants-[free-excel].png)