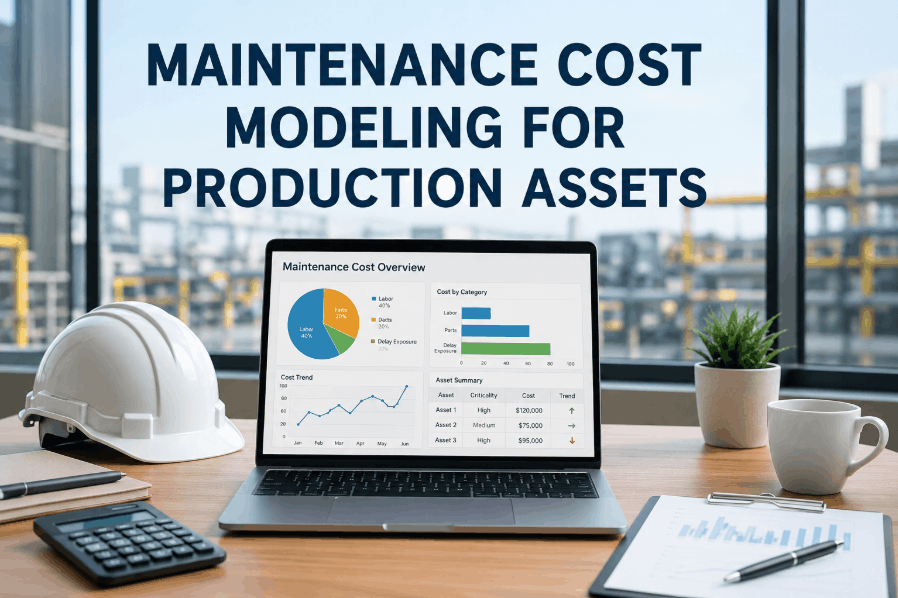
Maintenance cost modeling for production assets is the analytical discipline that converts raw work order data into financially grounded decisions about repair spend, risk exposure, and replacement timing. Most manufacturing organizations track maintenance costs at the department level — but few build the per-asset cost models that reveal which pieces of equipment are consuming disproportionate maintenance budgets, which are approaching lifecycle cost thresholds, and where delay exposure from unplanned downtime is creating hidden financial risk that labor and parts costs alone do not capture. Sign Up Free to see how OxMaint gives maintenance and operations leaders the cost modeling infrastructure they need to make asset-level financial decisions with confidence. Organizations that implement formal maintenance cost modeling typically identify 15–25% of their asset portfolio consuming over 60% of total maintenance spend — and use that data to drive targeted interventions that reduce cost without increasing risk.
Model Maintenance Costs Per Asset with OxMaint
Labor, parts, and delay exposure tracking. Lifecycle cost accumulation. Risk-ranked replacement analysis. Built for production asset management teams.
Why Maintenance Cost Models Fail Without Asset-Level Data
Department-level maintenance budgets obscure the asset-level cost variation that drives financial decisions. Without per-asset cost accumulation, every repair looks equally justified — and the assets that are destroying budget go undetected until a capital review forces the question. Book a Demo to see how OxMaint structures cost capture at the asset level across labor, parts, and production delay exposure.
Labor Costs Tracked by Department, Not Asset
When technician time is logged at the department level rather than per work order per asset, it is impossible to identify which equipment is consuming the most maintenance labor — hiding the true cost of ownership for each asset.
Parts Cost Not Linked to Asset Records
Spare parts issued from inventory are often charged to department cost centers rather than specific assets — preventing lifecycle cost accumulation and making total repair spend per asset impossible to calculate without manual reconstruction.
Delay Exposure Not Included in Cost Models
Traditional maintenance cost models exclude the production revenue impact of unplanned downtime — systematically undervaluing assets with high failure frequency and overstating the cost efficiency of reactive maintenance strategies.
No Risk Ranking Tied to Cost Data
Without connecting asset criticality to maintenance cost data, budget allocation decisions treat all assets equally — directing resources to low-risk assets while high-impact equipment remains underfunded.
Lifecycle Cost Not Compared to Replacement Value
When accumulated maintenance spend is not compared against asset replacement cost, organizations continue repairing equipment well past the point where replacement is economically justified — inflating both maintenance cost and downtime risk.
Wear Trend Data Not Feeding Cost Forecasts
Condition monitoring and wear trend data collected from assets is rarely connected to maintenance cost forecasting models — leaving budget planners unable to anticipate accelerating repair costs as assets approach end-of-life.
Maintenance Cost Modeling Framework — 6 Core Components
A complete maintenance cost model for production assets integrates six data streams — from direct labor and parts costs through delay exposure and lifecycle accumulation — into a unified financial view that supports both operational and capital planning decisions. Sign Up Free to implement this framework using OxMaint's CMMS cost tracking and analytics modules.
| Cost Model Component |
What It Captures |
OxMaint Feature |
Decision It Enables |
| Direct Labor Cost |
Technician hours × labor rate per work order per asset |
Work Order Time Tracking |
True labor cost per asset per year |
| Parts and Materials Cost |
Parts consumed per work order linked to asset records |
Inventory Integration + WO Costing |
Lifetime parts spend per asset |
| Contractor Cost |
Third-party service spend per asset per maintenance event |
Vendor and Contractor Management |
Total outsourced maintenance cost per asset |
| Delay Exposure Cost |
Downtime hours × production value per hour per asset |
Downtime Tracking + OEE Analytics |
True cost of asset failure including lost production |
| Lifecycle Cost Accumulation |
Total maintenance spend since commissioning vs. replacement value |
Asset Lifecycle Cost Module |
Repair vs. replace decision support |
| Risk-Ranked Cost Prioritization |
Maintenance cost weighted by asset criticality and failure impact |
Criticality Matrix + Cost Analytics |
Budget allocation aligned to risk exposure |
How OxMaint Builds Per-Asset Maintenance Cost Models
01
Work Order Cost Capture at the Asset Level
OxMaint links every work order to a specific asset record — capturing technician labor hours, parts consumed from inventory, and contractor spend against that asset's cost history. Over time, this builds the per-asset maintenance cost database that makes lifecycle cost modeling possible.
Book a Demo to see asset-level cost capture configured for your work order types.
02
Delay Exposure and Production Loss Integration
OxMaint tracks downtime duration per work order and links it to asset records — allowing reliability engineers to calculate delay exposure cost by multiplying downtime hours against production value per hour. This integration converts maintenance cost models from direct cost tracking to total financial impact models.
03
Lifecycle Cost Accumulation and Replacement Analysis
OxMaint accumulates all maintenance costs per asset since commissioning — enabling reliability engineers to compare lifetime repair spend against current replacement value. Assets where accumulated maintenance cost exceeds a defined threshold of replacement cost are automatically flagged for capital review.
Sign Up Free to activate lifecycle cost tracking for your production asset portfolio.
04
Risk-Ranked Budget Allocation Support
OxMaint combines asset criticality ratings with maintenance cost data to produce risk-ranked cost views — showing where high-cost maintenance spend is occurring on high-criticality assets versus where budget is being consumed by low-impact equipment. This supports maintenance budget allocation decisions that are grounded in both financial and operational risk.
Maintenance Cost Modeling Results Across Production Environments
The following examples show how production asset managers use OxMaint's cost modeling capabilities to reduce maintenance spend, improve budget allocation, and support capital replacement decisions.
Plastics Manufacturing
Identifying Hidden Lifecycle Cost Outliers
ChallengeMaintenance budget overrun with no asset-level visibility into where spend was concentrated
AppliedOxMaint per-asset cost accumulation across labor, parts, and downtime delay for all production lines
Result4 assets identified consuming 44% of total maintenance budget; 2 replaced, saving $380K annually
Steel Processing
Delay Exposure Cost Quantification
ChallengeReactive maintenance costs appeared acceptable in direct cost tracking but production losses were not captured
AppliedOxMaint downtime tracking linked to production value per hour; total cost model including delay exposure
ResultTrue maintenance cost revealed to be 2.8x direct cost — justified PM investment that reduced reactive ratio by 35%
Cement Production
Risk-Ranked Maintenance Budget Reallocation
ChallengePM budget distributed equally across all assets — critical kiln equipment underfunded relative to risk
AppliedOxMaint criticality matrix combined with asset-level cost data to produce risk-weighted budget allocation model
ResultKiln PM budget increased 28%; unplanned kiln stoppages dropped 52% in the following 12 months
Food Processing
Repair vs. Replace Decision Support
ChallengeCapital planning team could not justify asset replacement requests to finance without lifecycle cost data
AppliedOxMaint lifetime cost accumulation reports per asset; replacement cost comparison built into capital review process
ResultFinance approved 6 of 7 replacement requests based on lifecycle cost evidence — first time in 5 years
Step-by-Step: Building a Maintenance Cost Model in OxMaint
Step 1
Configure Asset-Level Cost Capture in Work Orders
Ensure every work order in OxMaint is linked to a specific asset and requires labor hours, parts used, and contractor costs to be recorded before closure. This configuration is the data foundation of the entire cost model — without it, cost accumulation at the asset level is impossible.
Book a Demo to configure cost capture for your work order types.
↓
Step 2
Set Production Value Per Hour for Critical Assets
Define the production revenue value per downtime hour for each critical asset class. This parameter allows OxMaint to calculate delay exposure cost automatically from downtime tracking data — converting equipment failures from maintenance events into quantified financial impacts that operations and finance teams can act on.
↓
Step 3
Assign Replacement Cost Values to Asset Records
Enter current replacement cost values for all assets in your OxMaint asset register. OxMaint will use these values to calculate the lifecycle cost ratio — total accumulated maintenance spend as a percentage of replacement cost — and flag assets that have crossed defined replacement consideration thresholds.
Sign Up Free to set up lifecycle cost ratios for your production assets.
↓
Step 4
Build Risk-Ranked Cost Views in the Analytics Module
Configure OxMaint's analytics module to display maintenance cost per asset ranked by criticality — so that budget allocation conversations are anchored in data showing where high spend is occurring on critical assets versus where money is being consumed on low-impact equipment.
↓
Step 5
Run Monthly Cost Model Reviews to Drive Capital Planning
Present OxMaint lifecycle cost reports in monthly capital planning reviews — identifying assets approaching replacement thresholds, assets with accelerating repair cost trends, and assets where delay exposure cost justifies increased PM investment. This cycle converts maintenance cost modeling from a reporting exercise into a capital decision support process.
Sign Up Free to activate capital planning analytics in OxMaint.
Key KPIs for Maintenance Cost Modeling
These metrics give maintenance and operations leaders the financial visibility needed to manage production asset costs proactively — before budget overruns occur and before replacement decisions are made too late. Book a Demo to see OxMaint's cost modeling KPI dashboard configured for your asset portfolio.
Maintenance Cost per Asset per Year
Total direct maintenance spend — labor, parts, and contractor — per asset annually. The foundational metric for identifying cost outliers and tracking year-over-year cost trends per equipment unit.
Lifecycle Cost Ratio
Accumulated lifetime maintenance spend as a percentage of current replacement cost. Assets exceeding 60–80% of replacement cost are typically flagged for capital renewal planning.
Delay Exposure Cost per Asset
Production revenue lost due to unplanned downtime per asset per period. Adds the true financial impact of failure to direct maintenance cost — often 2–4x larger than direct repair costs for critical production assets.
Cost per Work Order by Type
Average cost of planned PM, predictive, and corrective work orders. Significant cost differences between planned and reactive work order types quantify the financial value of proactive maintenance investment.
Maintenance Cost as Percentage of Asset Value (RAV)
Annual maintenance spend divided by replacement asset value. Industry benchmarks suggest 2–5% for well-maintained assets. Higher ratios signal deteriorating asset condition or inadequate PM strategy.
Cost Trend by Asset Class
Year-over-year maintenance cost trajectory per equipment category. Rising cost trends on specific asset classes provide advance warning of systemic deterioration before individual asset failures become unmanageable.
Build Asset-Level Maintenance Cost Models with OxMaint
Per-asset cost accumulation. Delay exposure quantification. Lifecycle cost ratios. Risk-ranked budget analytics. All in one CMMS built for production asset financial management.
Frequently Asked Questions
What is maintenance cost modeling for production assets?
It is the practice of accumulating and analyzing all direct and indirect maintenance costs at the asset level — including labor, parts, contractor spend, and production delay exposure — to support budget allocation, capital planning, and repair vs. replace decisions.
How does OxMaint capture maintenance costs per asset?
OxMaint links every work order to a specific asset and requires labor hours, parts used, and contractor costs to be recorded before closure — automatically accumulating lifetime cost data per asset in the CMMS record.
What is delay exposure cost in maintenance cost modeling?
Delay exposure cost is the production revenue impact of unplanned asset downtime — calculated as downtime hours multiplied by production value per hour. It is typically 2–4x larger than direct repair costs for critical assets.
How does lifecycle cost modeling support repair vs. replace decisions?
By comparing accumulated lifetime maintenance spend against current replacement value, OxMaint identifies assets where continued repair investment exceeds replacement cost — giving capital planning teams financially grounded justification for replacement requests.
What KPIs should maintenance cost models track?
Key metrics include maintenance cost per asset per year, lifecycle cost ratio, delay exposure cost, maintenance as percentage of replacement asset value, and cost trend by asset class — all automatically tracked in OxMaint.
Can OxMaint support risk-ranked maintenance budget allocation?
Yes. OxMaint combines asset criticality ratings with per-asset cost data to produce risk-ranked cost views — enabling budget decisions that prioritize high-criticality equipment over low-impact assets.
Book a Demo to see risk-ranked cost analytics for your asset portfolio.
Give Your Team the Cost Visibility to Manage Assets Financially
OxMaint delivers per-asset maintenance cost modeling, delay exposure quantification, lifecycle cost analysis, and risk-ranked budget analytics — purpose-built for production asset managers who need financial clarity to make better maintenance decisions.