Industrial asset decisions made without a full lifecycle cost model routinely lead to premature replacement of repairable equipment or costly over-extension of assets past their economic life. Facilities using Sign Up Free with Oxmaint replace gut-feel repair-or-replace decisions with data-driven lifecycle cost analysis — capturing cumulative repair spend, depreciation curves, and projected renewal timing in a single asset record. An aging compressor with rising repair frequency and declining availability isn't just a maintenance problem — it's a capital planning signal that only surfaces when ownership cost data is structured and visible. Book a Demo to see how Oxmaint structures asset economics across your industrial portfolio.
LIFECYCLE COST · ASSET ECONOMICS · RENEWAL TIMING · CAPITAL PLANNING · 2026
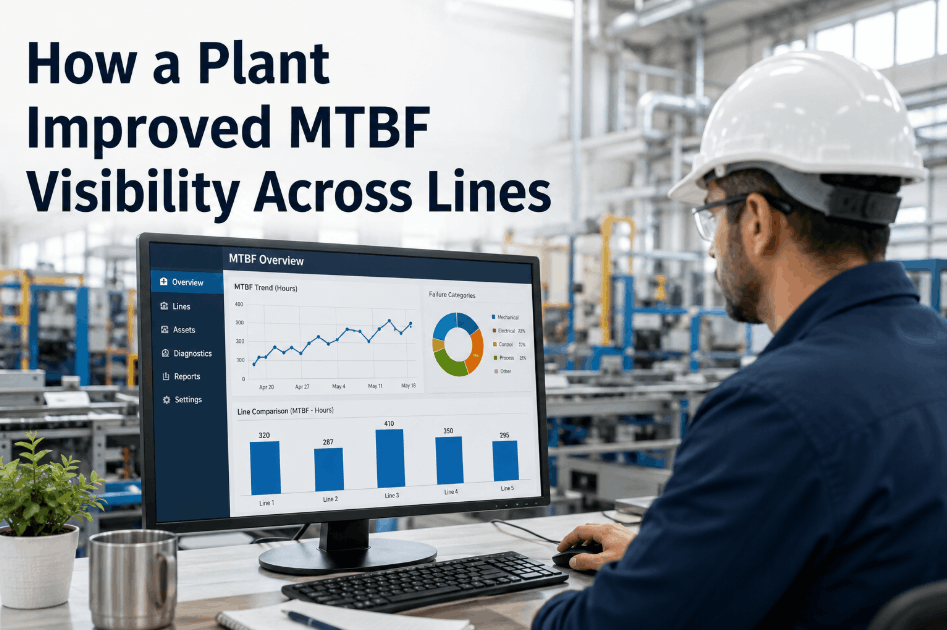
Lifecycle Cost Model for Industrial Assets
Use cumulative repair spend, depreciation paths, and service life data to build a lifecycle cost model that identifies the right renewal timing — before over-investment in failing assets or premature replacement of still-viable equipment.
30–40%Average overspend on repair budgets when lifecycle cost visibility is absent from asset decisions
P/R RatioRepair cost as a percentage of replacement value — the primary economic life signal for renewal decisions
2–5×Higher total ownership cost for assets maintained past economic life versus timely renewal
CMMSCentralized maintenance data system required to build accurate cumulative cost records per asset
Why Industrial Asset Decisions Break Without Lifecycle Cost Data
Most industrial facilities track individual work orders but never aggregate repair spend to the asset level over time. Without a cumulative cost record, the repair-or-replace decision defaults to the most recent repair invoice — missing the pattern that only emerges across years of maintenance history. Oxmaint's CMMS links every work order, parts charge, and labor hour to a specific asset record, building the cost curve automatically. Sign Up Free to start building structured lifecycle cost records for your critical industrial assets.
The Capital Waste Problem
Replacing Assets That Still Have Economic Life
Without visibility into actual cumulative repair spend versus replacement value, maintenance teams under-pressure often request capital replacement on assets that have consumed only 50–60% of their service life. Structured lifecycle cost data surfaces remaining value — protecting capital budgets from premature replacement decisions.
The Over-Extension Problem
Running Assets Past Their Economic Life
Assets held past their economic life accumulate repair costs that exceed the carrying cost of a replacement — while delivering declining availability and reliability. P/R ratios above 40–50% annually signal an asset past its renewal point. This pattern is invisible without a structured cost model tracking spend over the full ownership period.
The 3 Data Layers of an Industrial Asset Lifecycle Cost Model
1
Cumulative Repair Spend Per Asset
Total lifetime maintenance cost — parts, labor, contractor spend — aggregated to the asset level over its full service history. Oxmaint tracks this automatically from closed work orders, creating a rolling cost curve without manual data compilation. The cumulative record is the foundation of every renewal decision.
2
Depreciation Path and Replacement Value
Current asset book value and current replacement cost establish the denominator for P/R ratio calculation. Oxmaint asset records store acquisition cost, depreciation method, and current replacement value — enabling real-time calculation of where an asset sits on its economic life curve.
3
Failure Frequency and Downtime Cost Trend
Rising failure frequency and increasing unplanned downtime are leading indicators of an asset approaching end-of-economic-life — often appearing before repair costs alone cross the renewal threshold. Oxmaint's asset history links MTBF trends to cost data, giving plant leaders a complete economic picture before the capital decision.
Lifecycle Cost Model Reference — By Asset Class and Renewal Signal
| Asset Class |
Typical Service Life |
P/R Renewal Threshold |
Key Cost Driver |
Leading Indicator |
Renewal Trigger |
| Industrial motors (>50 HP) |
15–25 years |
35–40% annually |
Rewinds, bearing replacement |
Rising rewind frequency |
Third rewind event |
| Centrifugal pumps |
10–20 years |
30–40% annually |
Seal, impeller, shaft wear |
Increasing seal change interval |
P/R >40% + declining MTBF |
| Air compressors |
10–15 years |
40–50% annually |
Valve, piston, control system |
Increasing unload cycling |
Annual repair > 45% replacement |
| Heat exchangers |
15–30 years |
50% cumulative life |
Tube bundle replacement |
Rising fouling frequency |
Second bundle replacement |
| Conveyor systems |
10–20 years |
35% annually |
Belt, drive, idler wear |
Increasing belt splice rate |
P/R ratio trend > 3 years |
| PLC / control systems |
10–15 years |
Parts obsolescence |
Card replacement, integration |
Spare parts availability |
OEM end-of-support date |
How Oxmaint Structures Lifecycle Cost Visibility for Plant Leaders
Oxmaint's asset management module connects work order history, parts consumption, and downtime records to each asset — building the cost curve that capital planning requires. Maintenance managers can view cumulative repair spend, P/R ratio trends, and MTBF trajectories in a single asset dashboard without compiling data from multiple systems. Book a Demo to see how Oxmaint supports lifecycle cost modeling across multi-site industrial portfolios.
Asset Cost History
Every work order, parts charge, and labor hour linked to the asset record — building a cumulative repair cost curve automatically over the asset's service life.
P/R Ratio Tracking
Repair-to-replacement value ratios calculated from asset records — surfacing renewal candidates before they consume excess capital in diminishing-return repair cycles.
Failure Trend Analysis
MTBF and failure frequency trends per asset identify deteriorating reliability before cost curves alone signal the renewal threshold.
Capital Planning Reports
Portfolio-level renewal reports prioritize capital requests by economic life position — giving finance teams objective data behind replacement budget submissions.
Downtime Cost Integration
Unplanned downtime costs linked to asset failure records — extending the lifecycle cost model beyond repair invoices to full production impact visibility.
Multi-Site Benchmarking
Compare lifecycle cost performance across sites and asset classes — identifying outlier assets consuming disproportionate maintenance resources versus peers.
Replace Gut-Feel Renewal Decisions with Structured Asset Economics.
Oxmaint's CMMS builds the lifecycle cost record automatically — linking repair spend, failure history, and downtime data to every asset so renewal decisions are supported by evidence, not instinct.
Frequently Asked Questions — Lifecycle Cost Model for Industrial Assets
What is the P/R ratio and when should it trigger an asset renewal decision?
The P/R ratio compares annual repair spend to current replacement value. When annual repair costs consistently exceed 35–50% of replacement value (varies by asset class), the asset has typically passed its economic life and renewal delivers better long-term value than continued repair.
How does Oxmaint help build a lifecycle cost model without manual data compilation?
Oxmaint links every closed work order, parts charge, and labor record to the associated asset — building cumulative cost history automatically. Plant leaders access lifecycle cost data from the asset dashboard without spreadsheet compilation.
Can Oxmaint support capital budget planning with asset lifecycle data?
Yes. Oxmaint generates renewal candidate reports ranked by P/R ratio, MTBF trend, and cumulative repair spend — giving plant and finance teams objective economic data to support capital replacement budget submissions.
What data inputs does a reliable industrial lifecycle cost model require?
Acquisition cost, current replacement value, cumulative repair spend (parts + labor), failure frequency history, and unplanned downtime cost. Oxmaint captures all five from normal CMMS operations without additional data entry.
How does failure frequency data improve lifecycle cost decisions beyond repair costs alone?
Rising failure frequency signals declining reliability before repair costs cross renewal thresholds. Combining MTBF trend with cost curve data catches assets approaching end-of-economic-life earlier — reducing surprise failures and unplanned downtime during the transition period.
Build the Lifecycle Cost Visibility Your Capital Decisions Require.
Oxmaint connects repair history, downtime data, and asset economics into a single record — giving plant leaders the structured cost model needed to make confident renewal, repair, and capital planning decisions across the industrial asset portfolio.