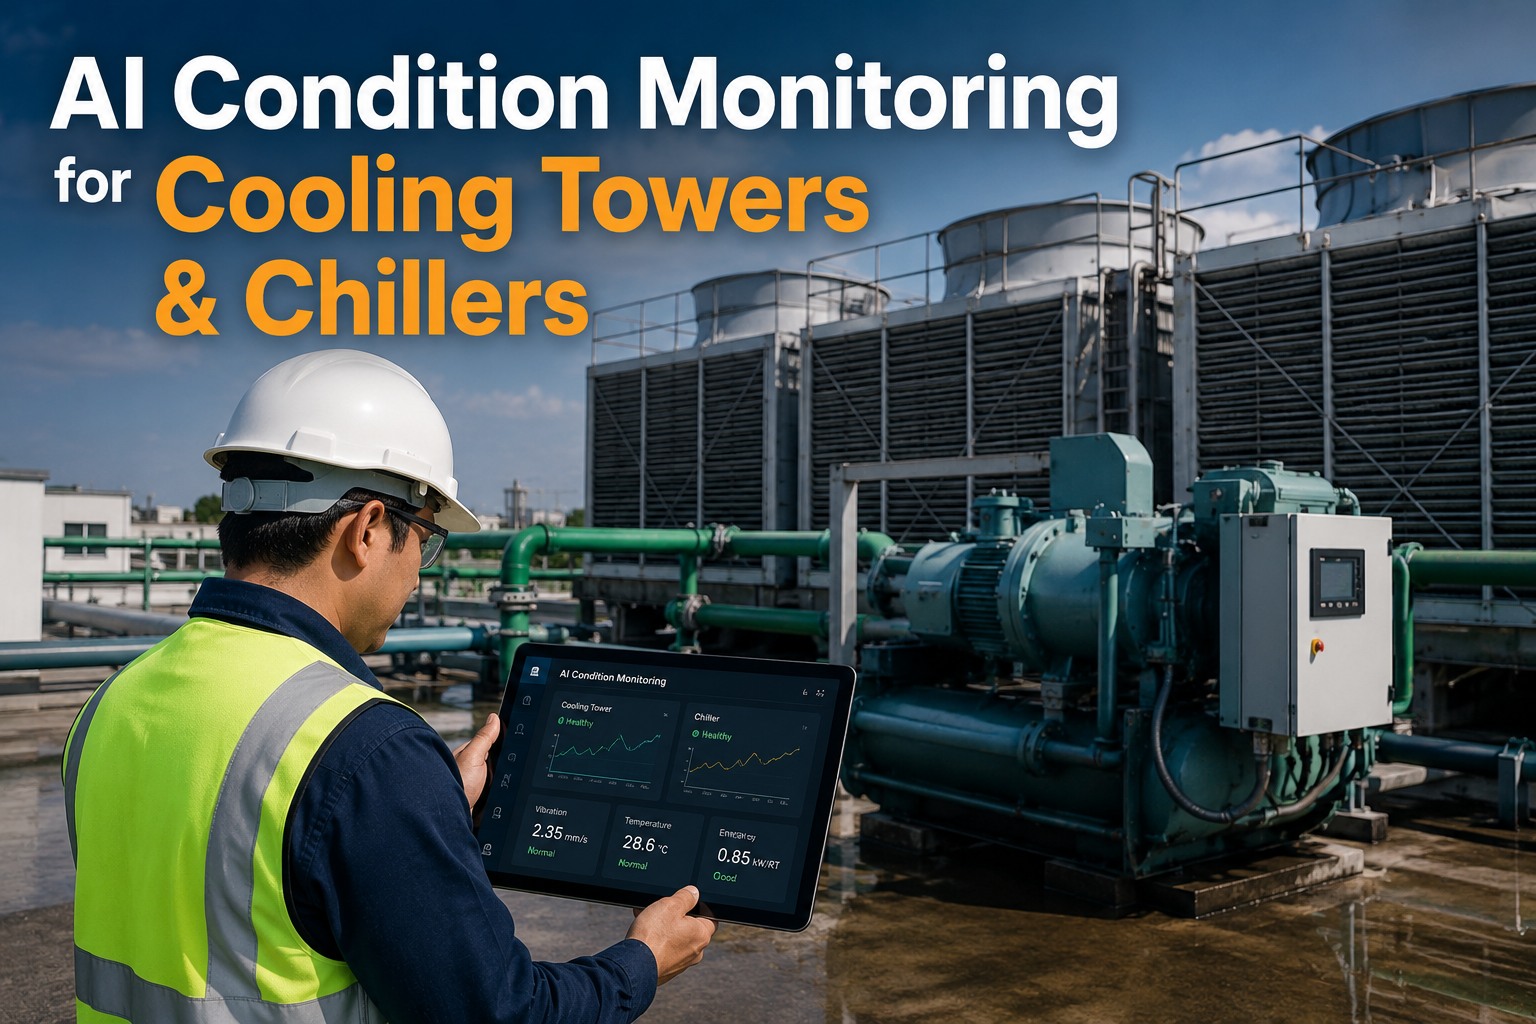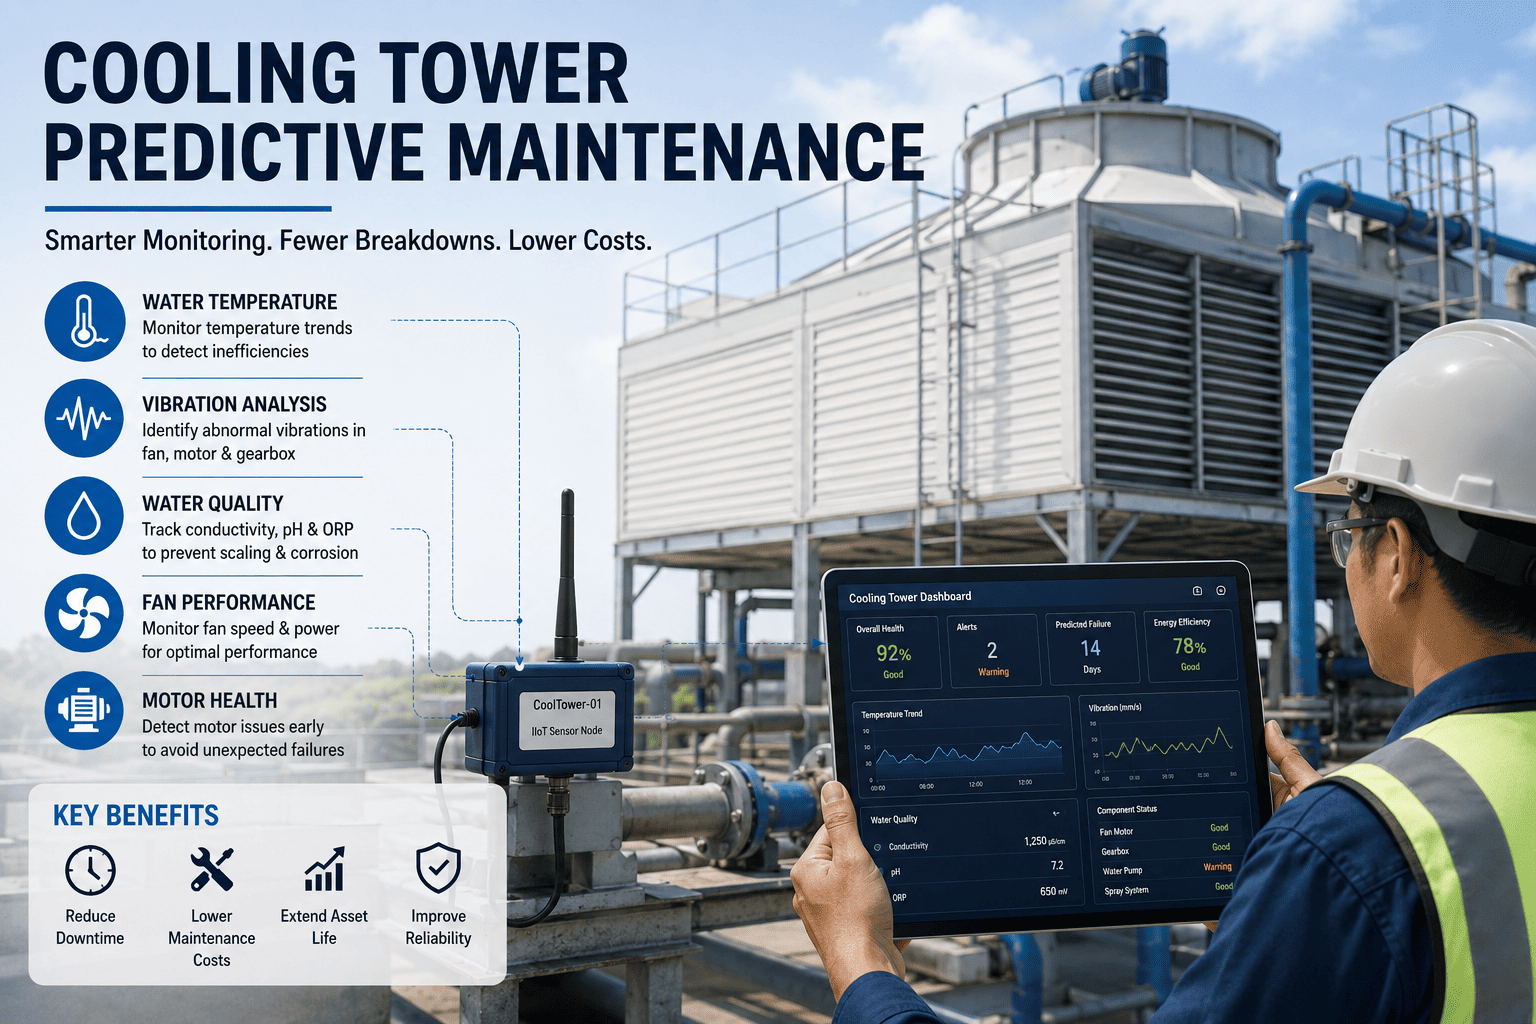
Cooling towers are the silent workhorses of manufacturing, regulating process temperature across everything from injection molding to chemical distillation — and when one fails unexpectedly, the cascade hits chillers, compressors, and production yield within hours. Studies from the International Institute of Ammonia Refrigeration place unplanned cooling tower downtime at $12,000–$50,000 per incident in mid-sized plants, with 60% of failures traceable to fouling, fan imbalance, or water-chemistry drift that predictable monitoring would have caught weeks earlier. This guide walks through a proven predictive maintenance framework: vibration signatures on fan decks, fill fouling factor tracking, drift eliminator inspection cadence, and how to operationalize it all inside your CMMS so seasonal PMs align with thermal load. Ready to stop reacting to tower failures? Start Free Trial and configure your first asset registry today.
What if you could predict your next cooling tower failure 30 days before it happens?
Vibration analytics, fouling-factor trending, and water-chemistry monitoring collapse reactive firefighting into a scheduled 20-minute intervention — protecting chillers, compressors, and downstream process yield before thermal drift ever reaches the floor.
Where cooling towers actually fail — and what to monitor
Across 8 years of industrial PdM deployments, five failure modes account for 88% of cooling tower outages in manufacturing. Each has a measurable leading indicator you can trend inside a CMMS long before production feels the heat.
Fan Vibration & Imbalance
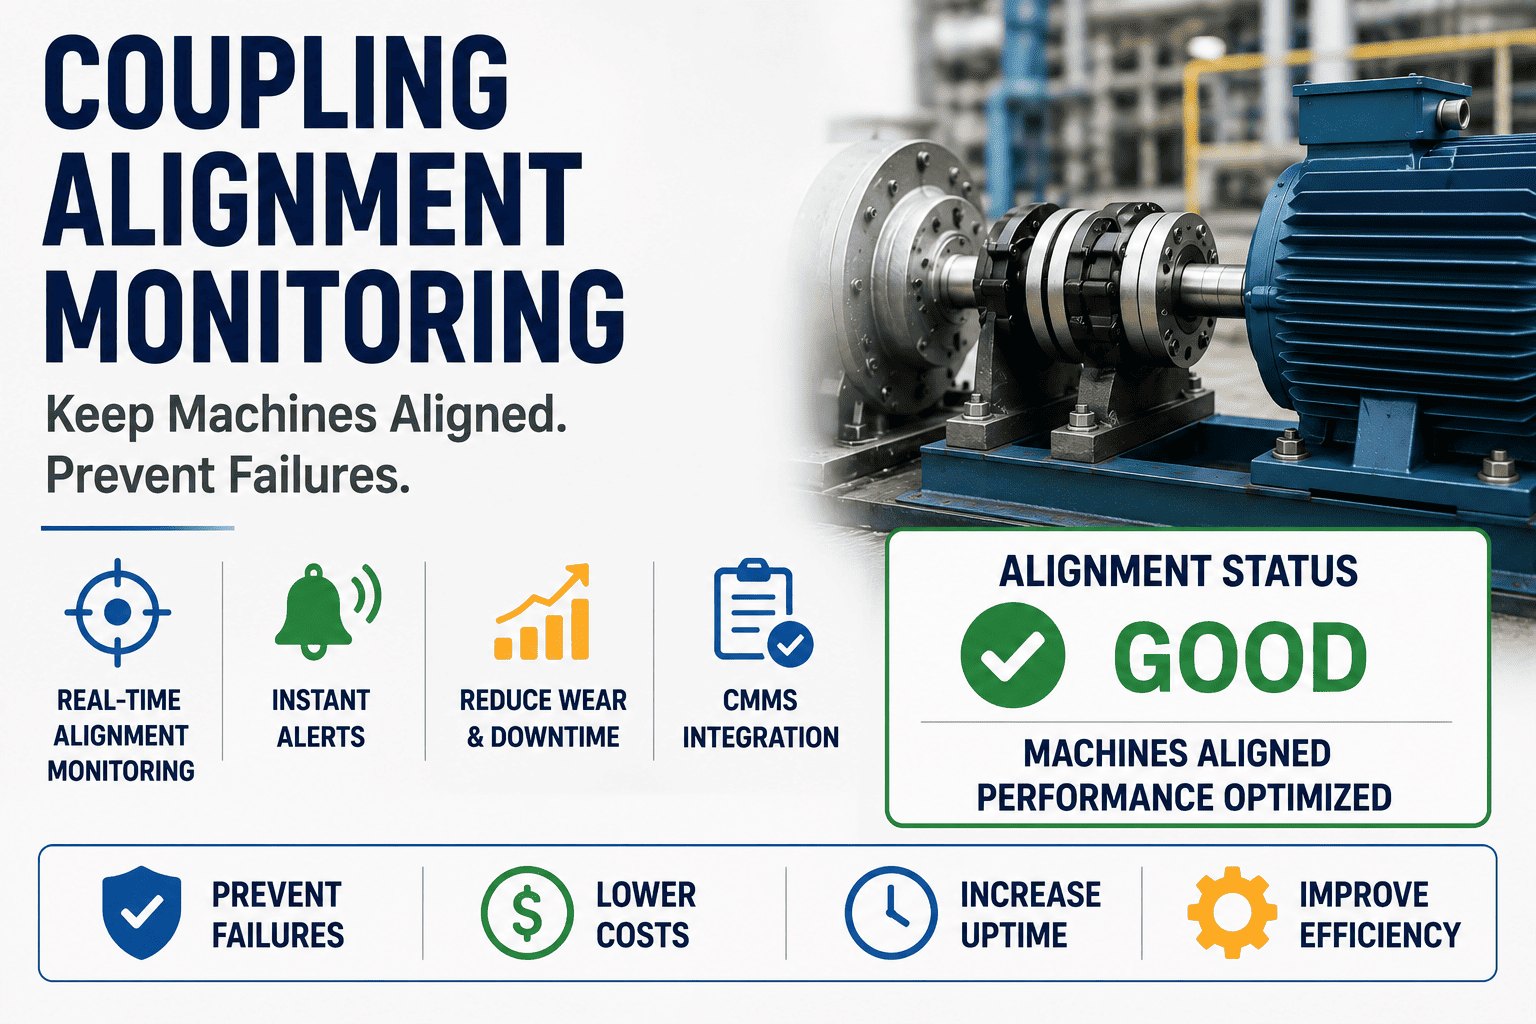
Accelerometers on the fan deck catch bearing wear, blade erosion, and coupling misalignment 2–6 weeks before catastrophic failure. Trend ISO 10816 velocity (mm/s RMS) — alarm at 7.1 mm/s for fans under 1,000 RPM, 3.5 mm/s above. A 10% vibration rise over baseline typically precedes a 40% jump within 14 days.
Fill Fouling & Thermal Degradation
As biological growth, scale, and suspended solids coat PVC fill, the approach temperature (cold water vs. wet-bulb) climbs. Track fouling factor monthly: a 0.5°F approach drift over 30 days signals 15–20% fill occlusion and a 12% drop in heat-rejection capacity — enough to trip a chiller high-pressure limit on a 95°F day.
Pump Cavitation & Seal Degradation
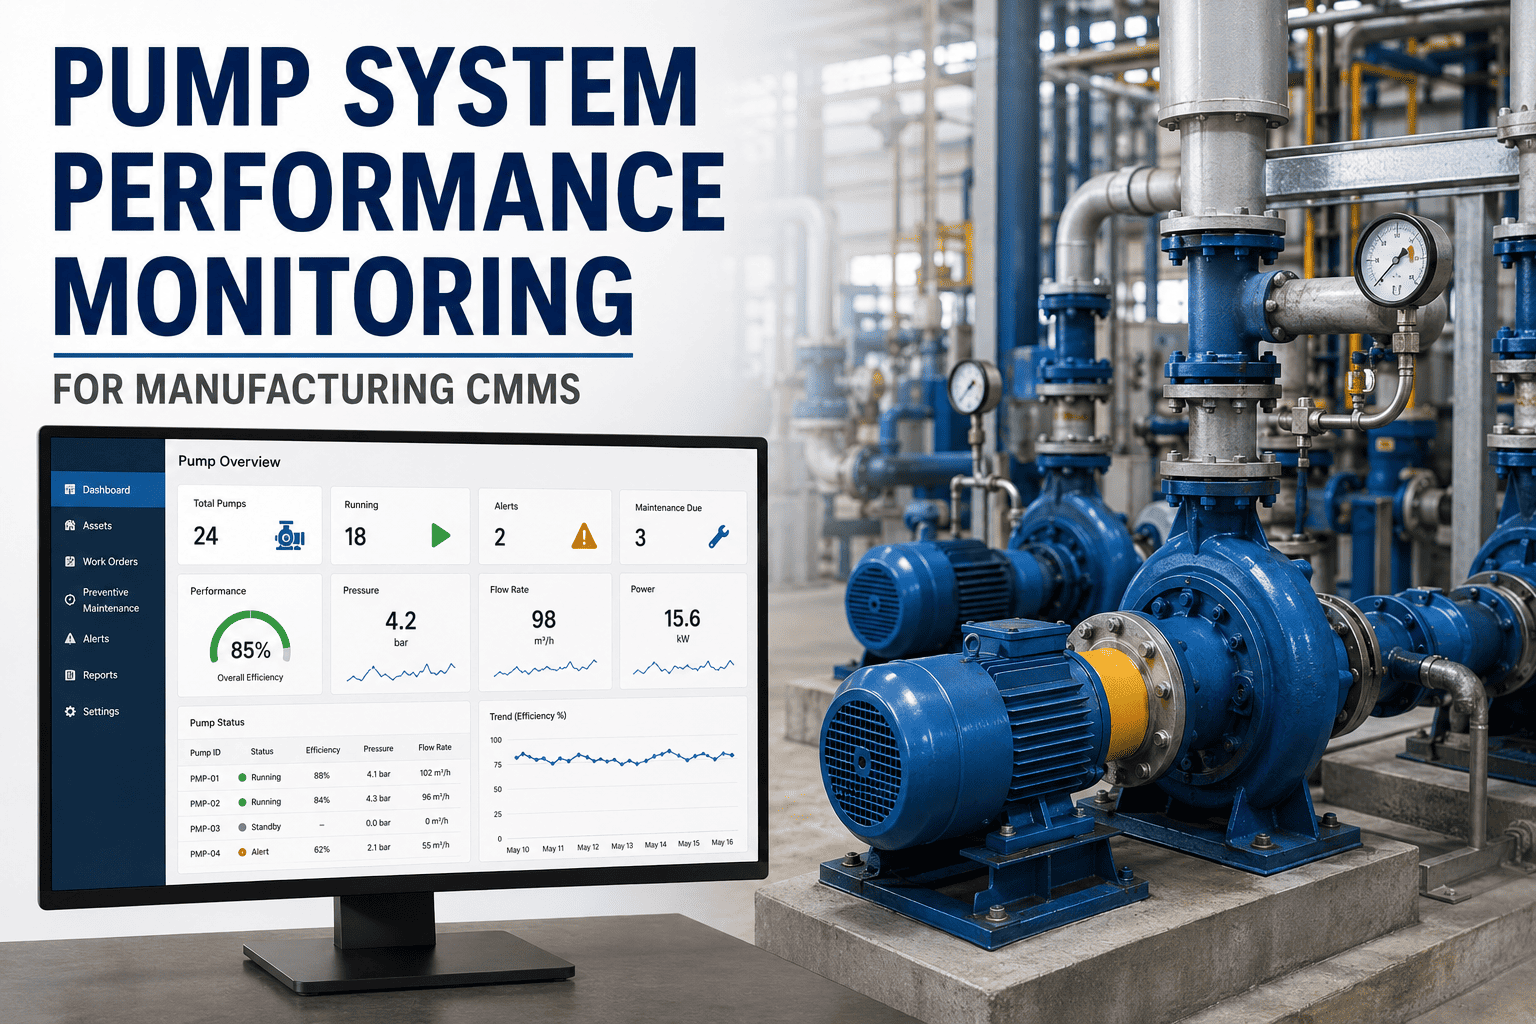
Centrifugal circulating pumps run close to NPSH limits. Cavitation manifests as high-frequency vibration (20–40 kHz acoustic emission) and a 5–8% amperage swing. Trend motor current, discharge pressure, and bearing temperature — a seal failure on a 75 HP circulating pump costs $3,800 in parts and 6 hours of downtime if caught late.
Drift Eliminator & Distribution Degradation
Drift eliminators lose efficiency at 3–5% per year as blades warp and biofilm accumulates. A drift rate above 0.005% of circulating flow triggers Legionella risk and water-loss penalties. Inspect quarterly via visual borescope and track make-up water volume — a 15% unexplained increase points to drift or leak failure.
Water Chemistry Excursion
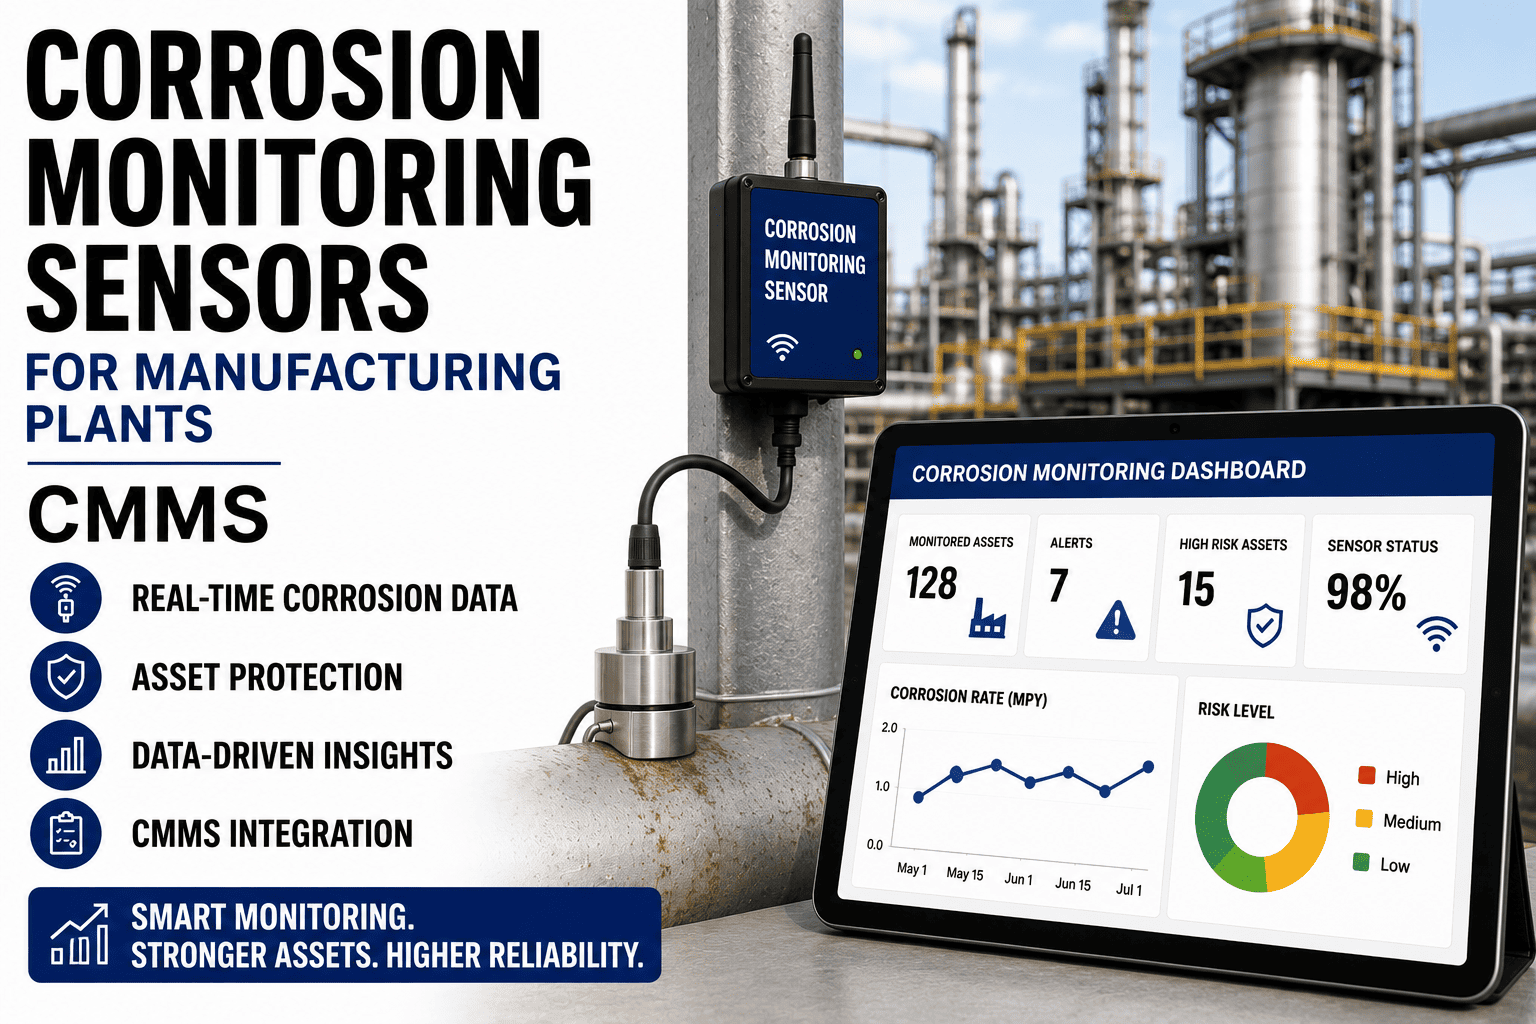
Conductivity, pH, and free chlorine drift corrodes galvanized steel at 0.3 mm/year when pH drops below 6.5. Automate daily sampling and tie it to blowdown valve actuation. A single unmanaged excursion can shorten cell life by 18 months and void manufacturer warranty under CTI ATC-128.
The 24-point cooling tower PdM checklist
Organize these by frequency inside your CMMS. Each item links to a sensor reading, work-order trigger, or inspection form — so nothing lives in a clipboard.
- Review fan vibration trend chart for >10% baseline deviation
- Log cold-water temperature vs. wet-bulb approach
- Inspect drift eliminators for biofilm or blade deformation
- Verify conductivity sensor calibration within ±2%
- Check make-up water totalizer vs. previous week
- Confirm sump water level and float switch response
- Trend fouling factor across approach temperature delta
- Measure pump motor amperage under full thermal load
- Sample circulating water: pH, TDS, hardness, chloride
- Inspect gear reducer oil for water ingress (Karl Fischer)
- Lubricate fan bearings per OEM grease specification
- Test vibration alarm thresholds and relay logic
- Photograph fill section for fouling baseline comparison
- Audit chemical dosing pump stroke frequency
- Borescope inspect fan blades for erosion and cracks
- Perform pump NPSH margin verification under peak load
- Clean and descale spray nozzles (expect 5–15% occlusion)
- Calibrate all temperature, pressure, and flow transmitters
- Inspect structural fasteners for galvanic corrosion
- Validate drift eliminator efficiency per CTI Standard 136
- Trend fan motor winding resistance and Megger insulation
- Review 90-day thermal performance KPI vs. design spec
- Test standby cell switchover and automatic controls
- Update CMMS asset criticality and spare parts min/max
A 12-month CMMS scheduling rhythm for cooling towers
Thermal load swings 40–60% between seasons in most plants. Aligning PM intensity to that curve keeps labor focused where risk concentrates — peak summer load and pre-winter layup.
Drain and inspect wetted sections, descale basin, replace sacrificial anodes. Best window for fill replacement — labor cost is 30% lower and downtime impact near zero.
Calibrate sensors, test chemical dosing loops, baseline vibration and approach temperature. Lock in summer KPI thresholds before May thermal load arrives.
Weekly vibration trending, daily water-chemistry logging, biweekly drift eliminator inspection. This is where 55% of failures occur — increase PdM frequency by 2x.
Full fan and pump inspection, bearing replacement if vibration trended up 15%+ over summer. Capture lessons learned and update PM templates in CMMS for next cycle.
For idle cells: drain, dry, and protect with desiccant. For running cells: verify heat-trace on exposed piping, trend gear oil temperature, and confirm freeze-protection logic.
Vibration sensors, approach temperature, and water chemistry feed live into CMMS dashboards. AI anomaly detection flags leading indicators 14–30 days ahead of failure.
The financial case: what predictive cooling tower maintenance returns
A 180-asset manufacturing plant spending $42K/year on reactive cooling tower repairs typically sees payback in 7–9 months after deploying condition-based monitoring. Here is the arithmetic.
Example — A food processing plant with 3 crossflow cells avoided 38 downtime hours, saved 240 labor hours, and recovered 6% chiller efficiency worth $14K annually. Net Year-1 savings: $61,400 against a $9,200 sensor and software investment.
| Metric | Reactive (Baseline) | Predictive (Post-Deployment) | Annual Impact |
|---|---|---|---|
| Unplanned downtime hours | 52 hrs/yr | 9 hrs/yr | −83% |
| Mean time between failures | 14 months | 38 months | 2.7x |
| Avg. repair cost per incident | $8,400 | $2,100 | −$6,300 |
| Maintenance labor hours | 920 hrs/yr | 580 hrs/yr | −37% |
| Chiller energy penalty (fouled tower) | +11% kWh | +2% kWh | −$18,200 |
| Water treatment overrun | $22,000 | $15,600 | −29% |
Stop firefighting cooling tower failures — start predicting them.
Deploy vibration, fouling, and water-chemistry monitoring inside a unified CMMS in under 14 days. Your first asset dashboard is live before the next quarterly PM cycle.
Cooling tower predictive maintenance — answered
What sensors are required to start predictive cooling tower maintenance?
A baseline deployment needs three: a tri-axial accelerometer on each fan deck, a conductivity and pH probe in the basin, and a differential temperature sensor pair measuring approach. Total hardware cost runs $1,200–$2,800 per cell. You can expand to acoustic emission sensors on pumps and drift-rate flow meters in Phase 2. Most plants see ROI from the first three alone. Start Free Trial to map your sensor layout.
How does predictive maintenance differ from preventive maintenance for cooling towers?
Preventive maintenance runs on fixed calendar intervals — change bearings every 12 months, descale every quarter regardless of condition. Predictive maintenance triggers work orders based on actual asset condition: a bearing is replaced when vibration velocity trends 15% above baseline, descaling happens when approach temperature drifts 0.5°F. PdM typically cuts labor by 30–40% and parts spend by 25% because you act on real degradation, not the calendar.
Can a CMMS integrate with existing PLC and SCADA systems on the cooling tower?
Yes — modern CMMS platforms pull data via OPC-UA, Modbus TCP, or MQTT from existing PLCs and SCADA historians. If your tower already reports fan status, basin temperature, and make-up water flow to a building automation system, the CMMS consumes that stream and converts it into work-order triggers. No rip-and-replace of control infrastructure is required; integration takes 2–5 days per cell.
What is the typical payback period for cooling tower PdM in manufacturing?
Most mid-sized manufacturing plants (3–8 cooling tower cells, 100K–500K sq ft) see payback in 7–11 months. The fastest payback comes from avoiding a single catastrophic fan failure or chiller trip — one prevented $25K incident covers the entire annual sensor and software cost. Plants running 24/7 process loads with high downtime cost per hour often break even in under 4 months.
How often should drift eliminators and fill be inspected under a predictive program?
Drift eliminators get a visual borescope inspection quarterly and an efficiency test annually per CTI Standard 136. Fill inspection shifts from calendar-based to condition-based: monitor approach temperature and fouling factor monthly, and schedule physical inspection when approach drifts 0.5°F above baseline or fouling factor exceeds 0.0008 hr·ft²·°F/BTU. In well-treated water, fill may last 8–12 years; in poorly managed chemistry, it degrades in 4. Book a Demo to build your inspection cadence.
Your cooling towers can predict their own failures. Start today.
Join 600+ manufacturing plants using OxMaint to turn vibration, fouling, and water-chemistry data into scheduled interventions — not midnight emergency calls.
Free 14-day trial · No credit card