Pump performance rarely fails overnight; it erodes by fractions of a percent each week until a 5% efficiency drop quietly consumes thousands of dollars in wasted energy across a single year. For a 180-asset manufacturing plant running mid-size centrifugal pumps 6,000 hours annually, that hidden drift can translate to $42,000 or more in avoidable power, seal replacement, and unplanned downtime costs. This guide breaks down the five monitoring signals—flow, head, efficiency, vibration, and seal performance—that separate predictive maintenance programs from reactive ones, and shows how CMMS-based deviation alerts turn pump-curve data into action. Ready to stop paying for inefficiency you can't see? Start Free Trial and benchmark every pump in your plant within 48 hours.
Can you measure the exact hour a 5% efficiency drop began?
Most plants discover pump degradation only after a seal fails or a motor trips — by then, the energy loss has been compounding for months. Continuous monitoring across flow, head, amperage, vibration, and seal integrity catches the deviation the week it starts, not the quarter it surfaces.
Why a 5% efficiency drop is louder than it sounds
Pumps consume roughly 25–40% of total motor energy in a typical manufacturing facility. A single 5% efficiency decline — often caused by wear ring erosion, impeller imbalance, or seal friction — rarely triggers an alarm, yet it steadily inflates energy bills and shortens mean time between failures.
A 5% efficiency drop on a 75 kW pump running 6,000 hours per year wastes roughly $4,200 in energy alone — before you count the accelerated wear on seals, bearings, and couplings that follows.
Five signals that reveal pump health before failure
Each signal below maps to a specific failure mode and a specific CMMS alert threshold. Monitoring all five in concert gives you a complete picture of pump system health — not just a single noisy metric.
Discharge flow rate vs. pump-curve baseline
A 7–10% drop from the expected flow at a given head signals internal wear, blockage, or impeller damage. Log flow every 15 minutes and compare against the OEM pump curve; deviation sustained beyond 24 hours should auto-generate a CMMS work order.
Differential pressure across suction and discharge
Total dynamic head should stay within ±5% of the design point for the operating flow. Falling head at constant flow indicates wear ring clearance loss; rising head at falling flow suggests a downstream restriction or valve issue.
Wire-to-water efficiency calculation
Compare hydraulic power output (flow × head × specific gravity) against electrical power input (motor kW). A pump that drops from 78% to 71% efficiency has crossed the threshold where repair costs are typically offset within 90 days of energy savings alone.
Vibration signature and frequency analysis
ISO 10816 velocity thresholds: below 2.8 mm/s RMS is acceptable for most mid-size pumps; 4.5 mm/s triggers a caution alert; 7.1 mm/s demands shutdown within days. Spike frequency at 1× RPM indicates imbalance; 2× RPM points to misalignment; vane-pass frequency reveals cavitation onset.
Seal chamber pressure, temperature, and leakage
Mechanical seal failure accounts for up to 40% of pump repair events. Monitor seal flush flow rate, chamber temperature rise (alert above 80°C for water service), and visible leakage. A 5°C temperature climb over 48 hours often precedes seal face failure by 2–4 weeks.
The math behind catching drift early
Consider a 180-asset plant where 40 critical centrifugal pumps (average 55 kW) run 6,000 hours per year at $0.12/kWh. Here is how the numbers compound when efficiency monitoring catches a 5% drop in week 3 versus week 26.
Across 40 pumps with average 5% drift, that is $79,200 in avoidable energy spend annually — before factoring seal and bearing damage.
Catching drift in week 3 instead of week 26 recovers roughly $35K — typically 6–8× the annual cost of a CMMS-based monitoring subscription for the same asset fleet.
What the first 90 days of monitoring look like
A phased rollout prevents alert fatigue and builds technician trust in the data. Here is the typical trajectory for a manufacturing plant deploying pump performance monitoring through a CMMS.
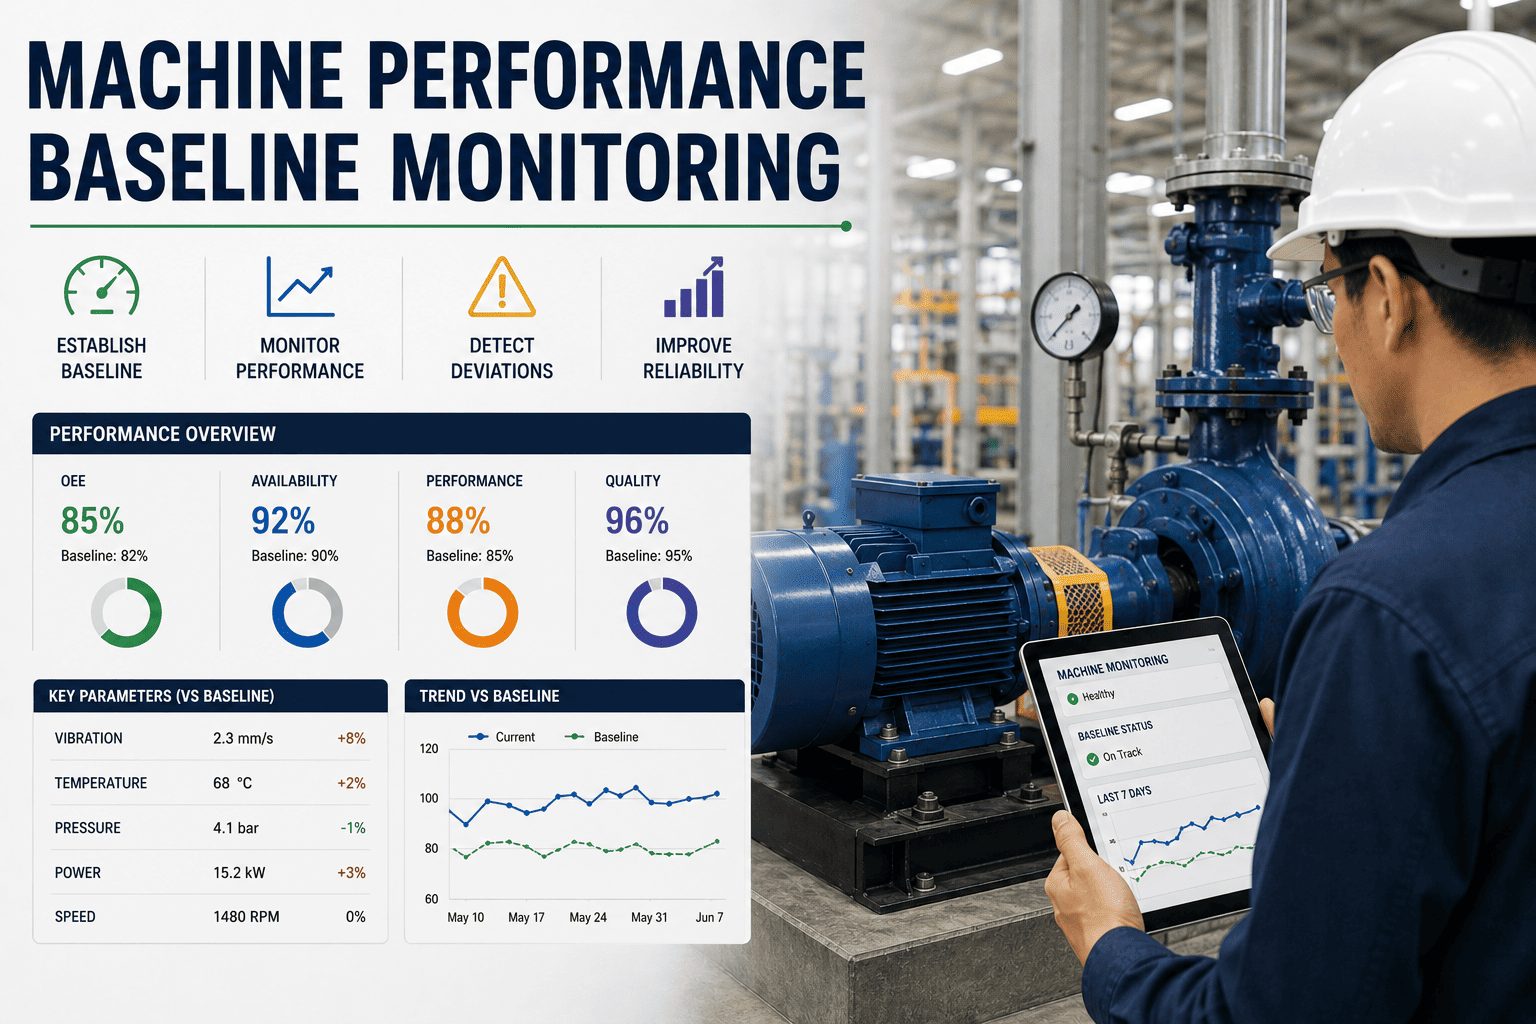
Establish pump-curve baselines
Instrument 15–20 critical pumps with flow, pressure, and amperage sensors. Import OEM pump curves into the CMMS. Confirm sensor accuracy within ±2% through spot checks. Expected outcome: 100% of critical assets baselined.
Tune deviation thresholds
Set alert thresholds at 5% flow deviation, 3% head deviation, and 4.5 mm/s vibration. Suppress false positives during known transient events (startups, valve changes). Expected outcome: fewer than 5 false alerts per week per asset.
Convert alerts into scheduled work
Auto-generate CMMS work orders for sustained deviations. Tie each alert to a specific repair procedure (wear ring replacement, seal flush, alignment check). Expected outcome: first measurable reduction in unplanned downtime events.
CMMS deviation alert reference table
Use these thresholds as a starting point for mid-size centrifugal pumps (15–150 kW) in continuous manufacturing service. Adjust ±20% based on your specific OEM curve and operating duty.
| Signal | Caution Threshold | Critical Threshold | CMMS Action |
|---|---|---|---|
| Flow deviation from curve | −5% sustained 24h | −10% sustained 4h | Auto work order — inspect impeller |
| Head deviation | ±5% from design point | ±10% at constant flow | Auto work order — check wear rings |
| Wire-to-water efficiency | Drop > 3 points | Drop > 7 points | Schedule repair within 14 days |
| Vibration velocity (ISO 10816) | 4.5 mm/s RMS | 7.1 mm/s RMS | Critical — shutdown within 48h |
| Seal chamber temperature | +5°C over 48h baseline | 80°C (water service) | Inspect seal flush immediately |
| Motor amperage vs. flow | +8% at constant flow | +15% at constant flow | Check for cavitation or blockage |
What plants see within the first quarter
Plants that implement structured pump performance monitoring consistently report measurable gains within 90 days. Here are typical outcomes across three manufacturing sectors.
"We caught 12 pumps operating 8–14% off their curves within the first month. Correcting trim and wear rings saved $31K in energy before the quarter ended."
"Vibration alerts on a cooling water pump flagged a bearing issue three weeks before it would have seized. The repair cost $2,800; the avoided failure would have cost $19K plus 11 hours of line downtime."
"Seal failure rate dropped 38% in six months after we linked seal temperature alerts directly to CMMS work orders. We now plan seal replacements instead of reacting to leaks."
Stop paying for pump inefficiency you can't see
Deploy CMMS-based pump monitoring across your critical assets and catch 5% efficiency drift the week it begins — not the quarter it costs you.
Pump monitoring questions, answered
How quickly can we see ROI from pump performance monitoring?
Most plants recover the monitoring investment within 60–90 days. A single caught efficiency drift on a 55 kW pump running 6,000 hours annually saves roughly $1,980 in energy alone; across 20–40 monitored pumps, the cumulative savings typically exceed the CMMS subscription cost by 4–8× within the first quarter. You can Start Free Trial to baseline your fleet and calculate your specific payback.
Do we need new sensors, or can we use existing instrumentation?
Most mid-size manufacturing plants already have 60–70% of the required instrumentation — discharge pressure gauges, motor amperage from the VFD or motor control center, and basic flow meters. The gaps are usually vibration sensors (typically $200–$600 per point) and suction pressure transducers. A phased rollout starting with existing instruments can begin within two weeks.
What is the most common pump failure monitoring catches early?
Wear ring degradation is the most frequently caught issue — it shows up as a 5–8% flow drop and a corresponding head decline weeks before any visible symptom. Vibration monitoring catches bearing and alignment issues 2–4 weeks before failure, while seal temperature trending predicts seal face failure up to a month in advance.
How does CMMS integration work with pump curves?
OEM pump curves are digitized and stored as reference baselines in the CMMS. Live sensor data (flow, head, amperage) is plotted against the curve in real time. When operating point deviates beyond configured thresholds for a sustained period, the CMMS auto-generates a work order tied to a specific inspection or repair procedure. Schedule a walkthrough via Book a Demo to see the integration live.
What alert thresholds should we start with?
Begin conservative: 5% flow deviation sustained 24 hours, 3% head deviation, vibration at 4.5 mm/s RMS (ISO 10816 caution zone), and efficiency drop of 3 points. Tighten thresholds after 30 days of baseline data to reduce false positives while ensuring genuine deviations are never missed. Most plants settle on 4–6 active alert rules per pump category.
Baseline every pump in your plant within 48 hours
Import OEM curves, connect existing sensors, and start receiving deviation alerts before the next efficiency drift costs you a dime.
Free 14-day trial · No credit card