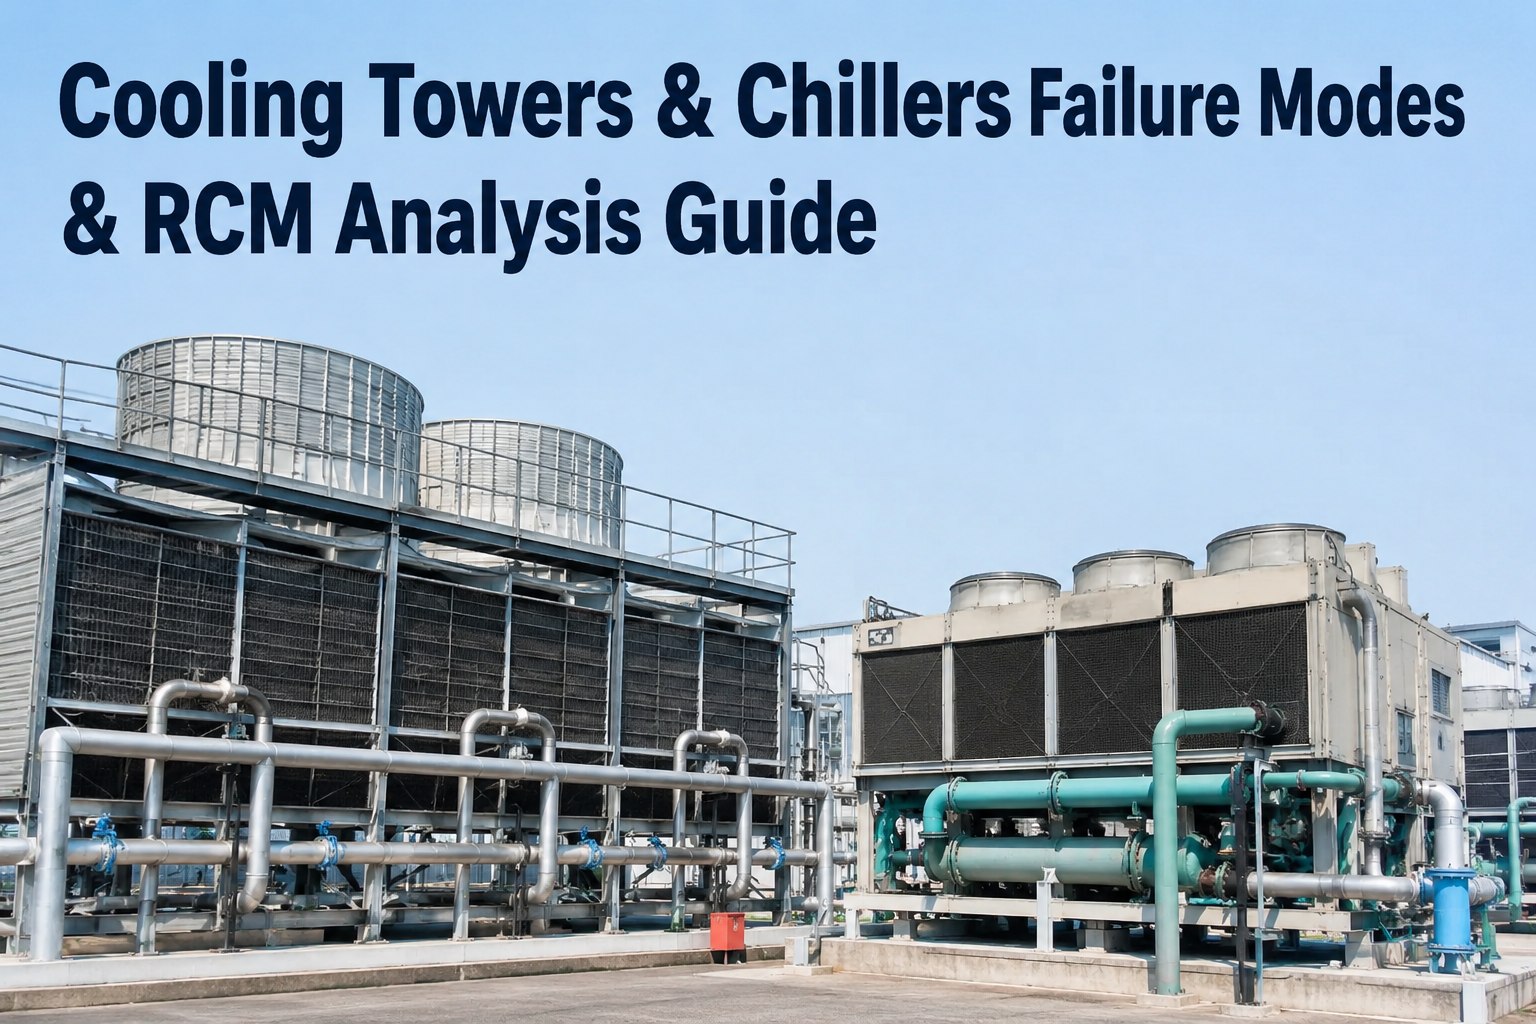
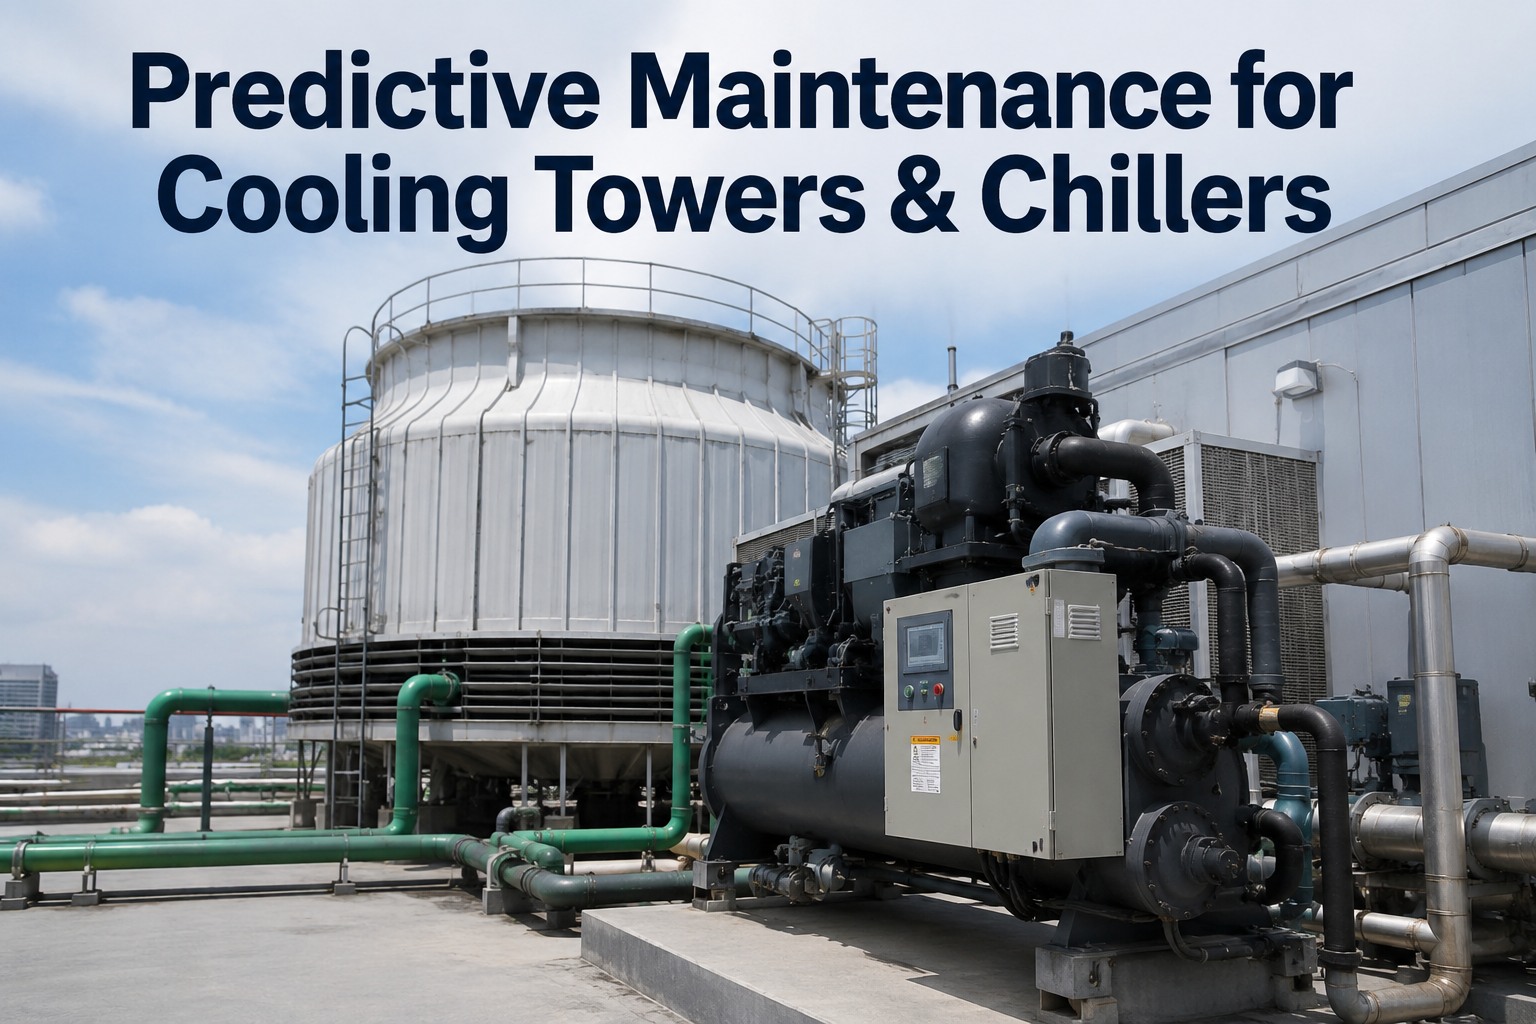
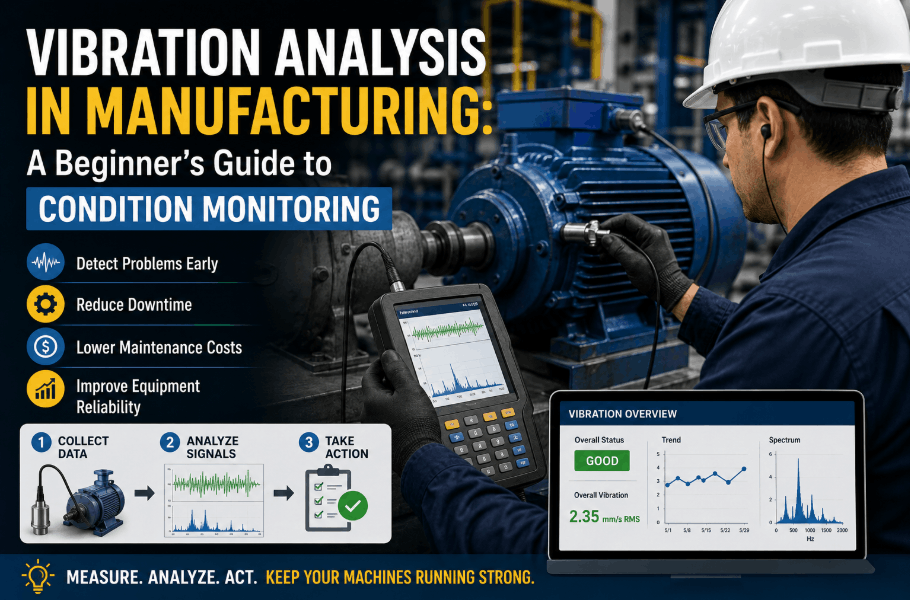
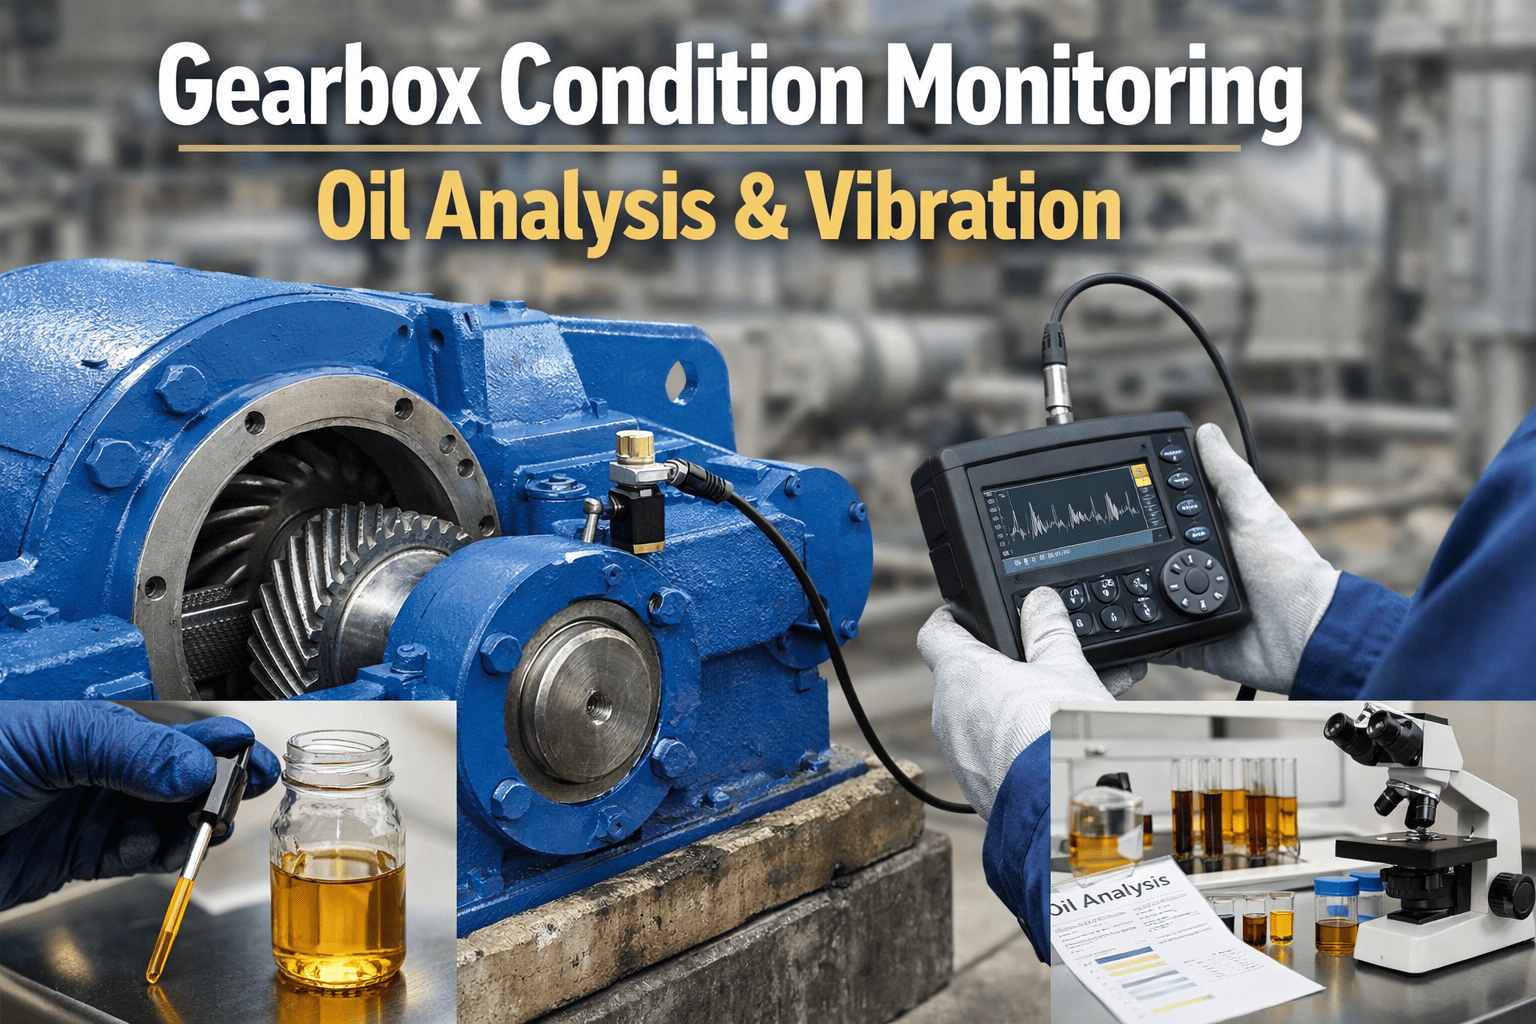
A 500-ton centrifugal chiller costs $200K-$500K installed, carries a 16-26 week replacement lead time, and consumes 40-60% of a commercial building's total energy — yet most facilities still run it on quarterly manual inspections and wait for the compressor amp draw to trip an alarm before anyone looks at it. AI condition monitoring changes that timeline entirely. Vibration signatures reveal bearing degradation 4-8 weeks before failure, refrigerant subcooling drift shows charge loss below 5% of nameplate, and approach temperature trending catches condenser fouling weeks before the utility bill spikes. Every 1°C of approach temperature drift adds 3-5% to chiller energy consumption — and that's before you count the compressor stress from running hotter head pressures. This guide covers AI condition monitoring for cooling towers and chillers the way it actually deploys in the field: the 15-25 critical parameters, the sensor placement map, the P-F interval that turns raw signals into work orders, and how OxMaint CMMS converts multivariate telemetry into scheduled maintenance action. Start free or book a demo to see AI-driven chiller and cooling tower monitoring live.
HVAC · AI Monitoring · Chillers & Cooling Towers · CMMS 2026
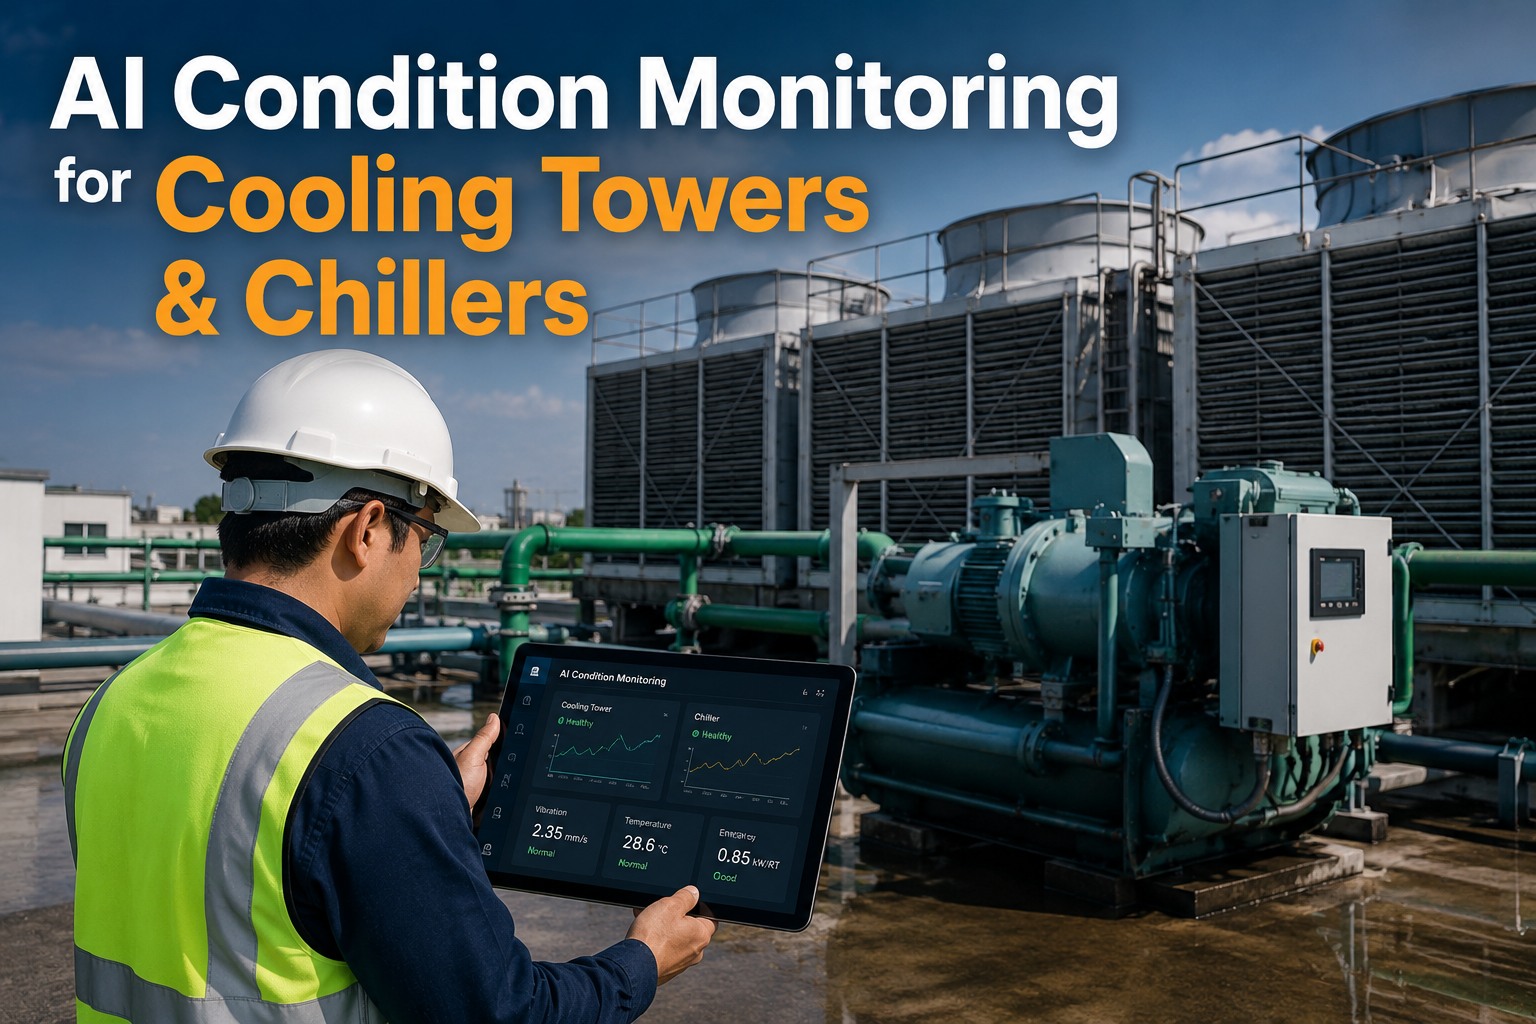
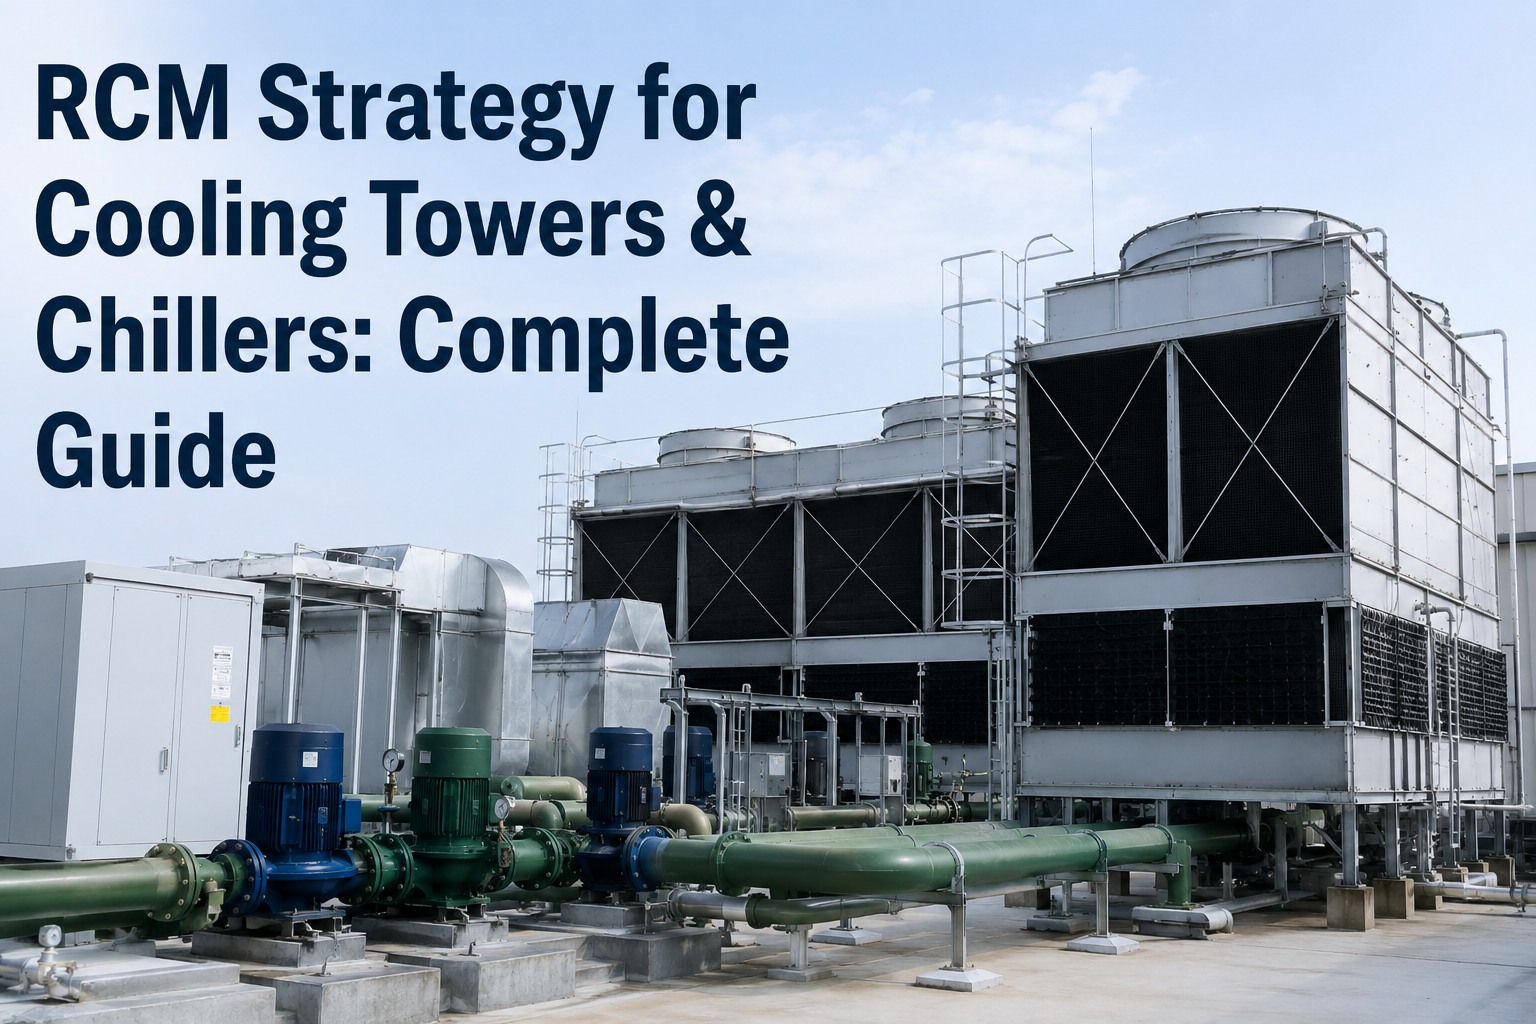
AI Condition Monitoring for Cooling Towers & Chillers
AI condition monitoring for cooling towers & chillers: vibration, temperature, current signals turned into work orders. Detect failures 3-8 weeks early with sensor-driven, evidence-based maintenance workflow.
3-8 Weeks
Advance warning AI models provide before catastrophic failure
15-25
Critical operating parameters monitored per chiller
1°C = 3-5%
Energy penalty per °C of approach temperature drift
40-60%
Share of commercial building energy consumed by chillers
The Sensor Map — Where to Instrument a Chiller & Cooling Tower
AI models are only as good as the sensors feeding them, and most cooling systems are already 60-70% instrumented — the manufacturer's controller already reads suction, discharge, and refrigerant pressures. Adding vibration sensors on the compressor and cooling tower fan, plus approach temperature transmitters, closes the last critical gaps. Below is the sensor coverage that unlocks most of the AI monitoring value. Sign up free and OxMaint accepts sensor data from BAS streams, standalone wireless sensors, and manufacturer controllers alike — no rip-and-replace, no vendor lock-in, and the HVAC library ships with sensor-mapping templates for the most common chiller and cooling tower configurations.
CRITICAL SENSOR PLACEMENT · CHILLER + COOLING TOWER LOOP
01
Compressor Vibration (triaxial)
Mounted on compressor housing. Reveals bearing wear, rotor imbalance, impeller damage. 4-8 week lead time.
02
Compressor Motor Current (amp draw)
Existing controller signal. Current signature analysis detects winding degradation, load anomalies.
03
Suction & Discharge Pressure
Refrigerant circuit health — superheat/subcooling calc, low-charge detection at <5% loss.
04
Condenser Approach Temperature
Direct fouling indicator — refrigerant vs leaving water temp. Every 1°C rise = 3-5% energy penalty.
05
Evaporator Approach Temperature
Waterside fouling detection. Trends against ambient and load context for AI baseline.
06
Oil Pressure & Temperature
Lubrication system health. Differential pressure indicates filter loading + return-oil issues.
07
Cooling Tower Fan Vibration
Gearbox & driveshaft coupling wear. Unchecked fan vibration = $150K-$400K blade-throw event.
08
Basin Water Quality (cond/pH)
Biological growth, scaling, and corrosion risk. Predicts fill fouling and heat-rejection loss.
The P-F Interval — How AI Turns Signals Into Weeks of Warning
Every failure mode has a P-F interval — the window between the earliest detectable signal (Potential Failure) and the point where the equipment stops (Functional Failure). Traditional maintenance sees only the F. AI condition monitoring pulls the detection point back to the earliest P, giving you weeks — sometimes months — of planned intervention window instead of a 2 AM emergency call. Below is the P-F timeline for the major chiller failure modes. Book a 30-minute demo and an OxMaint HVAC specialist will walk the P-F intervals against your specific chiller fleet's failure history — you'll leave the call knowing which failure modes give you the most planning runway.
P
Potential Failure
← DETECTION WINDOW (3-8 WEEKS) →
F
Functional Failure
Compressor Bearing Wear
4-8 weeks
Vibration spectrum shift → bearing race defect signatures
Refrigerant Charge Loss
6-10 weeks
Superheat/subcooling drift <5% charge loss detected
Condenser Tube Fouling
4-12 weeks
Approach temperature trend against ambient baseline
Cooling Tower Fan Fault
3-6 weeks
Vibration + current signature multi-signal correlation
Oil System Degradation
2-4 weeks
Oil pressure differential rise → filter loading pattern
The 6 AI-Detected Failure Modes That Rarely Show Up on Manual Rounds
Manual quarterly rounds catch obvious problems — a puddle under the chiller, a fan making noise. What they miss are the subtle multi-variable patterns that AI is specifically built for. Below are six failure modes where AI dominates manual inspection. Sign up free and load your chiller and cooling tower fleet into OxMaint's AI monitoring engine in your first shift — the failure-mode taxonomy is pre-configured, so anomalies get classified into the right bucket the moment they surface.
01
Bearing Race Defects (inner/outer)
Vibration spectrum analysis identifies specific frequency signatures (BPFI, BPFO) invisible to overall vibration amplitude readings. 4-8 weeks lead time.
02
Sub-5% Refrigerant Leaks
Pressure differential trends and superheat/subcooling analysis reveal charge loss below thresholds that trigger any controller alarm. Prevents compressor damage.
03
Progressive Condenser Fouling
Approach temperature correlated with ambient and load conditions — AI separates fouling from seasonal variation, catching 10-30% heat-transfer loss weeks early.
04
Cooling Tower Driveshaft Coupling Wear
Loose or worn couplings escalate to catastrophic fan failure ($150K-$400K blade-throw events). Vibration + current signature catches at "loose" phase.
05
Basin Biological Growth & Fill Fouling
Water conductivity, pH, and fill differential pressure trends predict biofilm and scaling weeks before heat-rejection capacity drops.
06
kW/ton Efficiency Drift
Chiller running 20% above rated kW/ton is technically out of ASHRAE 90.1 compliance. Continuous efficiency monitoring catches drift before it becomes an audit issue.
A Signal Without a Work Order Is Just Noise on a Dashboard.
Most condition-monitoring programs stall at the alert. Sensors read, models detect, dashboards light up — and nothing happens because the finding doesn't become a scheduled work order with parts, priority, and technician assignment. OxMaint closes the loop the moment the AI threshold crosses: WO auto-generated, priority set by fault class, sensor trend and diagnostic context attached, technician dispatched with the right parts.
The Signal-to-Work-Order Pipeline — What Actually Happens
The value in AI condition monitoring isn't the AI — it's the workflow that converts a detected anomaly into a closed work order with verified savings. Every step in the pipeline below has to work for the program to pay back. Book a scoping call and an OxMaint HVAC engineer will map the pipeline stages against your specific BAS, controller, and CMMS setup — you'll leave with an integration architecture ready for a trial workspace.
1
Signal Ingestion
Sensors + BAS + controllers feed telemetry at millisecond intervals. Edge gateway does initial filtering; cloud gets condensed data.
→
2
Multivariate Analysis
ML model correlates vibration + pressure + temperature + current. Never trusts a single signal — cross-validation cuts false positives.
→
3
Fault Classification
Anomaly classified into specific failure mode (bearing wear, refrigerant loss, etc.) with confidence score and estimated time-to-failure.
→
4
WO Auto-Generation
OxMaint generates work order with priority, diagnostic context, sensor trends, and required parts pre-attached. Assigned to right technician.
→
5
Verified Close-Out
Technician executes, closes WO with pre/post readings. Model retrains on outcome — true positive, false positive, or root cause different.
Quarterly Manual Inspection vs. OxMaint AI Monitoring Loop
The gap between a quarterly inspection round and continuous AI monitoring isn't a small refinement — it's the difference between catching a bearing fault at 6 weeks out and finding the failed compressor at 2 AM. Here's what changes when the sensor stream feeds OxMaint. Start free — no credit card, unlimited users, and OxMaint's HVAC library ships with pre-configured chiller and cooling tower templates so day-one setup takes a shift, not a project.
Facilities that put AI monitoring on the top chiller and cooling tower assets typically see 15-25% reduction in unplanned downtime and 8-12% energy savings from optimized condenser cleaning schedules alone. Start your free forever workspace to connect your first chiller sensors this week, or book a demo to see a working AI monitoring loop from a live customer facility before you commit.
"
We operate a 6-chiller plant serving a 900,000 sqft campus. Our monitoring was quarterly Trane service visits plus whatever the plant operator noticed on rounds. Two years ago we lost a compressor unexpectedly on a 400-ton unit — $68K repair, 5 days of degraded cooling to critical space. We connected vibration sensors to OxMaint's AI monitoring on all six chillers and both cooling tower cells. Within the first 90 days it flagged a bearing race defect on Chiller #3 that our quarterly inspection had rated normal — the vibration spectrum told a different story. We swapped the bearing in a planned window; no downtime, no emergency premium. Year one caught two more early-stage faults, cut condenser cleaning cycles from calendar-based to approach-temperature-driven, and dropped chiller plant kWh about 9% just from cleaner tubes.
Chief Facilities Engineer · 900K sqft Corporate Campus · 6-Chiller Plant · North America
Frequently Asked Questions
How much lead time does AI monitoring actually give before failure?
3-8 weeks for most major chiller and cooling tower failure modes. Compressor bearing wear typically 4-8 weeks (vibration spectrum), refrigerant charge loss 6-10 weeks (superheat/subcooling drift), condenser tube fouling 4-12 weeks (approach temperature trending), cooling tower fan faults 3-6 weeks (vibration + current). The lead time depends on failure mode physics — AI extracts the earliest detectable signal, but the P-F interval is a property of the equipment, not the software.
Do I need to install new sensors or can I use my existing BAS?
Most facilities are already 60-70% instrumented — the manufacturer's chiller controller reads suction/discharge pressure, temperatures, and amp draw. Adding wireless vibration sensors on the compressor and cooling tower fan, plus approach temperature transmitters, closes the critical gaps. OxMaint accepts both standalone sensor feeds and BAS data streams.
Sign up free to map your existing sensor coverage.
What's the typical ROI for AI condition monitoring on chillers?
One avoided compressor emergency ($25K-$120K depending on size and refrigerant type) typically pays for a year of platform cost across a mid-size portfolio. Add 8-12% energy savings from optimized condenser cleaning and 15-25% reduction in unplanned downtime, and full ROI usually lands in 8-14 months. Larger central plants with critical uptime requirements often see payback inside the first prevented event.
Why does approach temperature matter so much?
Approach temperature (refrigerant temp minus leaving water temp) is the most direct fouling indicator on both condenser and evaporator. Every 1°C of approach drift adds 3-5% to chiller energy consumption, and by the time the utility bill shows the impact, mechanical stress on the compressor has already accumulated. Continuous approach temperature monitoring against ambient and load context is the single highest-value signal AI can extract.
Does OxMaint integrate with SAP PM, Maximo, or existing BMS?
Yes. OxMaint supports overlay with SAP PM and IBM Maximo — they remain source-of-truth for asset master and financial data while OxMaint runs the AI monitoring and mobile work-order execution layer. BAS integration via BACnet, Modbus, and industrial APIs. No PLC replacement, no CAPEX request.
Book a demo to see the SAP/Maximo overlay live.
Can OxMaint manage multi-site cooling tower and chiller portfolios?
Yes. One workspace can hold hundreds of chillers and cooling towers across dozens of sites, with fleet-wide health scoring that prioritizes maintenance resources against the highest-risk assets across the entire portfolio. Corporate reliability leaders get a single dashboard view; site engineers see only their equipment. Templates propagate consistently across similar equipment classes.
Is a credit card or CAPEX approval required to start?
No. OxMaint's free forever plan requires no credit card, no CAPEX request, and no consulting engagement — you can
sign up in under 2 minutes and start connecting your first chiller sensor streams the same shift. Chiller and cooling tower templates ship pre-built.
Every Vibration Trend, Every Temperature Drift, Every Amp Signature — Into a Work Order.
OxMaint turns continuous sensor telemetry into weeks of planning runway — no more 2 AM chiller emergencies, no more surprise compressor rebuilds, no more fan blades through the tower casing. Start free — no credit card, unlimited users, forever. Or book a demo for a fleet-specific AI monitoring walkthrough.