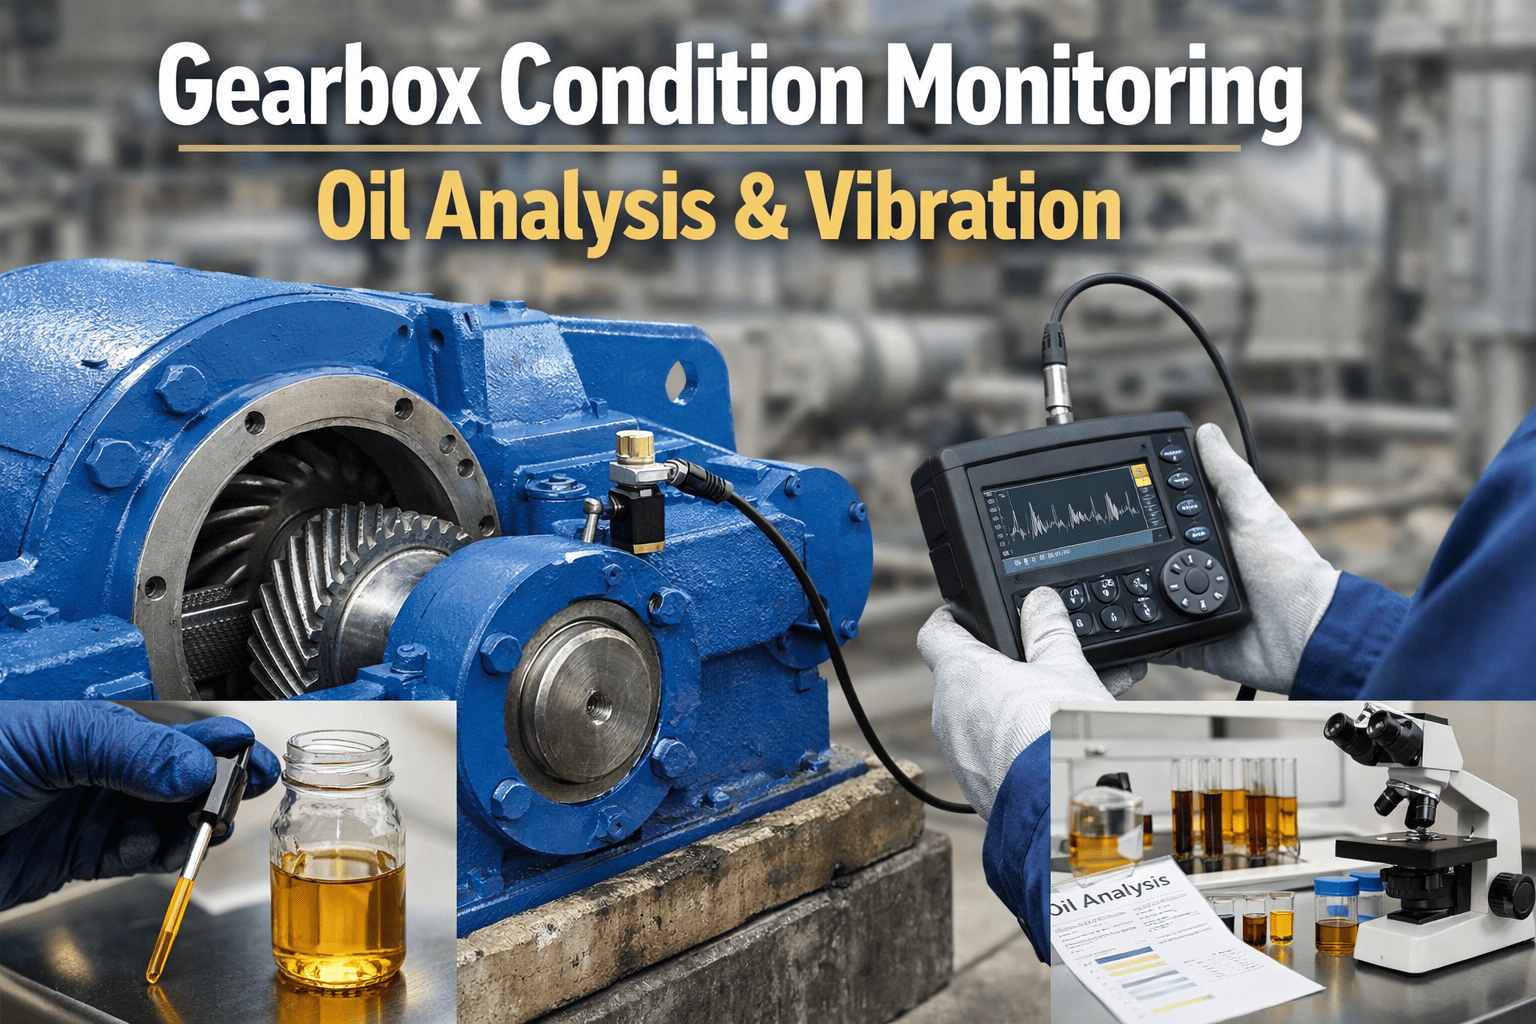
Industrial gearboxes are the torque backbone of manufacturing — transmitting power across crushers, conveyors, mixers, extruders, and mills with no tolerance for unexpected downtime. Gearbox condition monitoring using oil analysis combined with vibration monitoring gives maintenance teams a complete picture of internal gear wear, bearing degradation, and lubrication breakdown — typically 3–10 weeks before failure — at a fraction of reactive repair cost. This guide covers what to monitor, how to interpret the signals, and how to act on early warnings before damage cascades.
60%
of gearbox failures are preceded by detectable oil or vibration anomalies
$50K–$300K
typical cost of unplanned gearbox failure including production loss
3–10 wks
advance warning window with combined oil and vibration monitoring
4–6×
ROI difference between predictive vs reactive gearbox repair
Why Gearboxes Fail: The Root Cause Map
Most gearbox failures don't begin with a dramatic event — they begin with invisible processes: metal-to-metal contact under marginal lubrication, micro-pitting on gear tooth flanks, or a bearing raceway defect that takes months to propagate. Understanding failure origin points is the foundation of effective monitoring strategy.
Wrong viscosity grade, contaminated oil, degraded additives, or insufficient film thickness under load. The most preventable failure category — directly readable through oil analysis.
Oil viscosity
Acid number
Water contamination
Gradual abrasive or adhesive wear on tooth flanks, often accelerated by overloading, misalignment, or contaminated lubricant. Produces characteristic gear mesh frequency harmonics in vibration spectrum.
Gear mesh freq.
Iron particle count
Debris morphology
Inner/outer race fatigue, rolling element spalling, or cage wear. Bearing defects generate distinct frequency signatures — BPFI, BPFO, BSF — that appear in vibration data weeks before audible symptoms.
BPFI / BPFO
Kurtosis
Chrome/steel particles
Shaft misalignment concentrates load on tooth edges and bearing sides. Process overload creates stress cycles beyond design limits. Both show as increased 2× running speed vibration and elevated wear metal rates.
2× speed harmonic
Wear metal rate
Load history
Oil Analysis: Reading Your Gearbox from the Inside
Oil is the most information-dense diagnostic medium available for gearbox condition assessment. A single oil sample — analyzed for wear metals, contamination, and fluid properties — reveals what is happening inside the gearbox with a precision no external sensor can match.
What Oil Analysis Reveals
Iron (Fe)
Gear tooth and bearing race wear — the primary wear indicator. Rising trend signals accelerating metal-to-metal contact.
Copper (Cu)
Bronze bushing or thrust washer wear. Sudden spike with no prior trend often indicates localized overloading.
Silicon (Si)
Dirt and abrasive contamination entering via damaged seals or breathers. Accelerates all wear mechanisms when present.
Viscosity @ 40°C/100°C
Lubricant film integrity. Viscosity drop below 15% of new-oil spec means insufficient film to protect tooth flanks under load.
Total Acid Number (TAN)
Additive depletion and oxidation level. TAN above 2× new-oil baseline indicates oil needs replacement regardless of visual appearance.
Water Content (%)
Water above 0.1% causes hydrogen embrittlement in bearing steel and drastically reduces oil film strength — early failure risk.
Particle Count (ISO 4406)
Cleanliness level across 4µm, 6µm, and 14µm particle sizes. Most gearboxes require ISO 16/14/11 or cleaner for rated bearing life.
Oil Analysis Alert Reference
| Parameter | Normal | Caution | Critical |
| Iron (ppm) |
< 100 |
100–200 |
> 200 |
| Copper (ppm) |
< 30 |
30–80 |
> 80 |
| Silicon (ppm) |
< 10 |
10–25 |
> 25 |
| Water (%) |
< 0.05 |
0.05–0.1 |
> 0.1 |
| Viscosity change |
< ±5% |
±5–15% |
> ±15% |
| TAN increase |
< 0.5 mg/g |
0.5–1.5 |
> 1.5 |
Reference values are for industrial mineral gear oils. Synthetic and EP gear oils may have different baseline ranges — always compare against your equipment's established baseline, not only generic limits.
Turn Oil and Vibration Alerts Into Maintenance Work Orders Automatically
Oxmaint connects gearbox condition monitoring data to your CMMS workflow — auto-creating work orders with asset history, failure context, and parts recommendations the moment thresholds are breached.
Vibration Monitoring: The Frequency Fingerprint of Gearbox Health
Every gearbox generates a unique vibration spectrum at healthy operating conditions. As components degrade, specific frequency components change in amplitude and pattern — providing a precise fault signature that identifies not just that something is wrong, but exactly what is failing.
Gear Mesh Frequency (GMF)
GMF = No. of Teeth × Shaft RPM / 60
The fundamental gear health indicator. Elevated GMF amplitude with sidebands at ±1× shaft speed indicates gear tooth wear or loading issues. Multiple harmonics (2×GMF, 3×GMF) appearing progressively signals advancing gear damage.
Early warning:
Sideband growth around 1×GMF
Advanced fault:
3×GMF + noise floor rise
Bearing Defect Frequencies
BPFO, BPFI, BSF, FTF
Each bearing defect type — outer race (BPFO), inner race (BPFI), ball spin (BSF), and cage (FTF) — generates a mathematically calculable frequency. Envelope analysis detects these defect frequencies even when overall vibration level appears normal.
Early warning:
BPFO/BPFI in envelope spectrum
Advanced fault:
Multiple harmonics + kurtosis spike
Running Speed Harmonics
1×, 2×, 3× shaft speed
1× running speed dominates when shaft imbalance or eccentricity is present. 2× running speed elevation indicates misalignment between input shaft and connected equipment. Both are correctable conditions if caught before bearing damage accumulates.
Imbalance:
High 1× with radial phase
Misalignment:
2× > 50% of 1× amplitude
High-Frequency Resonance
Kurtosis / Crest Factor / RMS
Statistical time-domain parameters capture impulsive energy from early bearing and gear defects that may not yet be visible in the frequency spectrum. Kurtosis above 4.0 and rising crest factor are reliable early-fault indicators in gearboxes operating under variable load.
Healthy range:
Kurtosis 2.5–3.5
Fault present:
Kurtosis > 4.0 and rising
Combined Monitoring Decision Matrix
Oil analysis and vibration monitoring each detect different failure mechanisms at different stages. Using them together closes the diagnostic gap — ensuring no failure mode goes undetected regardless of whether it originates as a lubrication issue or a mechanical defect.
| Failure Mode |
Oil Analysis Signal |
Vibration Signal |
Best Detection Method |
Typical Lead Time |
| Gear tooth wear |
Rising iron ppm + large wear particles |
GMF sideband growth |
Both (oil first) |
6–10 weeks |
| Bearing spalling |
Iron + chrome particles |
BPFO/BPFI harmonics, kurtosis |
Vibration (earlier) |
4–8 weeks |
| Oil degradation |
Viscosity shift, TAN rise, oxidation |
None (silent failure) |
Oil analysis only |
Months (gradual) |
| Contamination ingress |
Silicon spike, particle count rise |
Noise floor increase |
Oil analysis (faster) |
Detectable immediately |
| Shaft misalignment |
Wear rate increase, edge loading |
2× speed elevation |
Vibration (clearer) |
Weeks to months |
| Bronze bushing wear |
Copper spike |
1× speed change |
Oil analysis only |
3–6 weeks |
Gearbox Monitoring: How to Build Your Program
01
Criticality-Based Asset Ranking
Not every gearbox warrants the same monitoring investment. Rank assets by consequence of failure — production impact, safety risk, repair lead time, and redundancy. The top 20% of critical gearboxes typically justify continuous monitoring; the rest may use periodic oil sampling and monthly vibration routes.
02
Establish Healthy Baselines
Take your first oil sample and vibration readings during known-good operating conditions — after a fresh oil change and alignment verification. This baseline becomes the comparison reference for all future readings. Without it, every alert threshold is generic rather than asset-specific.
03
Set Sampling Frequency by Risk Level
Critical gearboxes: monthly oil analysis + continuous online vibration. Important gearboxes: quarterly oil analysis + monthly vibration routes. Standard gearboxes: semi-annual oil analysis + quarterly vibration. Increase frequency immediately after any abnormal reading to track trend rate.
04
Integrate Alerts Into CMMS Workflow
Condition data only delivers value when it triggers the right action at the right time. Connect monitoring alerts to your CMMS to auto-generate work orders with fault context — so the maintenance team sees what is wrong, not just a sensor value, and can plan parts, labor, and downtime window accordingly.
05
Track and Review Trend History
Single data points are rarely conclusive — trends are. A wear metal rate doubling over three consecutive samples is a clear action signal even if the absolute value remains below the alert limit. Build a review cadence where rising trends get escalated before they breach thresholds.
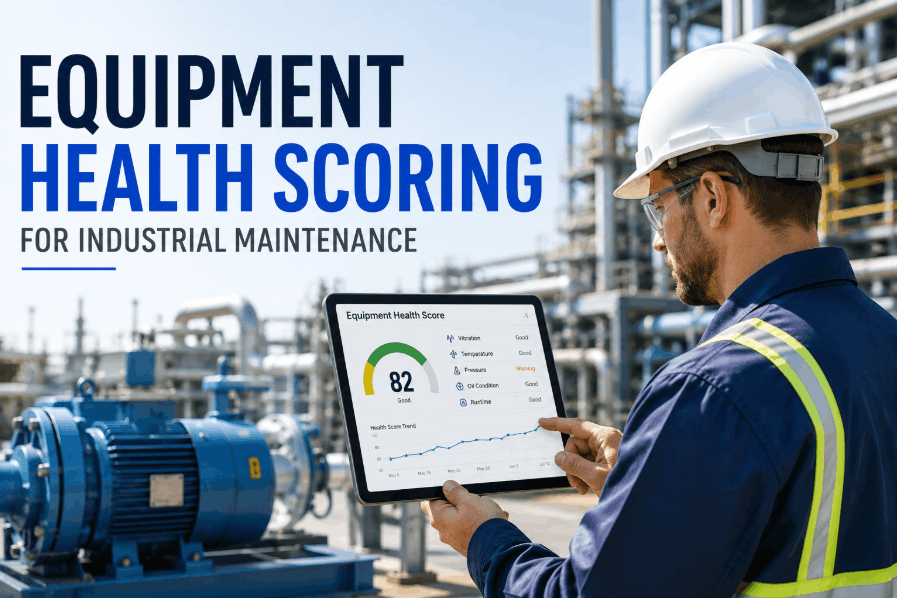
Ready to Track Every Gearbox Trend From One Dashboard?
Oxmaint gives your maintenance team gearbox asset health history, oil analysis trend tracking, and vibration alert integration — all in one platform built for industrial operations. No manual spreadsheets, no missed escalations.
Frequently Asked Questions
Your Gearboxes Are Running Right Now — Do You Know Their Condition?
Oxmaint gives your maintenance team full gearbox health visibility — oil analysis tracking, vibration alerts, automatic work order creation, and complete asset history — in one platform built for industrial maintenance operations.