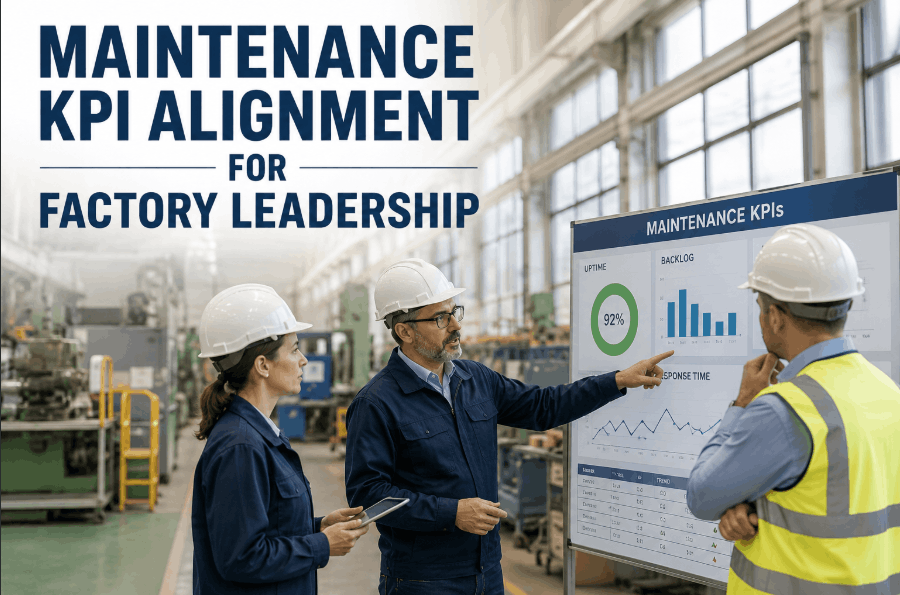
Factory leadership and maintenance managers often measure performance using completely different definitions of success. The plant director sees uptime percentages. The maintenance manager sees backlog hours. The reliability engineer sees MTBF trends. When these KPI definitions are misaligned, the same production floor generates three conflicting performance narratives — making strategic decisions slower, investment cases weaker, and accountability harder to establish. Oxmaint AI gives factory leadership a single, unified maintenance KPI framework that aligns uptime, backlog, response time, and work order data across every level of the organisation. Sign Up Free to start building the KPI alignment your leadership team needs to make faster, better-informed maintenance decisions.
Give Factory Leadership One Version of Maintenance Performance Truth
Oxmaint AI unifies maintenance KPIs across uptime, backlog, and response time — giving every level of factory leadership the same performance data in real time. Most plants are live within 48 hours.
Why Maintenance KPI Misalignment Costs Factory Leadership Decision Speed
Gap #1
Conflicting Uptime Definitions
Operations defines uptime as planned production time minus stoppages. Maintenance defines it as asset availability. Leadership sees both numbers — and neither tells the complete story.
Gap #2
Backlog Without Context
A large work order backlog looks like underperformance from the boardroom — but maintenance teams know that a planned backlog represents healthy prioritisation, not neglect. Without KPI context, leadership draws the wrong conclusions.
Gap #3
Response Time Ambiguity
Response time means different things to different stakeholders — time to acknowledgement, time to technician dispatch, or time to asset return to service. Without a shared definition, the metric loses accountability.
Gap #4
No Shared Data Source
Leadership pulls performance data from ERP. Maintenance pulls from CMMS. Operations pulls from production systems. Three systems produce three different numbers for the same week.
Gap #5
KPI Reporting Lag
Monthly maintenance KPI reports reach leadership three weeks after the period ends. By the time misalignment is visible, the operating conditions that caused it have already changed.
Gap #6
Data Governance Failure
When KPI definitions are not standardised, each team adjusts methodology to show favourable results — creating data governance gaps that undermine both internal accountability and external reporting.
How Oxmaint AI Aligns Maintenance KPIs for Factory Leadership
01
Unified Data Capture
Oxmaint centralises work order data, asset records, inspection findings, and condition monitoring signals — creating a single maintenance data source that feeds all KPI calculations consistently.
→
02
KPI Definition Standardisation
Maintenance KPIs are defined and locked at the system level — uptime, backlog age, response time, MTBF, and OEE calculated from the same data set for every stakeholder audience.
→
03
Role-Based Dashboards
Factory leadership sees strategic KPI summaries. Maintenance managers see operational drill-downs. Technicians see their own task performance — all from the same underlying data.
→
04
Real-Time Reporting
KPI dashboards update continuously — giving leadership live maintenance performance visibility without waiting for weekly reports or manual data reconciliation across systems.
KPI Alignment Framework — What Oxmaint Tracks for Factory Leadership
Uptime & Availability
Asset availability rate per production line and shift
Unplanned downtime hours tracked by asset and cause
OEE calculation — availability, performance, and quality
Backlog & Workload
Work order backlog age and volume by priority tier
Planned vs reactive work order ratio over time
Technician capacity utilisation and workload balance
Response & Resolution
Mean time to respond — fault signal to WO acknowledgement
Mean time to repair — WO open to asset return to service
Emergency work order rate trend by month and asset class
Leadership Alignment Outcome
One KPI definition — consistent across all stakeholder levels
Real-time performance visibility — no monthly reporting lag
Strategic investment cases supported by unified data
40%
Reduction in unplanned downtime reported by plants with unified maintenance KPI tracking in Year 1
3.2×
Higher work order completion rate when KPI targets are visible to both leadership and maintenance teams
48hrs
Typical time from setup to first unified KPI dashboard available for factory leadership review
90days
Average time to measurable improvement in maintenance KPI alignment after Oxmaint deployment
Oxmaint AI vs Disconnected Systems for Factory Leadership KPI Alignment
Disconnected Systems — KPI Fragmentation
Leadership, maintenance, and operations each pull KPIs from different platforms
Uptime, backlog, and response time defined differently by each stakeholder group
Monthly KPI reports arrive weeks after the measurement period ends
Investment cases built on conflicting data — approval cycles delayed
No data governance standard — KPI methodology adjusted team by team
Maintenance performance narrative changes depending on who presents the data
Oxmaint AI — Unified KPI Alignment
All KPIs calculated from a single Oxmaint data source — consistent across every audience — Sign Up Free
KPI definitions standardised and locked at the system level — no methodology drift
Real-time KPI dashboards — leadership sees current performance without reporting lag
Role-based views — strategic summary for leadership, operational detail for managers
Data governance enforced through required field capture and work order accuracy rules
One-click maintenance performance reports for leadership review and board presentations
The Six Maintenance KPIs Factory Leadership Should Track in Oxmaint
These six KPIs give factory leadership a complete, aligned picture of maintenance performance — and Oxmaint calculates all of them automatically from a single data source. Book a Demo to see your plant's live leadership KPI dashboard.
KPI 01
Overall Equipment Effectiveness (OEE)
The single most important leadership KPI — combining availability, performance, and quality into one production efficiency score that bridges maintenance and operations in a language the boardroom understands.
Production Impact
KPI 02
Planned vs Reactive Work Order Ratio
Measures whether maintenance is shifting from reactive to planned — the most direct indicator of whether predictive and preventive programs are working at a strategic level.
Strategic Shift
KPI 03
Mean Time Between Failures (MTBF)
Tracks whether critical assets are failing less frequently over time. Rising MTBF across the asset register is the clearest evidence that maintenance investment is delivering reliability improvement.
Asset Reliability
KPI 04
Maintenance Cost per Unit Produced
Connects maintenance spend to production output — giving leadership the financial efficiency metric needed to benchmark performance and justify maintenance investment decisions.
Cost Efficiency
KPI 05
Emergency Work Order Rate
Monthly count of breakdown work orders across the facility. A sustained decline is the most financially significant KPI for leadership — emergency repairs cost 3–5× planned interventions.
Cost Reduction
KPI 06
Work Order Backlog Age
Measures how long open work orders have been waiting for action — segmented by priority. Aging backlog in high-criticality tiers is an early warning signal for leadership before it becomes an unplanned failure.
Risk Visibility
Industries Using Oxmaint AI for Factory Leadership KPI Alignment
Process Manufacturing
Unified KPIs Across Continuous Production Lines
Chemicals and refining plants use Oxmaint to align maintenance KPIs across compressors, reactors, and heat exchangers — giving plant directors and maintenance managers the same performance view without manual data reconciliation across ERP and CMMS systems. Sign Up Free for your process facility.
Food & Beverage
Leadership Visibility Across Multi-Line Facilities
F&B manufacturers with multiple production lines use Oxmaint to give factory leadership a single OEE and downtime dashboard — breaking the dependency on weekly plant manager reports to understand whether maintenance performance is improving or declining. Book a Demo for your facility.
Power & Utilities
Reliability KPIs for Board-Level Reporting
Power generation operators use Oxmaint to produce maintenance KPI reports for board and regulatory audiences — with consistent MTBF, availability, and emergency WO rate metrics calculated from a single system of record for every reporting period.
Oil & Gas
Multi-Site KPI Alignment for Operations Leadership
Upstream and midstream operations use Oxmaint to align maintenance KPIs across multiple well sites and pipeline segments — giving operations leadership a consistent performance view that does not require manual consolidation from site-level spreadsheet reports.
Your Factory Already Has the Maintenance Data. Oxmaint Aligns It for Leadership.
Connect Oxmaint to your maintenance operations and give factory leadership a unified KPI view across uptime, backlog, and response time — in real time. Book a Demo to see the KPI alignment workflow live with your asset types.
Frequently Asked Questions
What maintenance KPIs should factory leadership track?
The most important leadership KPIs are OEE, planned-to-reactive work order ratio, MTBF, emergency WO rate, maintenance cost per unit, and backlog age by criticality tier — all of which Oxmaint calculates automatically.
How does Oxmaint solve the problem of different teams reporting different KPIs?
Oxmaint standardises KPI definitions and calculates all metrics from a single data source — eliminating the methodology drift that occurs when teams calculate independently from disconnected systems.
Can Oxmaint provide role-specific KPI views for different levels of factory leadership?
Yes. Oxmaint delivers strategic KPI summaries for plant directors, operational drill-downs for maintenance managers, and task-level performance data for technicians — all from the same underlying dataset.
How quickly can Oxmaint deliver a unified maintenance KPI dashboard?
Most facilities have a live KPI dashboard within 48 hours of connecting Oxmaint to their asset register and work order data. Historical data imports allow baseline benchmarking from the first day.
Can Oxmaint KPI reports be used for board or regulatory reporting?
Yes. Oxmaint generates one-click maintenance performance reports with consistent KPI methodology — suitable for board presentations, regulatory compliance reviews, and insurance reporting requirements.
Stop Presenting Three Different Maintenance Performance Stories to Leadership.
Oxmaint AI unifies maintenance KPIs across every level of factory leadership — real-time, consistent, and built from a single system of record. Sign Up Free and give your leadership team the maintenance visibility they need today.