Every dollar a plant manager wastes on unnecessary maintenance is a dollar that cannot fund capital improvements, workforce development, or competitive pricing. Yet cutting maintenance costs carelessly is how facilities slip from managed reliability into reactive chaos — the most expensive operational posture a plant can occupy. The real goal is not lower maintenance spend; it is better maintenance spend. Sign Up Free to connect Oxmaint's CMMS to your asset register and begin benchmarking your maintenance cost per unit of output today. From PM rationalization to contractor utilization tracking, a structured cost-optimization program built on accurate data routinely delivers 20–35% maintenance budget reduction while improving — not eroding — asset reliability. Book a Demo to see how plant managers use Oxmaint's financial dashboards to identify waste, justify budget decisions, and defend reliability investments to plant leadership. Whether you are managing a greenfield facility or optimizing a mature maintenance operation, this guide covers cost benchmarking, PM rationalization, contractor governance, and CMMS-driven ROI measurement for 2026.
MAINTENANCE COST REDUCTION · PLANT MANAGER GUIDE · CMMS ROI
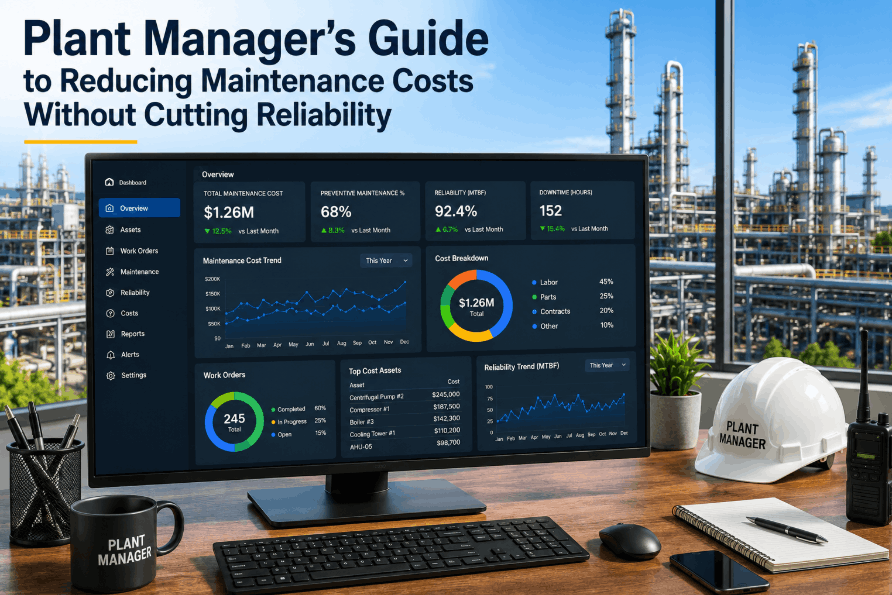
Cut Maintenance Costs Without Sacrificing Reliability — Powered by Oxmaint
Real-time cost tracking, PM rationalization tools, contractor utilization reporting, and maintenance OPEX dashboards — built for plant managers who answer to the bottom line.
Why Maintenance Costs Spiral Out of Control in Manufacturing Plants
Most maintenance budget overruns trace back to a single structural problem: spending decisions made without visibility into what maintenance actually costs per asset, per trade, or per unit of production. Without this data, every budget conversation becomes a negotiation between gut instinct and historical invoices — neither of which provides the granular insight needed to cut intelligently. Book a Demo to see how Oxmaint's cost-per-work-order reporting gives plant managers the data foundation for every cost optimization decision.
ROOT CAUSES OF MAINTENANCE BUDGET OVERRUNS
01
No Cost-Per-Asset Visibility
Without per-asset maintenance cost tracking, high-cost outliers absorb disproportionate budget while contributing minimal production value — invisible until a financial audit.
02
Over-Maintained Low-Criticality Assets
Calendar-based PM schedules applied uniformly across all assets burn labor and parts budget on equipment where the failure consequence is low and replacement is cheaper than prevention.
03
Uncontrolled Contractor Spend
Without utilization benchmarks and approval workflows, contractor and third-party maintenance invoices expand silently — often comprising 30–40% of total maintenance OPEX without proportional value delivery.
04
Reactive Work Dominance
Plants spending more than 40% of maintenance labor on reactive breakdown repairs pay a 3–5x cost premium compared to planned maintenance for the same work scope.
05
Parts Inventory Waste
Overstocked spare parts tied to PM intervals that no longer reflect actual asset condition create capital lockup and obsolescence write-offs that rarely appear in maintenance budget reviews.
06
No Baseline for Benchmarking
Without a documented cost-per-unit or maintenance-spend-as-a-percentage-of-RAV baseline, plant managers cannot quantify improvement, justify program changes, or defend budget requests to finance.
Maintenance Cost Benchmarking: Where Does Your Plant Stand?
Benchmarking maintenance spend against industry standards is the first step in any cost reduction program. Without a reference point, it is impossible to determine whether your budget is bloated, appropriate, or — in some cases — dangerously underfunded in critical areas. The table below provides the standard industry benchmarks plant managers use to evaluate their maintenance cost posture. Sign Up Free to configure Oxmaint's maintenance cost tracking against these benchmarks for your facility's asset base.
MAINTENANCE COST BENCHMARKING REFERENCE — MANUFACTURING PLANTS
Maintenance as % of RAV
1.5–2.5%
3–5%
> 6%
Asset cost vs WO cost reporting
Reactive vs Planned Ratio
< 20% reactive
30–45% reactive
> 55% reactive
Work order type analytics
PM Compliance Rate
> 95%
75–88%
< 65%
Scheduled WO completion tracking
Contractor Spend as % of Maintenance Budget
< 20%
25–35%
> 45%
Contractor cost allocation
Stores & Spare Parts Turnover
> 2.0 turns/year
1.0–1.5 turns/year
< 0.8 turns/year
Parts usage vs inventory reports
PM Rationalization: The Fastest Path to Maintenance Cost Reduction
PM rationalization — the systematic review and right-sizing of preventive maintenance task lists — consistently delivers the fastest and largest single-year maintenance budget reductions available to a plant manager. Most facilities carry PM schedules built incrementally over years, with intervals set conservatively and tasks duplicated across trades. A structured rationalization exercise driven by failure history data typically eliminates 25–40% of PM tasks as unnecessary without any measurable change in asset reliability. Book a Demo to see how Oxmaint's work order history and asset failure data support evidence-based PM interval optimization.
PM RATIONALIZATION PROCESS — 4-STEP FRAMEWORK
Step 1
Export Full PM Task List with Frequency and Cost
Pull every scheduled PM from Oxmaint with its interval, labor hours, parts consumed, and trailing 24-month completion history. This is the working dataset for rationalization decisions.
Step 2
Score Each PM by Failure Consequence and Interval Justification
For each task, ask: has skipping this PM ever led to a documented failure? Is the interval based on OEM data, failure history, or habit? Unsubstantiated intervals on low-criticality assets are prime candidates for extension or elimination.
Step 3
Apply Criticality Tiers to Reset PM Intervals
Assign Tier 1 (high criticality) assets standard or compressed intervals. Extend Tier 2 (medium) intervals by 25–50%. Eliminate or convert Tier 3 (low criticality) PMs to run-to-failure or condition-based triggers in Oxmaint.
Step 4
Monitor Failure Rates for 90 Days Post-Rationalization
Use Oxmaint's work order analytics to confirm that rationalized assets show no degradation in failure frequency. Adjust intervals where data signals over-rationalization and document savings achieved.
Contractor Cost Management: Controlling Your Largest Variable Maintenance Expense
For most manufacturing facilities, third-party contractor and specialty maintenance services represent the single largest and least controlled segment of maintenance OPEX. Unlike internal labor — governed by headcount, shift structure, and union agreements — contractor spend can expand rapidly without formal governance. The table below outlines the five contractor cost controls that deliver measurable budget impact within a single fiscal year. Sign Up Free and begin tracking contractor work orders against approved budgets inside Oxmaint's cost management module.
CONTRACTOR COST CONTROL FRAMEWORK
01
Approved Scope Before Dispatch
Every contractor work order requires a defined scope, labor hour estimate, and parts budget before dispatch. Oxmaint's approval workflow prevents open-ended contractor engagements that expand on-site.
02
Rate Card Standardization
Negotiate and document fixed rate cards for your top 5–8 contractor trades. Link rate cards to Oxmaint's vendor records so cost estimates auto-populate on contractor work order creation.
03
Utilization Benchmarks by Trade
Set annual utilization targets per contractor trade. Track actual spend vs target monthly in Oxmaint's reporting dashboard. Variances above 15% trigger a review before the next work order is approved.
04
In-House Capability Gap Analysis
Identify recurring contractor task categories where internal technician training would reduce long-term cost. High-frequency contractor tasks are candidates for skills internalization in future workforce planning.
05
Post-Job Cost vs Estimate Reconciliation
Close every contractor work order in Oxmaint with actual cost recorded against the original estimate. Contractors with consistent cost overruns move to secondary vendor status in the next procurement cycle.
Maintenance Cost Reduction Strategies That Protect Reliability
Not all cost reduction strategies carry equal risk. The matrix below ranks the most effective maintenance cost reduction levers by their potential budget impact and their risk to asset reliability — giving plant managers a prioritized action plan that protects uptime while delivering financial results.
MAINTENANCE COST REDUCTION STRATEGIES — IMPACT VS RISK MATRIX
High Impact · Low Risk
PM Rationalization
Eliminate unsubstantiated PM tasks on low-criticality assets. Budget savings of 20–35% without reliability impact when driven by failure history data in Oxmaint.
High Impact · Low Risk
CMMS Work Order Analytics
Identify top 10% of assets consuming 40–50% of maintenance budget. Targeted cost reduction on high-cost outliers protects reliability elsewhere in the asset register.
High Impact · Medium Risk
Condition-Based PM Conversion
Convert calendar PM to sensor-triggered CBM on critical rotating assets. Reduces unnecessary maintenance labor while extending component life through data-driven service timing.
High Impact · Medium Risk
Contractor Spend Governance
Implement approval workflows and rate card controls for contractor work orders. Typical savings of 15–25% on contractor spend within two budget cycles when tracked in Oxmaint.
Medium Impact · Low Risk
Spare Parts Inventory Optimization
Reduce overstocked parts tied to eliminated PM tasks. Link parts consumption to work order history in Oxmaint to right-size min/max levels and free locked capital.
Medium Impact · Low Risk
Planned Work Scheduling Efficiency
Improve wrench time by grouping work orders by location and trade in Oxmaint's scheduling module. Reducing technician travel and setup time delivers 8–15% effective labor cost reduction.
How Oxmaint Helps Plant Managers Reduce Maintenance Costs
Oxmaint is the CMMS built for plant managers who need to answer two questions simultaneously: Are my assets reliable? And am I spending the maintenance budget effectively? Every feature in Oxmaint connects operational maintenance data to financial outcomes — giving plant managers the visibility to cut costs with confidence, not guesswork. Book a Demo to walk through Oxmaint's cost management capabilities with a reliability specialist who understands your industry's maintenance cost benchmarks.
HOW OXMAINT DRIVES MAINTENANCE COST REDUCTION
01
Cost-Per-Asset Reporting
Track cumulative maintenance spend per asset across labor, parts, and contractor costs. Identify outliers consuming disproportionate budget and flag repair-vs-replace decisions automatically.
02
PM Compliance and Interval Tracking
Monitor PM completion rates, labor hours per task, and interval adherence in real time. Underperforming or over-resourced PM tasks surface automatically in the CMMS dashboard.
03
Work Order Cost Capture
Every work order in Oxmaint captures actual labor hours, parts consumed, and contractor charges. This builds the financial dataset needed for PM rationalization and contractor spend benchmarking.
04
Reactive vs Planned Work Ratio Dashboard
Monitor your facility's reactive-to-planned maintenance ratio in real time. Shifting this ratio from reactive-heavy toward planned work is the fastest path to structural maintenance cost reduction.
05
Contractor Work Order Approval Workflow
Require scope and cost approval before any contractor work order is dispatched. Track contractor spend against approved budgets by vendor, trade, and asset with automated variance alerts.
06
Maintenance OPEX Reporting for Leadership
Generate monthly and quarterly maintenance cost reports aligned to plant leadership's financial reporting format — showing savings achieved, cost trends, and ROI on maintenance program investments.
Measuring Maintenance Cost Reduction ROI: KPIs for Plant Managers
A maintenance cost reduction program without a measurement framework produces one-time savings that erode without accountability. The KPIs below are the standard financial metrics plant managers use to track progress, communicate results to leadership, and sustain cost discipline across budget cycles. Sign Up Free to begin tracking all of these metrics automatically inside Oxmaint's financial reporting dashboard.
MAINTENANCE COST REDUCTION KPIs — PLANT MANAGER REFERENCE
Maintenance Cost per Unit
Total maintenance spend divided by units produced in period
20–30% reduction Year 1
Cost vs production output
Maintenance as % of RAV
Annual maintenance spend vs replacement asset value
Target: 1.5–2.5%
Asset register cost analysis
Emergency WO % of Total
Share of total work orders classified as reactive breakdown
Target: below 20%
Work order classification reports
PM Task Elimination Rate
Percentage of PM tasks removed or extended post-rationalization
25–40% in Year 1
PM schedule change audit log
Contractor Spend Variance
Actual contractor spend vs approved budget by trade
Target: within ±10%
Contractor cost allocation module
MAINTENANCE BUDGET OPTIMIZATION · PM RATIONALIZATION · CMMS COST TRACKING
Give Plant Managers the Financial Visibility to Cut Costs and Protect Uptime
Cost-per-asset reporting, PM rationalization data, contractor spend governance, and maintenance OPEX dashboards — all inside one CMMS designed for plant managers who answer to the bottom line.
Frequently Asked Questions
Q1 What is the fastest way to reduce maintenance costs without risking reliability?
PM rationalization delivers the fastest results — eliminating unsubstantiated PM tasks on low-criticality assets typically reduces maintenance labor spend by 20–35% within one budget cycle without measurable reliability impact when supported by failure history data.
Q2 What percentage of asset replacement value should maintenance spend represent?
World-class facilities target 1.5–2.5% of RAV annually. Industry average sits at 3–5%. Spend above 6% typically signals excessive reactive maintenance or uncontrolled contractor utilization requiring structural intervention.
Q3 How does a CMMS reduce maintenance costs in practice?
A CMMS like Oxmaint reduces costs by making every work order financially visible — tracking labor hours, parts, and contractor charges per asset. This data drives PM rationalization, contractor governance, and repair-vs-replace decisions that eliminate hidden budget waste.
Q4 How do I control contractor maintenance spend without sacrificing service quality?
Implement scope-and-cost approval workflows before dispatch, standardize rate cards by trade, and track actual vs budgeted contractor costs per work order. Facilities using these three controls in Oxmaint typically reduce contractor spend variance to within 10% of budget.
Q5 What is PM rationalization and how much can it save?
PM rationalization is the evidence-based review and right-sizing of preventive maintenance task lists using failure history data. Most plants eliminate 25–40% of PM tasks as unnecessary in a first-pass rationalization, with savings ranging from 15–30% of total PM program budget.
Q6 How long does it take to see measurable maintenance cost reduction after implementing Oxmaint?
Most plant managers see measurable cost reduction within 60–90 days of full Oxmaint deployment — driven by work order cost visibility, PM rationalization decisions, and contractor approval workflows that eliminate uncontrolled spend immediately.
Q7 Can Oxmaint generate maintenance cost reports for finance and plant leadership?
Yes. Oxmaint's reporting module generates maintenance OPEX summaries, cost-per-asset breakdowns, reactive vs planned ratios, and contractor spend analyses in formats aligned with plant leadership and finance team reporting requirements.
PLANT MANAGER GUIDE · MAINTENANCE COST REDUCTION · OXMAINT CMMS
Start Reducing Maintenance Costs Without Compromising Reliability — With Oxmaint
PM rationalization tools, contractor spend governance, cost-per-asset reporting, and maintenance OPEX dashboards — built for plant managers who need financial results and operational reliability simultaneously.