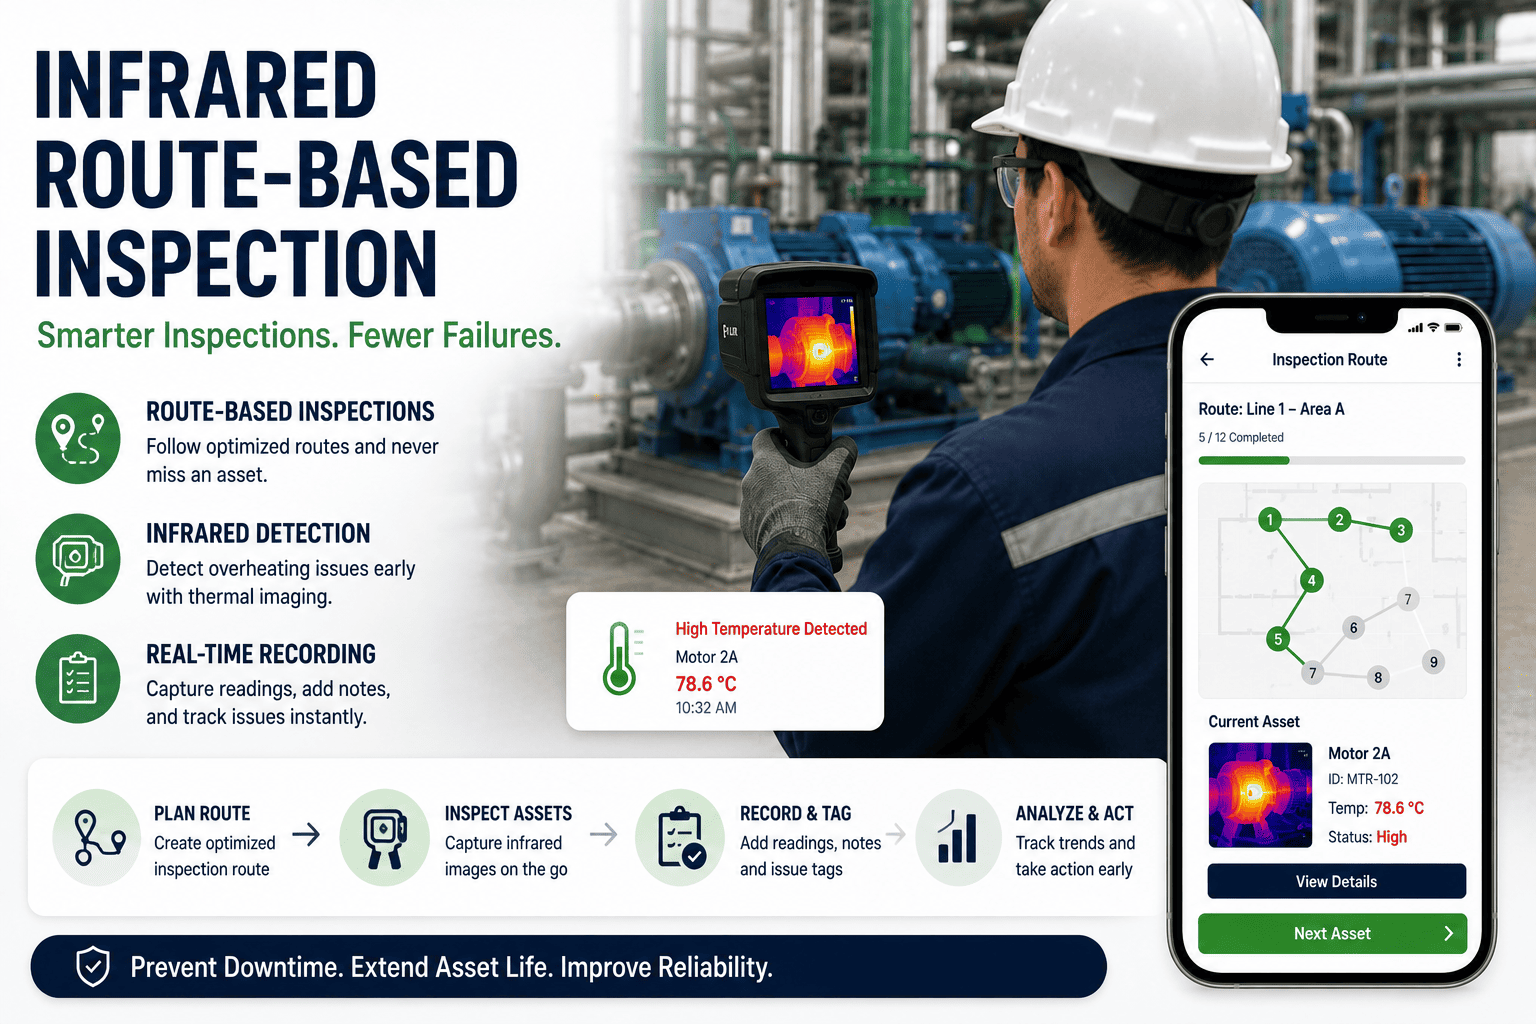
Route-based infrared inspection is the single highest-leverage predictive maintenance technique available to most manufacturing plants — a well-designed IR route catches roughly 80% of electrical and mechanical defects weeks before they escalate into unplanned downtime, often at a fraction of a cent per asset scanned. The discipline lies not in owning a thermal camera but in the consistency of the route: same sequence, same load conditions, same vantage points, same baseline comparisons, every cycle. When those conditions are met, even a mid-sized plant running 300–500 critical assets can shift from reactive firefighting to planned intervention, cutting unplanned electrical failures by 30–50% within the first year. This guide walks through the full architecture of a route-based thermography program — asset selection, route planning, baseline creation, severity grading, CMMS integration — so your team can operationalize it without trial and error. Ready to skip the setup learning curve? Start Free Trial and configure your first IR route today.
What if 80% of your electrical failures were visible weeks before they happened?
Route-based thermography turns a thermal camera into a predictive maintenance system — but only when the route is engineered for repeatability. Same assets, same load, same vantage points, same baseline. Every cycle.
Not every asset belongs on an IR route — here's the filter
A 400-asset plant typically narrows its first IR route to 120–180 critical assets. Over-inclusion dilutes focus; under-inclusion misses the faults that matter.
Electrical Distribution
- Service entrance & main breakers
- MCC buckets & contactors
- Transformers & bus connections
- VFDs & soft starters under load
Mechanical & Rotating
- Motors over 25 HP (coupling, bearings)
- Gear reducers & pillow-block bearings
- Pump seals & packing glands
- Conveyor drive & take-up stations
Process & Fluid Systems
- Steam traps & header insulation
- Heat exchangers & fin-fan bays
- Boiler refractory & casing
- Storage tank roof & shell seams
A 180-asset food processing plant spending $42K/yr on reactive electrical repairs narrowed its IR route to 94 critical assets across two MCC rooms, a boiler house, and three motor control centers. First scan found 11 thermal anomalies — 3 critical (loose main lugs on a 600A breaker), 5 serious, 3 monitor. The critical lugs were re-torqued during the next planned outage, averting an estimated $18K–$25K unplanned shutdown. Full program payback: under 90 days.
Engineer the route like a production line — sequence, load, and timing matter
A route is not a list of assets; it is a timed sequence of inspections performed under known operating conditions. Get any of these wrong and your baseline becomes meaningless.
Map & sequence by physical proximity
Group assets by location, not by type. A technician walking Room A → Room B → Room C finishes 40% faster than one bouncing between rooms by asset class. Sequence also matters: scan high-voltage gear first while load is stable, then mechanical, then process. Target 25–40 assets per route — beyond that, fatigue erodes image quality and anomaly detection drops sharply.
Lock in load conditions — and document them
A thermal image at 30% load is not comparable to one at 85% load. Each asset on the route must specify a minimum load threshold (typically >40% of rated) and the route is only valid if that threshold is met. Record the actual load, ambient temperature, and wind/airflow conditions at each capture point — these go into the image metadata and become the comparison context for every future scan.
Tag every vantage point physically
Thermal readings shift with angle and distance. Glue a numbered barcode or QR label at the exact spot the thermographer stands, and store the distance + emissivity setting against that tag. When a different technician runs the route next quarter, they reproduce the same geometry — and the baseline holds. This single discipline eliminates 60–70% of false-positive thermal drift between scans.
Set the cadence by risk and standard
NFPA 70B recommends annual IR on electrical systems, but most manufacturing plants benefit from quarterly routes on critical gear and semi-annual on the rest. Steam-trap routes run monthly during heating season. Mechanical routes align with oil-sampling intervals. The cadence is not a guess — it is driven by failure-mode development time, which for electrical loose-connection faults is typically 3–6 months from first detectable ΔT to catastrophic failure.
The baseline is the program — without it you are just taking pictures
A thermal image without a reference is an opinion. A thermal image compared to a known-good baseline under identical conditions is data. Build the baseline right and anomaly detection becomes mechanical.
Where Tfault is the temperature at the suspected anomaly and Tref is the temperature of a similar component under the same load on the same phase (or the component's own non-faulted side). A 10°C ΔT on an electrical connection is the threshold where most programs trigger a Severity-3 "serious" classification.
Even when absolute ΔT is low, a rising trend across 2–3 consecutive scans signals a developing fault. A connection that climbs from 2°C to 6°C to 11°C ΔT over three quarters is more urgent than a stable 15°C anomaly that has been present for two years — the trend predicts the failure trajectory.
A four-tier severity code turns thermal data into action priority
Every anomaly gets a grade the moment it is captured. The grade drives the CMMS work order priority, the due date, and the escalation path — no committee, no debate, no delay.
| Severity | ΔT over Reference | Recommended Action | CMMS Priority | Max Time to Repair |
|---|---|---|---|---|
| S1 · Monitor | < 5°C | Log to baseline, re-scan next cycle | Low — informational | Next scheduled route |
| S2 · Indicative | 5–15°C | Investigate root cause, tighten cadence | Medium | 30 days |
| S3 · Serious | 15–40°C | Schedule corrective work order, plan outage | High | 7 days |
| S4 · Critical | > 40°C | Immediate action, de-energize or isolate | Emergency | Same shift |
These thresholds align with industry guidance from NETA MTS-2019 and ASNT SNT-TC-1A Level I/II thermographer training. Adjust upward for high-ambient environments and downward for clean-room or vibration-sensitive equipment where even small ΔT shifts matter.
Close the loop — every anomaly becomes a tracked work order
The IR route is only valuable if findings flow into the CMMS automatically, get prioritized by severity, and close out with a repair verification scan. A thermal image sitting in a spreadsheet is a liability, not an asset.
Auto-generate work orders by severity
Each S2–S4 finding creates a CMMS work order tagged with asset ID, IR image, ΔT value, vantage point, and recommended action. Priority and due date are set by the severity code — no manual triage step. S4 critical findings trigger an emergency notification to the maintenance manager and operations lead simultaneously.
Attach the thermal image to the asset history
The image, the baseline image, and the ΔT overlay become part of the asset's permanent record in the CMMS. Next time that motor trips, the technician sees two years of thermal trend in one view — not a folder of disconnected files. This cuts diagnostic time on repeat failures by 50–70%.
Verify the repair with a post-fix scan
After the corrective work order closes, the next IR route — or a targeted verification scan within 48 hours — confirms the ΔT returned to baseline. If it did not, the work order reopens automatically. This closes the PdM loop and prevents the silent failure where a "repair" did not actually fix the root cause.
Track program KPIs monthly
Report four numbers every month: anomalies detected, anomalies repaired before failure, mean time from detection to repair, and estimated downtime cost avoided. A healthy program shows 85–95% of S3/S4 findings repaired before failure and a steady or declining anomaly count per route as chronic issues get engineered out.
Turn thermal data into closed work orders — not spreadsheets
Oxmaint connects your IR route findings directly to CMMS work orders, asset histories, and KPI dashboards. See it configured for your plant in 30 minutes.
Route-based IR inspection — the questions that come up first
How often should we run an IR route in a manufacturing plant?
Critical electrical distribution gear (main breakers, transformers, MCC main buckets) should be scanned quarterly. Semi-critical electrical and major mechanical assets typically run semi-annually. Steam-trap and process-energy routes run monthly during heating season. NFPA 70B sets annual as the minimum baseline for electrical — most plants exceed that because the failure-development window for loose connections is 3–6 months, and an annual cadence can miss the entire window.
Do we need a certified Level II thermographer on staff?
For program ownership, baseline creation, and severity adjudication — yes, ASNT SNT-TC-1A Level II is the industry standard. For routine route execution, a trained Level I technician following a documented procedure is sufficient, provided the Level II reviews flagged anomalies and signs off on severity grades. Many mid-sized plants share a Level II consultant quarterly and run Level I routes in between. Book a Demo to see how Oxmaint routes support both roles.
What emissivity settings should we use for electrical inspections?
Most bare metal electrical components (bus bars, breaker lugs, contact blades) have an emissivity of 0.15–0.30, which makes raw thermal readings unreliable. Best practice is to apply electrical tape (ε ≈ 0.95) or high-emissivity paint to a small reference patch on each inspection point during the baseline scan and use ε = 0.95 for all captures. This removes the emissivity variable from the delta calculation and makes scans directly comparable across technicians and seasons.
Can route-based IR replace vibration analysis for motors?
No — they are complementary, not substitutes. IR detects friction-generated heat from bearing wear, coupling misalignment, and lubrication starvation, but it lags vibration by weeks to months. Vibration catches the mechanical defect earlier; IR confirms the thermal consequence and helps prioritize which vibration flag is actually degrading the asset. Run both on motors over 50 HP and correlate the findings in the CMMS for the strongest predictive signal.
How long does it take to set up an IR route program from scratch?
A focused team can stand up a 150-asset IR route program in 4–6 weeks: week 1–2 for asset selection and criticality ranking, week 2–3 for route mapping and vantage-point tagging, week 3–4 for baseline scanning and emissivity correction, week 4–5 for CMMS integration and severity-coding setup, and week 5–6 for technician training and the first full route run. Oxmaint preloads route templates, severity logic, and CMMS work-order automation — Start Free Trial to compress that to days, not weeks.
Your first IR route could prevent the next unplanned outage
Configure asset routes, severity grading, and CMMS work-order automation in Oxmaint — then run your first baseline scan this week.
Free 14-day trial · No credit card