Plant leaders lose confidence in maintenance performance not because results are poor — but because the numbers mean different things to different people. Uptime calculated one way at one site reads 91%; calculated differently at another reads 96%. Neither team is wrong, but neither metric is comparable. Facilities using Sign Up Free with Oxmaint establish shared KPI definitions, unified dashboards, and consistent scoring logic across all sites — giving plant leaders a single performance language that drives real accountability. When maintenance backlogs, response times, and throughput rates are measured by the same standard, leaders can finally make cross-site comparisons that lead to action rather than debate. The result is faster goal-setting, cleaner trend reviews, and a maintenance culture aligned around metrics that actually reflect execution quality. Book a Demo to see how Oxmaint standardizes KPI governance across multi-site manufacturing operations.
KPI ALIGNMENT · PLANT METRICS · MAINTENANCE SCORECARD · DASHBOARD LOGIC · 2026
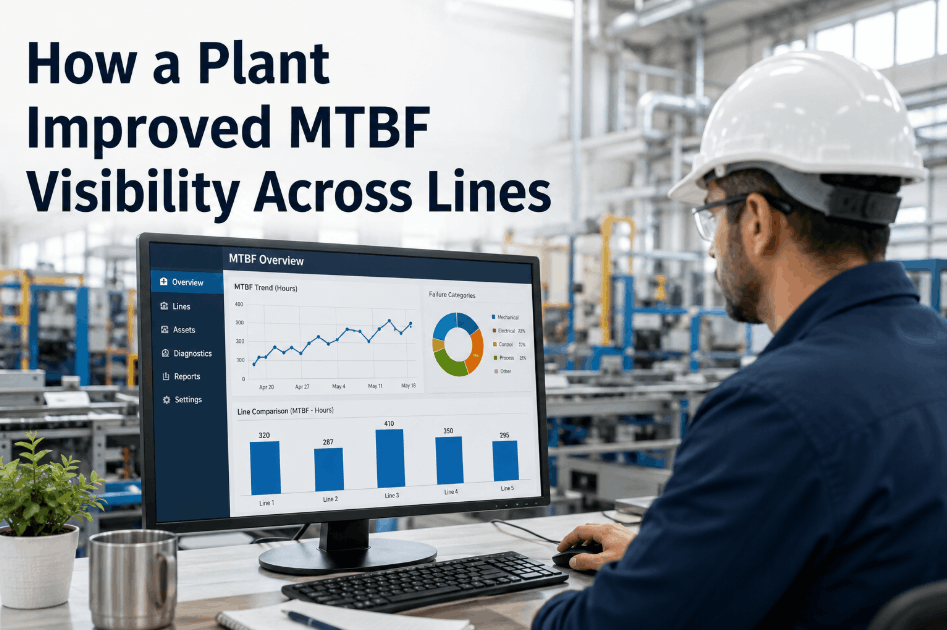
Maintenance KPI Alignment Guide for Plant Leaders
Standardize metric definitions, unify reporting logic, and build a plant-wide performance language that makes uptime, backlog, and response speed comparable across every site — with Oxmaint's CMMS as your single source of truth.
34%Average reduction in leadership review time when maintenance KPIs are standardized across sites
BacklogMost misaligned KPI across multi-site operations — requires a shared age-bucket definition to compare fairly
MTTRMean time to repair gains predictive value only when start and end timestamps are captured the same way everywhere
1 SourceSingle platform truth eliminates spreadsheet reconciliation and conflicting performance narratives at board level
The Hidden Cost of Misaligned Maintenance Metrics
Most multi-site manufacturers have maintenance data — they just cannot trust it. When each plant defines "planned maintenance compliance" or "response speed" slightly differently, leadership dashboards become exercises in negotiation rather than performance management. Sign Up Free to configure Oxmaint's KPI framework with consistent metric definitions, shared score thresholds, and cross-site reporting that gives every plant leader the same view. Oxmaint's work order engine captures the timestamps, completion states, and asset data needed to calculate any maintenance KPI — correctly and consistently — without manual spreadsheet assembly.
Definition Drift
Same KPI, Different Calculations
Site A counts only corrective work orders in its backlog. Site B includes all open PMs. Site C ages from creation date; Site D from scheduled date. Three sites, three backlogs — zero comparability. Oxmaint enforces a shared work order taxonomy that ensures every site's backlog, MTTR, and compliance figures are derived from identical calculation logic.
Reporting Friction
Manual Assembly Delays Performance Review
When KPI data lives in site-level spreadsheets, the monthly leadership review requires two days of data gathering before any analysis can begin. Oxmaint's real-time dashboards surface all KPIs — uptime, backlog age, PM compliance, mean response time — across every site simultaneously, so reviews start with data already on screen.
The 5 Maintenance KPIs That Matter Most to Plant Leaders
1
Planned Maintenance Compliance (PMC)
The percentage of scheduled PMs completed on time within the defined window. Oxmaint tracks PM completion against scheduled due dates and generates PMC reports per asset class, site, and technician — exposing where schedule adherence is breaking down and why.
2
Maintenance Backlog (Age-Bucketed)
Total open work orders segmented by age — 0–7 days, 8–30 days, 31–90 days, 90+ days. Age-bucketing reveals whether backlog is growing at the tail (chronic under-resourcing) or at the front (reactive surge). Oxmaint's backlog analytics show both volume and aging trend simultaneously.
3
Mean Time to Repair (MTTR)
Average elapsed time from fault detection to asset return to service. MTTR is the KPI most sensitive to timestamp discipline — Oxmaint captures fault reported, work order opened, technician dispatched, and work completed timestamps automatically, eliminating manual time logging errors.
4
Overall Equipment Effectiveness (OEE) Input Quality
Maintenance contributes to OEE through availability. Oxmaint tracks asset downtime by cause category — planned maintenance, unplanned breakdown, awaiting parts, awaiting technician — enabling OEE teams to attribute availability losses accurately and target the right intervention.
5
Reactive vs. Planned Work Ratio
The ratio of emergency/corrective work orders to total work orders is a leading indicator of maintenance program maturity. A target below 20% reactive is standard for high-performing sites.
Book a Demo to see Oxmaint's ratio trending across sites in real time.
KPI Definition Reference — Standardized for Multi-Site Plant Operations
| KPI |
Standard Definition |
Measurement Point |
Target Range |
Oxmaint Data Source |
| PM Compliance |
PMs completed within ±10% of scheduled interval |
Work order completion date vs. due date |
≥ 90% |
PM work order records |
| MTTR |
Fault reported → asset returned to production |
WO open timestamp to close timestamp |
Site-specific |
Work order timestamps |
| Backlog Volume |
Open WOs not yet completed at end of period |
Count + age bucket distribution |
≤ 2 weeks capacity |
Open WO report |
| Reactive Ratio |
Emergency + corrective ÷ total WOs |
WO type classification at creation |
≤ 20% |
WO type report |
| Response Speed |
WO created → technician first action |
WO open to first status change |
Priority-tiered |
WO status log |
| Parts Fill Rate |
WOs completed without parts delay ÷ total WOs |
Parts wait cause codes on WOs |
≥ 85% |
WO cause code data |
How Oxmaint Delivers KPI Governance Across Plant Operations
Oxmaint's CMMS is built to serve both site-level maintenance teams and plant leadership simultaneously. Technicians work through mobile work orders with structured data capture — timestamps, cause codes, parts used, asset condition. Leaders see real-time dashboards aggregating every site's performance against the same KPI definitions. Sign Up Free to connect your maintenance execution data to leadership-level KPI visibility without custom reporting development.
Unified KPI Dashboard
Single dashboard view of PMC, MTTR, backlog, and reactive ratio across all plants — with drill-down to site, asset class, or technician level.
Shared Metric Definitions
Work order taxonomy and type classification enforced at data entry — ensuring KPIs are calculated from identical inputs at every site.
Trend Review Automation
Scheduled KPI reports delivered to leadership automatically — monthly trend review packets generated without analyst preparation time.
Site Comparison Views
Rank sites by any KPI to surface outliers — both underperformers needing intervention and top sites with transferable practices.
Goal Setting Integration
Set KPI targets per site or asset class within Oxmaint — track actual vs. target in real time with gap alerts when performance drifts below threshold.
Score Consistency Audit
Oxmaint's work order validation rules prevent common data quality errors — missing timestamps, unclassified WO types — that corrupt KPI calculations.
One Platform. Every Plant. One Performance Language.
Oxmaint gives plant leaders a unified KPI framework — same definitions, same dashboards, same scoring logic — so performance comparisons drive decisions instead of debates.
Frequently Asked Questions — Maintenance KPI Alignment for Plant Leaders
Why do maintenance KPIs differ so much between sites in the same company?
Each site typically builds its own spreadsheet-based reporting over time. Without a shared platform enforcing common work order types and timestamps, even well-intentioned teams calculate the same KPI differently.
What is the most important maintenance KPI for plant leadership to track?
Reactive-to-planned work ratio is the single best indicator of maintenance program health. A ratio above 30% reactive signals systemic under-planning that will drive up costs and reduce asset availability over time.
Can Oxmaint support KPI governance across plants in different countries?
Yes. Oxmaint is designed for multi-site, multi-region operations with configurable site hierarchies, role-based access, and aggregated dashboards that work across time zones and plant types.
How quickly can a plant align its maintenance metrics using Oxmaint?
Most sites configure core KPI dashboards within the first two weeks of deployment. Oxmaint's guided setup maps existing work order categories to a standardized taxonomy without requiring a full historical data migration.
Does Oxmaint integrate with ERP systems for financial KPI alignment?
Oxmaint supports API-based integrations with major ERP platforms, enabling maintenance cost and labor KPIs to flow into financial reporting without duplicate data entry.
Align Maintenance KPIs. Unify Plant Performance. Drive Real Accountability.
Oxmaint's CMMS enforces shared metric definitions, automates KPI dashboards, and gives every plant leader the same performance language — so goal-setting, trend reviews, and site comparisons all start from the same truth.