When you run one plant, you can walk the floor. When you run six, you're flying blind on five of them. The maintenance manager at each site knows their own backlog, their own overdue PMs, their own bad actors — but the person accountable for all of it is stitching that picture together from six different spreadsheets, six phone calls, and a monthly report that's already stale. A central maintenance dashboard fixes that: one screen where every plant's reliability rolls up, and any site drifting into trouble surfaces before it becomes a call. This guide covers what that dashboard needs to show and how OXMAINT AI, the AI-powered CMMS, rolls every plant's work orders into one live view.
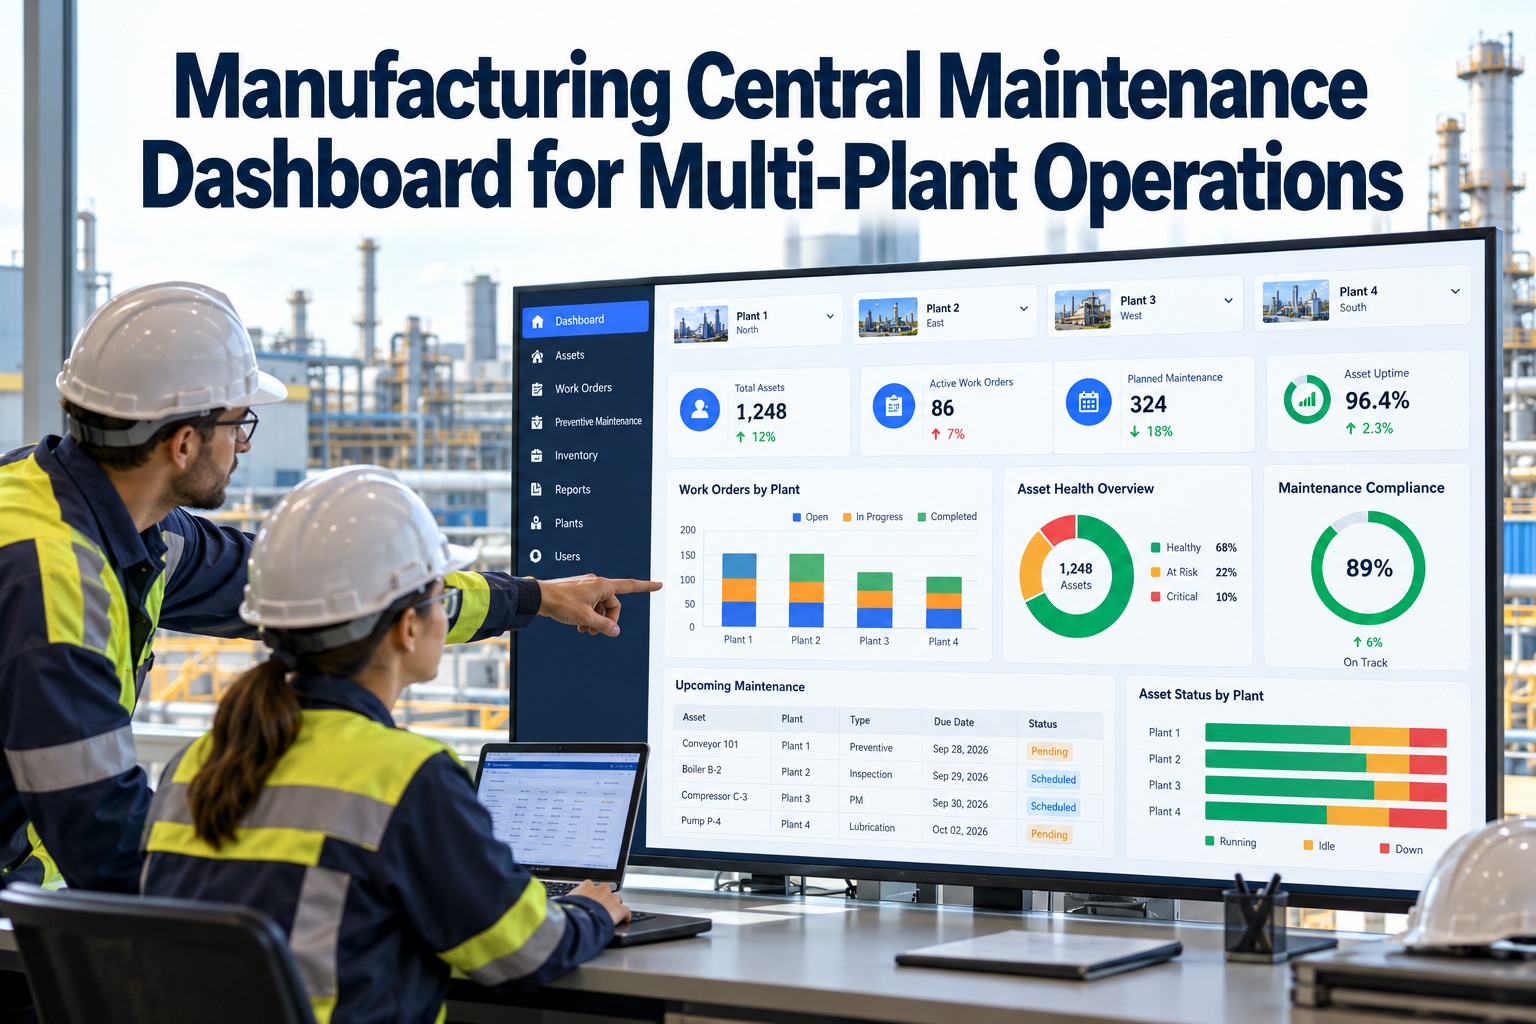
Manufacturing Central Maintenance Dashboard for Multi-Plant Operations
Every plant runs its own CMMS, its own reports, its own definitions — and the person over all of them can't compare like for like or spot the site that's slipping. OXMAINT AI rolls every plant's PM compliance, backlog, and downtime into one live dashboard, computed the same way everywhere, so you see the whole network at a glance and drill into any site the moment it drifts.
What a Central Dashboard Actually Looks Like
The point of a roll-up is instant read: green plants are fine, amber ones need a look, red ones need a call today. Below is the shape of it — network KPIs across the top, then every plant as a status tile you can drill into. Start free and build this for your network.
Why Multi-Plant Maintenance Goes Dark
Each site optimizes locally and reports upward in its own format, so the network view is always a manual reassembly — late, inconsistent, and impossible to compare. By the time a struggling plant shows up in a monthly report, the problem is weeks old. Start free and end the monthly reassembly.
- Each plant on its own system and spreadsheet
- Metrics defined differently site to site
- Network view rebuilt by hand each month
- A slipping plant surfaces weeks late
- No way to compare or share what works
- Every plant reporting into one live view
- Metrics computed the same way everywhere
- The network picture is always current
- Drift flags the moment a site slips
- Best-performing sites become the benchmark
The Metrics Every Plant Tile Should Carry
A tile is only useful if the numbers behind it mean the same thing at every site. These are the core metrics a central view rolls up — defined once, computed identically everywhere. Book a demo to set these for your network.
A Dashboard Is Only as Trustworthy as Its Definitions.
Roll up six plants that each define "compliance" differently and the dashboard compares nothing. OXMAINT AI computes every metric from the same work order data with one definition across all sites — so a red tile means the same thing everywhere, and you can trust the drill-down.
From Network View to a Single Asset
A dashboard that only shows totals leaves you guessing. The value is in the drill — a red tile that opens to the exact overdue PMs and bad-actor assets behind it. Book a demo to see the drill-down.
What OXMAINT AI Rolls Up
One system across every plant is what makes a true roll-up possible — not a monthly export merged by hand. Here's what OXMAINT AI puts on the central view. Start free and connect your plants.
Six Spreadsheets vs. One Dashboard
| What matters | Per-plant spreadsheets | OXMAINT AI |
|---|---|---|
| Network visibility | Rebuilt by hand monthly | Live, always current |
| Metric consistency | Defined differently per site | Computed the same everywhere |
| Spotting a slipping plant | Weeks late in a report | Flagged as it drifts |
| Backlog prioritization | Six separate lists | One ranked network list |
| Root-cause drill-down | Another round of calls | Network to asset in clicks |
| Sharing what works | Hard to compare sites | Best sites set the benchmark |
Frequently Asked Questions
See Every Plant on One Screen — Before It Becomes a Call.
Roll every site's PM compliance, backlog, and downtime into one live dashboard, computed the same way everywhere, and drill from the network straight to the asset — so no struggling plant stays hidden until it's a crisis.