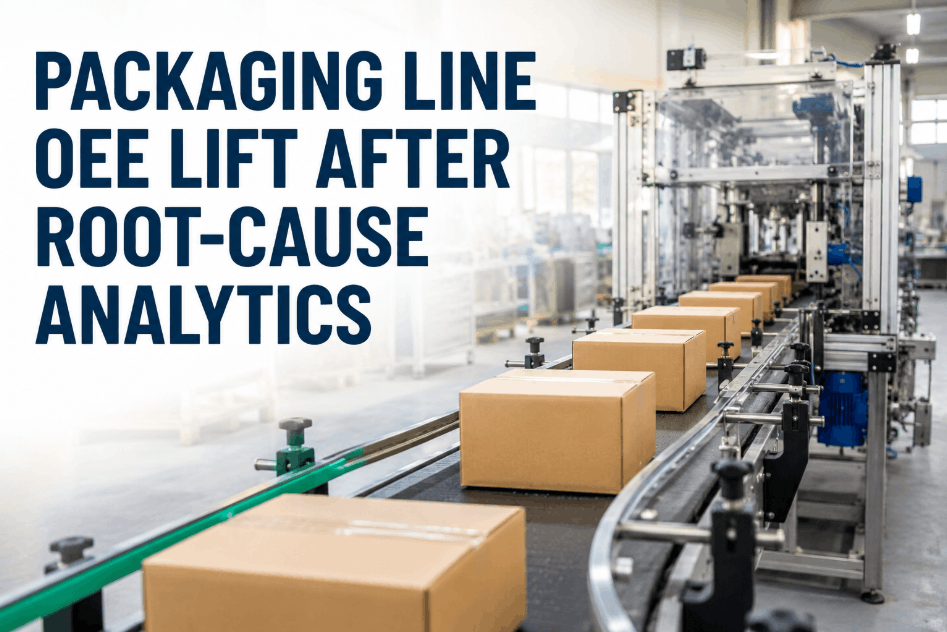
Overall Equipment Effectiveness gaps on packaging lines are rarely caused by a single visible failure — they accumulate from a combination of recurring micro-stoppages, unquantified changeover losses, and equipment performance drift that is too gradual to trigger an alarm but significant enough to erode throughput over weeks and months. A packaging operation running two high-speed lines found itself with a persistent OEE shortfall that conventional maintenance routines and operator reporting had not resolved. Changeover times were logged but not analyzed for variance. Sensor performance was assumed rather than verified. And the root causes behind the line's most frequent stoppages had never been systematically isolated — each event was treated as an isolated incident rather than a pattern signal. If your packaging operation is carrying OEE losses that recurring maintenance hasn't closed, Sign Up Free to see how Oxmaint structures root-cause analytics from production data to operational change — or Book a Demo with a production reliability specialist.
OEE Improvement · Root-Cause Analytics · Packaging Line Performance
Expose What Is Actually Costing Your Packaging Line OEE
Root-cause analytics, stoppage pattern analysis, changeover variance detection, sensor drift monitoring, and production data synthesis — Oxmaint helps packaging operations identify and eliminate the hidden losses driving OEE shortfall.
Line Profile
The Operation: Two High-Speed Packaging Lines, Persistent OEE Shortfall, and No Systematic Root-Cause Analysis
Line Overview
IndustryConsumer goods packaging — two high-speed lines, multi-SKU production environment with frequent format changeovers
EquipmentFilling stations, labeling units, sealing systems, conveyors, vision inspection systems, end-of-line palletizers
Team18 operators and technicians, 2 line supervisors, 1 process engineer
Prior SystemManual stoppage logging, paper-based changeover records, no structured root-cause analysis process
Oxmaint FeaturesRoot-Cause Analytics · OEE Tracking · Stoppage Pattern Analysis · Changeover Variance Detection · Sensor Drift Monitoring · Production Data Synthesis · Work Order Integration · Defect Rate Tracking
Baseline Pressure Points
67%
Target OEE — actual performance averaged 11 percentage points below target across both lines, with no analytical explanation for the persistent gap
3.2×
Variance in changeover duration across the same format transition — identical changeovers taking anywhere from 22 to 71 minutes with no documented explanation for the spread
43%
Of total stoppage minutes were attributed to causes logged as "other" or "unknown" — making root-cause analysis structurally impossible without better data
Root Cause Analysis
Why OEE Kept Falling Short — And Why Recurring Stoppages Were Never Traced to Their Actual Origin
A structured analysis of 90 days of production logs, stoppage records, changeover data, and sensor performance history identified four structural gaps that allowed OEE losses to accumulate without being diagnosed or addressed at their root cause. The operation had production data — but it existed in forms that were not structured for pattern analysis. Manual stoppage logs used inconsistent categorization. Changeover times were recorded without step-level breakdown. Sensor performance drift was not tracked between calibration events. And no system connected maintenance records to the production losses that equipment degradation was generating. Sign Up Free to identify your own OEE loss sources — or Book a Demo to see how Oxmaint applies root-cause analytics to your packaging line data.
37%
Stoppage Categorization Too Coarse to Support Root-Cause Analysis
Production stoppages were logged manually by operators using broad categories that did not capture equipment location, fault type, or response action. The most frequent log entry across both lines was a generic code covering nearly half of all recorded stops — making it structurally impossible to identify recurring fault patterns from the data that existed.
28%
Changeover Variance Was Logged but Never Analyzed for Cause
Changeover start and end times were recorded, but step-level breakdowns did not exist. A format transition that should take 28 minutes sometimes took 65 minutes, and no record captured where the time was lost or which step had exceeded its standard. The variance was visible in aggregate but undiagnosable without step-level data.
22%
Sensor Drift Between Calibration Events Was Not Detected Until It Caused Quality Failures
Vision inspection and fill-level sensors were calibrated on a fixed schedule but not monitored for drift between events. A sensor reading that drifted gradually from its calibrated setpoint would continue to pass product — or reject good product — until the deviation became severe enough to flag visually or until the next scheduled calibration revealed the error.
13%
No Connection Between Equipment Maintenance Records and Production Loss Data
Maintenance work orders and production loss logs existed in separate systems with no link between them. Equipment that was generating frequent micro-stoppages due to wear or alignment drift was not visible as a maintenance priority because the production impact was not connected to the asset record — and the maintenance team had no visibility into which equipment was actually costing OEE points.
The Solution
How Oxmaint Applied Root-Cause Analytics to Expose and Close the OEE Gap on Both Packaging Lines
The packaging operation deployed Oxmaint without replacing its equipment or restructuring its production team. The platform replaced manual stoppage logging with structured digital capture that required equipment location, fault type, and response action for every recorded stop — converting the data from a log into an analyzable dataset. Changeover tracking was digitized at the step level, making variance visible and traceable to specific transition steps rather than the changeover as a whole. Sensor performance was monitored continuously against calibrated setpoints, with drift alerts generated before deviations reached quality-affecting thresholds. Production loss data was connected to equipment maintenance records — giving the maintenance team a direct view of which assets were generating OEE losses and prioritizing work orders accordingly. Book a Demo to see how the platform brings production analytics discipline to your packaging line environment.
01
Structured Digital Stoppage Capture Enabling Pattern Analysis
Stoppages were captured digitally with mandatory fields for equipment location, fault category, and response action — replacing the broad manual log categories that had made pattern analysis impossible. Within the first 30 days, the data set was sufficient to identify the three fault types accounting for 61% of total stoppage minutes on Line 1.
02
Step-Level Changeover Tracking for Variance Diagnosis
Changeover execution was tracked at the step level — capturing actual versus standard time for each transition step. The analysis revealed that a single mechanical alignment step on the sealing station accounted for 68% of all changeover time variance across both lines, a finding that was invisible in the aggregate duration data that had previously been collected.
03
Continuous Sensor Drift Monitoring Between Calibration Events
Vision inspection and fill-level sensor readings were monitored continuously against calibrated setpoints — with drift alerts generated when readings deviated beyond defined tolerance thresholds. Sensor drift events were flagged and corrected before they reached quality-affecting severity, eliminating the cycle of drift-induced rejects that had previously been discovered only at calibration or quality review.
04
Production Loss to Maintenance Record Linkage for OEE-Driven Work Order Prioritization
Production loss data was connected to equipment asset records — quantifying the OEE impact generated by each asset's failure and degradation events. Maintenance work orders were prioritized by production loss contribution rather than calendar interval, directing resources to the equipment generating the greatest throughput impact rather than the equipment with the longest time since last service.
Results at 90 Days
What OEE and Production Continuity Numbers Looked Like Three Months After Deployment
+9.4
OEE percentage point improvement — from 56% to 65.4% average across both lines at 90 days
58%
Reduction in total unplanned stoppage minutes — driven by root-cause identification and targeted corrective action
41%
Reduction in changeover duration variance — sealing station alignment procedure standardized after step-level analysis
100%
Of sensor drift events detected and corrected before reaching quality-affecting threshold — down from zero pre-deployment detection capability
67%
Reduction in stoppages logged as "unknown" or "other" — structured capture replacing unanalyzable generic categories
3.4×
ROI on platform cost within 90 days from throughput recovery and defect rate reduction
| Metric |
Before Oxmaint |
90 Days After |
Change |
| Average OEE (both lines) |
56.0% |
65.4% |
+9.4 pts |
| Unplanned stoppage minutes |
Baseline |
-58% vs baseline |
-58% |
| Changeover duration variance |
3.2× spread |
1.9× spread |
-41% |
| Sensor drift events (pre-quality impact) |
0% detected early |
100% detected early |
Full coverage |
| Stoppages with analyzable root cause |
57% of stops |
94% of stops |
+37 pts |
| Defect rate (packaging quality rejects) |
Baseline |
-34% vs baseline |
-34% |
Key Business Impact
What Closing the Root-Cause Analytics Gap Means for Packaging Line OEE Programs
"The OEE problems I encounter most often in packaging environments are not caused by major equipment failures — they're caused by things no one has gotten around to measuring properly. Changeovers that vary by 40 minutes with no documented explanation. Sensors that drift between calibrations and quietly create reject spikes that show up as quality losses rather than equipment issues. Stoppages logged under a catch-all category because the data entry system doesn't require specificity. None of these individually looks like a serious problem. Collectively, they can account for 8 to 12 OEE percentage points of chronic underperformance. The fix is not more maintenance personnel — it's better data structure. When you require specific fault capture at every stop, when you track changeover steps rather than just changeover totals, and when you monitor sensors between calibration events rather than waiting for drift to cause a quality event, the problems become visible. And visible problems get solved."
Claire Omondi, Packaging Line Performance Specialist
17 years consumer goods packaging operations · Former line performance lead, multi-format packaging facilities · Specialist in OEE improvement, root-cause analytics, and changeover standardization
OEE Analytics · Stoppage Patterns · Changeover Variance · Sensor Drift
Replace Generic Stoppage Logs With Root-Cause Analytics That Drive OEE Lift
Structured digital stoppage capture, step-level changeover tracking, continuous sensor drift monitoring, and production loss to maintenance linkage — Oxmaint gives packaging operations the analytical foundation to close OEE gaps that conventional maintenance cannot reach.
FAQs
Frequently Asked Questions
How does Oxmaint use root-cause analytics to improve packaging line OEE?
Oxmaint replaces generic stoppage logs with structured digital capture — requiring equipment location, fault type, and response action for every stop. Pattern analysis across the dataset identifies the recurring fault types driving the majority of stoppage minutes and surfaces them for targeted corrective action.
Can Oxmaint identify and reduce changeover time variance on packaging lines?
Yes. Oxmaint tracks changeover execution at the step level — capturing actual versus standard time per step. Variance is traced to specific steps rather than the total changeover, enabling targeted standardization of the steps driving inconsistency.
How does Oxmaint detect sensor drift before it causes quality failures?
Sensor readings are monitored continuously against calibrated setpoints — with drift alerts generated when readings exceed defined tolerance thresholds. Drift events are identified and corrected between calibration events, before they reach quality-affecting severity.
Does Oxmaint connect production loss data to maintenance work orders?
Yes. Production loss events are linked to equipment asset records — quantifying the OEE impact of each asset's degradation and prioritizing maintenance work orders by production loss contribution rather than calendar interval.
How quickly does OEE improvement become measurable after deploying Oxmaint on a packaging line?
Structured stoppage data sufficient for pattern analysis typically accumulates within 30 days. OEE improvement from targeted corrective actions based on root-cause findings is generally measurable within 60–90 days of deployment.
Every Root Cause Identified Is an OEE Point Recovered
Give Your Packaging Line the Analytics Foundation for Sustainable OEE Lift
Oxmaint brings structured stoppage capture, step-level changeover analytics, sensor drift detection, and production-to-maintenance loss linkage to packaging line operations — closing the OEE gaps that generic logs and interval-based maintenance cannot diagnose.